Marktwachstum, Größe, Anteil, Trends, Analyse der wichtigsten Akteure und Prognose für Smart Displays bis 2028
Marktprognose für Smart Displays bis 2028 – Auswirkungen von COVID-19 und globale Analyse nach Größe (bis 12 Zoll, über 12 Zoll – bis 32 Zoll, über 32 Zoll – bis 52 Zoll und über 52 Zoll), Typ (Beschilderung, Display und Spiegel), Auflösung (Full High Definition, Ultra High Definition und andere) und Branche (Verbraucher- und Haushaltsgeräte, Automobil, Gesundheitswesen, Einzelhandel und andere)
- Status : Veröffentlicht
- Berichtscode : TIPTE100000623
- Kategorie : Elektronik und Halbleiter
- Anzahl der Seiten : 205
- Verfügbare Berichtsformate :


- Datum der letzten Aktualisierung : June 12, 2024


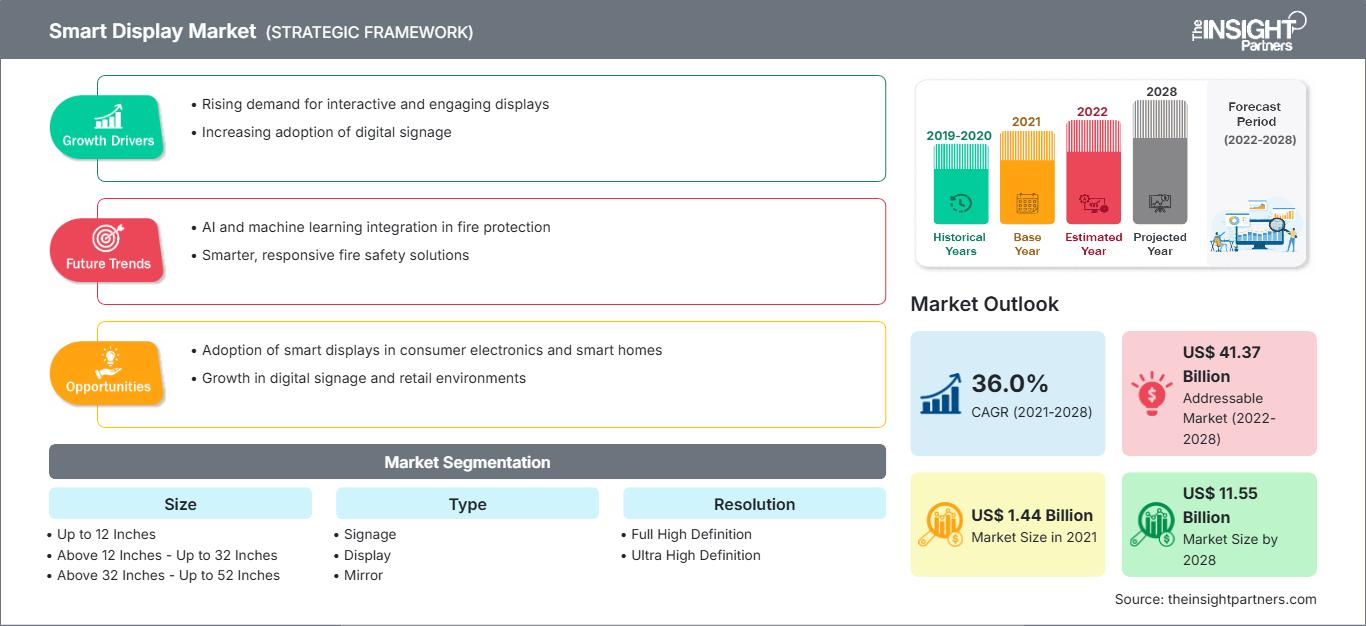
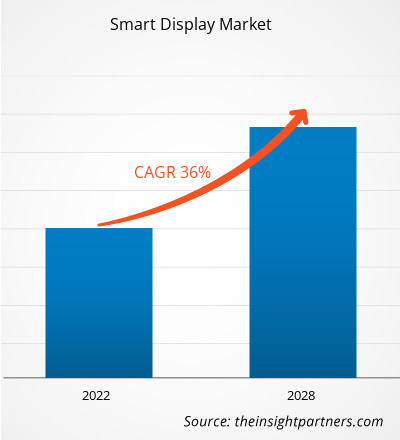
Der Markt für Smart Displays wurde 2021 auf 1.443,74 Millionen US-Dollar geschätzt und soll bis 2028 11.547,23 Millionen US-Dollar erreichen; von 2022 bis 2028 wird eine durchschnittliche jährliche Wachstumsrate (CAGR) von 36,0 % erwartet.
Ein Smart Display ist ein digitales Display, das über Sprachfernbedienungen oder mit dem Internet der Dinge (IoT) verbundene Geräte bedient werden kann. Ein Smart Mirror beispielsweise ist ein innovatives Gerät, das die persönlichen Daten der Benutzer und die Erfahrungen von Käufern im Automobil- und Einzelhandelssektor aufzeichnet. Darüber hinaus verfügt das Smart Display als hochmoderne technische Lösung über interaktive und komplexe Steuerungsfunktionen.
Die hohe Nachfrage der Automobilindustrie nach Smart Mirrors, die neuen und innovativen Funktionen von Smart Mirrors, die steigende Zahl von Internetnutzern und die zunehmende Nutzung intelligenter Geräte entsprechend den Verbraucherpräferenzen, die steigende Nachfrage nach KI- und IoT-fähigen Smart-Home-Geräten, der zunehmende Trend zu kontextsensitiver Beschilderung und die zunehmende Nutzung von Smart Signage im Einzelhandel sind die wichtigsten Wachstumsfaktoren für den Markt für Smart Displays.
Das Wachstum des Einzelhandels wird durch die steigende Kaufkraft der Verbraucher unterstützt. Auch die weltweit rasant wachsenden Einkaufszentren und Einzelhandelsflächen treiben die Nachfrage nach Smart-Signage-Lösungen voran, um Passanten anzulocken und zum Betreten des Geschäfts zu animieren. Daher sind Smart Stores daran interessiert, Programmatic Advertising einzusetzen, um die Markenbekanntheit zu steigern. Smart Signage kann auch als Teil des Bezahlvorgangs eingesetzt werden. Kunden können mit einem Mobilgerät bezahlen, anstatt an der Kasse anzustehen. Mehrere Einzelhändler wie Walmart, Alibaba, Amazon und Carrefour haben weltweit Smart Stores eröffnet. Sie nutzen verschiedene Smart-Retail-Lösungen und -Technologien, wie beispielsweise Smart Signage, in ihren Smart Stores. Einzelhändler weltweit setzen Expansions- und Partnerschaftsstrategien ein, um intelligentere und kassenlose Geschäfte zu eröffnen. All diese Faktoren beflügeln den Markt für Smart Displays.
Passen Sie diesen Bericht Ihren Anforderungen an
Sie erhalten kostenlos Anpassungen an jedem Bericht, einschließlich Teilen dieses Berichts oder einer Analyse auf Länderebene, eines Excel-Datenpakets sowie tolle Angebote und Rabatte für Start-ups und Universitäten.
Markt für intelligente Displays: Strategische Einblicke
-
Holen Sie sich die wichtigsten Markttrends aus diesem Bericht.Dieses KOSTENLOSE Beispiel umfasst Datenanalysen, die von Markttrends bis hin zu Schätzungen und Prognosen reichen.
Markteinblicke für Smart Displays
Präsenz beliebter Marken
Sobald sich Kunden an ein Produkt einer bestimmten Marke gewöhnt haben, kaufen sie weitere Produkte derselben Marke. Einige bekannte Marken wie Google, Amazon, Inc., Bosch, Panasonic, BenQ Corporation, LG Electronics, Lenovo Group, Ltd., Samsung Corporation und Sony Corporation bieten verschiedene Smart-Display-Lösungen für die Automobil-, Gesundheits-, Wohn- und Einzelhandelsbranche an. Diese Marken ziehen mühelos ihre treuen Kunden an und sind ein wichtiger Wachstumsfaktor für den Smart-Display-Markt. Manchmal bewerben Marken ihre Produkte vor der Markteinführung, um bei den Kunden einen Hype zu erzeugen. Beispielsweise wurde Xiaomis Smart Display 10 im März 2022 auf mehreren Websites gelistet und das Produkt wurde im April 2022 auf den Markt gebracht. Im Januar 2022 brachte Google sein Smart Display Google Nest Hub der 2. Generation in Indien für 103,24 US-Dollar auf den Markt. Im Juni 2021 brachte Amazon zwei neue Smart-Display-Produkte auf den indischen Markt: Echo Show 10 und 5. Die steigende Beliebtheit der Marken treibt also das Wachstum des Smart-Display-Marktes voran.
Markteinblicke nach Größe
Basierend auf der Größe ist der Smart-Display-Markt in bis zu 12 Zoll, über 12 Zoll – bis zu 32 Zoll, über 32 Zoll – bis zu 52 Zoll und über 52 Zoll unterteilt. Die Bildschirmgrößen variieren von Hersteller zu Hersteller. Während einige Hersteller auch bei kleineren Bildschirmgrößen eine höhere Funktionalität bieten, ziehen es andere vor, die Funktionalität je nach Bildschirmgröße zu variieren. Der Markt wird hauptsächlich durch die wachsende Nachfrage nach mittelgroßen Smart-Signage-Displays in verschiedenen Branchen weltweit angetrieben.
Markteinblicke nach Auflösung
Basierend auf der Auflösung ist der Smart-Display-Markt in Full High Definition (FHD), Ultra High Definition (UHD) und andere segmentiert. Smart Displays mit HD-Auflösung werden hauptsächlich im Wohnbereich eingesetzt. Die meisten anderen Anwendungen, wie etwa Werbeschilder oder Smart Kioske, verwenden jedoch zunehmend Displays mit UHD- und FHD-Auflösung. Der Markt wird vor allem durch die wachsende Nachfrage nach Smart Signage-Displays mit besserer Auflösung angetrieben, damit die Benutzer ein immersives Erlebnis genießen können.
Die Akteure des Smart Display-Marktes verfolgen Strategien wie Fusionen, Übernahmen und Marktinitiativen, um ihre Position auf dem Markt zu behaupten. Einige Entwicklungen der wichtigsten Marktteilnehmer sind unten aufgeführt:
- Laut NoviSign, einem Branchenführer und Pionier im Bereich Android Digital Signage, ist die NoviSign Android Digital Signage App derzeit für alle Android-basierten BRAVIA Professional-Displays von Sony verfügbar. Die professionelle BRAVIA-Reihe von Sony unterstützt 4K und HDR, verfügt über eine System-on-a-Chip-Plattform und ist in Größen von 32 bis 100 Zoll erhältlich.
- BenQ, ein führendes Unternehmen im Bereich interaktiver Displaytechnologien, ist der Integrated Solutions Initiative for Education von Google beigetreten. Durch die Beteiligung an dieser Initiative unterstreicht BenQ sein Engagement für die Bereitstellung von Bildungslösungen, die es Schulen ermöglichen, widerstandsfähigere aktive Lernumgebungen zu schaffen, die für Präsenz- und Fernunterricht geeignet sind.
Regionale Einblicke in den Markt für intelligente Displays
Die Analysten von The Insight Partners haben die regionalen Trends und Faktoren, die den Smart-Display-Markt im Prognosezeitraum beeinflussen, ausführlich erläutert. In diesem Abschnitt werden auch die Marktsegmente und die geografische Lage in Nordamerika, Europa, dem asiatisch-pazifischen Raum, dem Nahen Osten und Afrika sowie Süd- und Mittelamerika erörtert.
Umfang des Marktberichts zum Smart Display
| Berichtsattribut | Einzelheiten |
|---|---|
| Marktgröße in 2021 | US$ 1.44 Billion |
| Marktgröße nach 2028 | US$ 11.55 Billion |
| Globale CAGR (2021 - 2028) | 36.0% |
| Historische Daten | 2019-2020 |
| Prognosezeitraum | 2022-2028 |
| Abgedeckte Segmente |
By Größe
|
| Abgedeckte Regionen und Länder |
Nordamerika
|
| Marktführer und wichtige Unternehmensprofile |
|
Dichte der Marktteilnehmer für Smart Displays: Auswirkungen auf die Geschäftsdynamik verstehen
Der Markt für Smart Displays wächst rasant. Die steigende Nachfrage der Endnutzer ist auf Faktoren wie veränderte Verbraucherpräferenzen, technologische Fortschritte und ein stärkeres Bewusstsein für die Produktvorteile zurückzuführen. Mit der steigenden Nachfrage erweitern Unternehmen ihr Angebot, entwickeln Innovationen, um den Bedürfnissen der Verbraucher gerecht zu werden, und nutzen neue Trends, was das Marktwachstum weiter ankurbelt.
- Holen Sie sich die Markt für intelligente Displays Übersicht der wichtigsten Akteure
Der globale Markt für Smart Displays ist nach Größe, Typ, Auflösung und Branche segmentiert. Nach Größe ist der Markt in bis zu 12 Zoll, über 12 Zoll – bis zu 32 Zoll, über 32 Zoll – bis zu 52 Zoll und über 52 Zoll unterteilt. Nach Typ ist der Markt in Beschilderung, Display und Spiegel segmentiert. Nach Auflösung ist der Markt in Full High Definition, Ultra High Definition und Sonstige segmentiert. Darüber hinaus ist der Markt für Smart Displays nach Branche in Verbraucher- und Haushaltsgeräte, Automobil, Einzelhandel, Gesundheitswesen und Sonstige segmentiert.
Alphabet Inc.; Amazon.com, Inc.; LG Electronics; LENOVO GROUP LIMITED; Magna International Inc; Panasonic Corporation; Sony Corporation; BenQ Corporation; NEXCOM International Co., Ltd.; und Samsung Electronics Co., Ltd. sind die wichtigsten Akteure auf dem Markt für Smart Displays, die für die Forschungsstudie berücksichtigt wurden. Darüber hinaus wurden in diesem Forschungsbericht mehrere andere bedeutende Marktteilnehmer untersucht und analysiert, um einen ganzheitlichen Überblick über den globalen Markt für Smart Displays und sein Ökosystem zu erhalten.

Naveen ist ein erfahrener Marktforschungs- und Beratungsexperte mit über 9 Jahren Erfahrung in kundenspezifischen, syndizierten und Beratungsprojekten. In seiner aktuellen Funktion als Associate Vice President hat er erfolgreich Stakeholder entlang der gesamten Projektwertschöpfungskette gemanagt und ist Autor von über 100 Forschungsberichten und über 30 Beratungsaufträgen. Seine Arbeit erstreckt sich auf Industrie- und Regierungsprojekte und trägt maßgeblich zum Kundenerfolg und zur datengesteuerten Entscheidungsfindung bei.
Naveen hat einen Ingenieursabschluss in Elektronik und Kommunikation von der VTU, Karnataka, und einen MBA in Marketing und Operations von der Manipal University. Er ist seit 9 Jahren aktives IEEE-Mitglied und nimmt an Konferenzen und technischen Symposien teil und engagiert sich ehrenamtlich auf Sektions- und regionaler Ebene. Vor seiner aktuellen Position arbeitete er als Associate Strategic Consultant bei IndustryARC und als Industrial Server Consultant bei Hewlett Packard (HP Global).
- Umfassende Analyse der Marktgröße und Prognosen
- Detaillierte Segmentierungsanalyse
- Tiefgehende Bewertung der Marktdynamik
- Einblicke auf regionaler und nationaler Ebene
- Wettbewerbslandschaft und Unternehmens-Benchmarking
- Strategische Business Intelligence
Erfahrungsberichte
Der SCADA-Systemmarktbericht von Insight Partners ist umfassend und bietet wertvolle Einblicke in aktuelle Trends und Zukunftsprognosen. Das Team war durchweg hochprofessionell, reaktionsschnell und hilfsbereit. Wir sind sehr zufrieden und können die Dienstleistungen wärmstens empfehlen.
RAN KEDEM Partner, Reali Technologies LTDsIch habe einen Bericht über einen sehr spezifischen Softwaremarkt angefordert, und das Team hat ihn innerhalb weniger Tage erstellt. Die Informationen waren sehr relevant und gut präsentiert. Anschließend habe ich einige Änderungen und Ergänzungen zum Bericht angefordert. Das Team reagierte erneut sehr schnell, und ich erhielt den Abschlussbericht in weniger als einer Woche.
JEAN-HERVE JENN Vorsitzende, Future AnalyticaWir haben mit The Insight Partners für eine wichtige Marktstudie und Prognose zusammengearbeitet. Sie gaben uns klare Einblicke in Chancen und Risiken, die uns bei der Gestaltung unserer Pläne halfen. Ihre Recherchen waren benutzerfreundlich und basierten auf soliden Daten. Sie halfen uns, kluge und sichere Entscheidungen zu treffen. Wir können sie wärmstens empfehlen.
PIYUSH NAGPAL Sr. Vizepräsident, Fernlicht GlobalDie Insight Partners lieferten aufschlussreiche, gut strukturierte Marktforschung mit fundierter Fachkompetenz. Ihr Team war durchweg professionell und reaktionsschnell. Die benutzerfreundliche Website ermöglichte den Zugriff auf Branchenberichte. Wir empfehlen sie wärmstens für zuverlässige und hochwertige Forschungsdienstleistungen.
YUKIHIKO ADACHI Geschäftsführer, Deep Blue, LLC.Dies ist das erste Mal, dass ich einen Marktbericht von The Insight Partners erworben habe. Obwohl ich zunächst unsicher war, besuchte ich die Website und fühlte mich dann sicherer, das Risiko einzugehen und einen Marktbericht zu kaufen. Ich bin mit der Qualität des Berichts und dem Kundenservice rundum zufrieden. Ich hatte einige Fragen und Anmerkungen zum ersten Bericht, aber nach einigen E-Mail-Gesprächen mit dem Analysten bin ich überzeugt, dass ich einen Bericht habe, den ich als Input für unseren strategischen Planungsprozess verwenden kann. Vielen Dank, dass Sie sich die Zeit genommen und dies zu einer positiven Erfahrung gemacht haben. Ich werde Ihren Service auf jeden Fall weiterempfehlen und Sie werden meine erste Anlaufstelle sein, wenn wir weitere Marktdaten benötigen.
JOHN SUZUKI Präsident und Chief Executive Officer, Vorstandsmitglied, BK TechnologiesIch möchte mich für Ihre Unterstützung und die Professionalität bedanken, die Sie bei der Bearbeitung meiner Informationsanfrage zum IVD-Markt für Infektionskrankheiten in Nigeria gezeigt haben. Ich schätze Ihre Geduld, Ihre Beratung und die Tatsache, dass Sie bereit waren, einen Rabatt anzubieten, der uns schließlich den Abschluss eines Geschäfts ermöglichte. Ich freue mich darauf, The Insight Partners in Zukunft wieder zu beauftragen, dank des Eindrucks, den Sie bei dieser ersten Begegnung bei mir hinterlassen haben.
DR. CHIJIOKE ONYIA GESCHÄFTSFÜHRERIN, PineCrest Healthcare Ltd.Grund zum Kauf
- Fundierte Entscheidungsfindung
- Marktdynamik verstehen
- Wettbewerbsanalyse
- Kundeneinblicke
- Marktprognosen
- Risikominimierung
- Strategische Planung
- Investitionsbegründung
- Identifizierung neuer Märkte
- Verbesserung von Marketingstrategien
- Steigerung der Betriebseffizienz
- Anpassung an regulatorische Trends


