Markt für räumliches Computing – Erkenntnisse aus globaler und regionaler Analyse – Prognose bis 2030
Historische Daten : 2020-2021 | Basisjahr : 2022 | Prognosezeitraum : 2023-2030Marktgröße und -prognose für Spatial Computing (2020–2030), Bericht über globale und regionale Anteile, Trends und Wachstumschancenanalyse: Nach Komponente [Hardware (Headset und andere), Software und Service], Technologie [Augmented Reality (AR), Virtual Reality (VR) und Mixed Reality (MR)], Endbenutzer [Architektur, Ingenieurwesen und Bauwesen (AEC); Verbraucher; Bildung; Gesundheitswesen; Einzelhandel; und andere] und Geografie
- Status : Veröffentlichte Daten
- Berichtscode : TIPRE00039173
- Kategorie : Technologie, Medien und Telekommunikation
- Anzahl der Seiten : 150
- Verfügbare Berichtsformate :


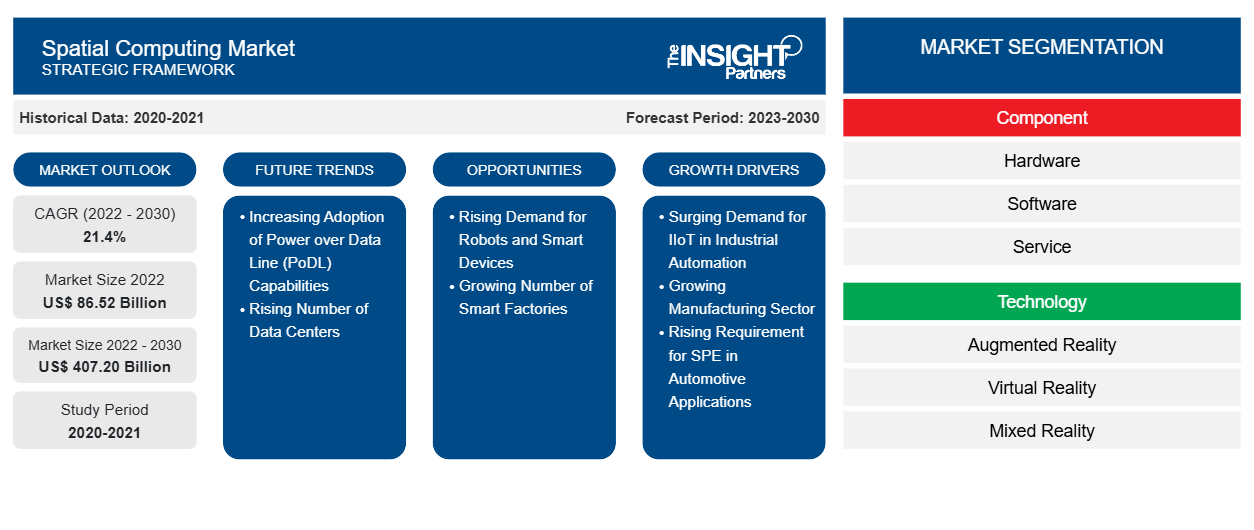
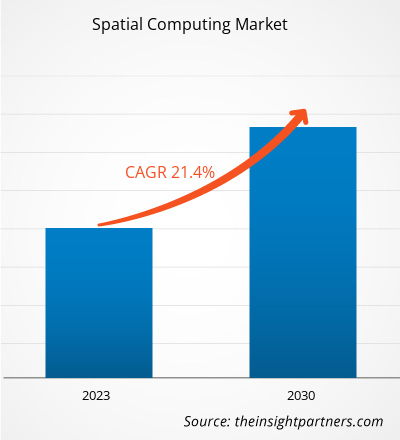
Der Markt für räumliches Computing wurde im Jahr 2022 auf 86,52 Milliarden US-Dollar geschätzt und soll bis 2030 407,20 Milliarden US-Dollar erreichen; von 2022 bis 2030 wird eine durchschnittliche jährliche Wachstumsrate (CAGR) von 21,4 % erwartet. Der technologische Fortschritt und die Verbreitung von Mixed Reality werden voraussichtlich weiterhin die wichtigsten Trends auf dem Markt für räumliches Computing bleiben.
Marktanalyse für räumliches Computing
Das moderne Internet, auch Web 3.0 genannt, nutzt eine Reihe fortschrittlicher Technologien, die Computer zunehmend unsichtbar machen. Dies geschieht durch die Integration der Benutzeroberfläche (UI) in die physische Umgebung. Die Spatial-Computing-Technologie integriert Computer nahtlos in die Umgebung, indem sie die natürlichen räumlichen Fähigkeiten des Menschen nutzt, um die Produktivität zu steigern.
Es wird erwartet, dass Spatial Computing die täglichen Aktivitäten dramatisch verändern wird und bereits jetzt einen enormen Einfluss auf die Lebensweise der Menschen hat. Ein einfaches Beispiel für die Spatial Computing-Revolution ist die Standortmarkierung in sozialen Medien. Obwohl sie als grundlegender Bestandteil jedes Social-Media-Posts betrachtet werden kann, bietet sie den Benutzern durch standortspezifische Informationen einen robusten Kontext und liefert Erkenntnisse über die Zielgruppe. Die Verwendung des Global Positioning System (GPS) eines Fahrzeugs oder Telefons ist ein weiteres Beispiel für die Technologierevolution.
In vielen Fällen wird die Leistungsfähigkeit dieser Technologien größer, wenn sie in Synergie miteinander und nicht isoliert voneinander arbeiten. Um dieses Problem zu lösen, wurde das Protokoll des Institute of Electrical and Electronics Engineers (IEEE) für Web 3.0, auch bekannt als Spatial Web/Metaverse, veröffentlicht. Es bietet technische Standards für die organisierte und harmonische Kommunikation dieser Technologien untereinander.
Marktübersicht für Spatial Computing
Der Bericht enthält Wachstumsaussichten im Lichte der aktuellen Markttrends für räumliches Computing und der treibenden Faktoren, die das Marktwachstum beeinflussen. Der globale Markt erlebt ein starkes Wachstum und wird in den kommenden Jahren voraussichtlich weiter wachsen. Spatial Computing kann als Digitalisierung von Aktionen bezeichnet werden, an denen Maschinen, Objekte, Menschen und die Umgebungen, in denen sie stattfinden, beteiligt sind, um Aktionen und Interaktionen zu ermöglichen und zu optimieren. Die Technologie birgt das Potenzial, die Art und Weise, wie Industrieunternehmen ihre Abläufe für Mitarbeiter an der Front in Fabriken, auf Baustellen und in Lagern optimieren, digital zu verändern und einen digital erweiterten dimensionalen Kontext für Unternehmensaktionen und -interaktionen zu ermöglichen. In den letzten Jahren gab es Fortschritte in den Technologien wie künstlicher Intelligenz (KI), maschinellem Lernen (ML), natürlicher Sprachverarbeitung (NLP), Kamerasensoren, Computervision, Internet der Dinge (IoT), virtueller Realität (VR), erweiterter Realität (AR), gemischter Realität (MR) und erweiterter Realität (XR), die räumliches Computing ermöglichen. Die Marktprognose für räumliches Computing wird unter Berücksichtigung all dieser Trends sowie verschiedener sekundärer und primärer Forschungsergebnisse geschätzt.
Passen Sie diesen Bericht Ihren Anforderungen an
Sie erhalten kostenlos individuelle Anpassungen an jedem Bericht, einschließlich Teilen dieses Berichts oder einer Analyse auf Länderebene, eines Excel-Datenpakets sowie tolle Angebote und Rabatte für Start-ups und Universitäten.
Markt für räumliches Computing: Strategische Einblicke
-
Holen Sie sich die wichtigsten Markttrends aus diesem Bericht.Dieses KOSTENLOSE Beispiel umfasst eine Datenanalyse von Markttrends bis hin zu Schätzungen und Prognosen.
Treiber und Chancen des Spatial Computing-Marktes
Fortschritte bei Echtzeit-Rendering-Engines treiben das Wachstum des Spatial Computing-Marktes voran
Dank der aktuellen Software und der verfügbaren Technologie ist Rendering nicht mehr nur Computer-Enthusiasten vorbehalten, sondern ein schnell wachsendes Feld, das Architekten, Künstler, Entwickler, Ingenieure und andere umfasst. Trotz gewisser Grenzen der Technologie forschen Fachleute ständig an der Integration verschiedener multivariater Technologien, um Rendering und Visualisierung für den Mainstream zu gewährleisten. Die Anwendung von KI zur Unterstützung des Rendering-Prozesses gewinnt im Bereich der Architekturvisualisierung an Bedeutung. Ohne manuelle Optimierung können Benutzer ML-Algorithmen und tiefe neuronale Netzwerke (DNN) verwenden, um lebensechtere und differenziertere Visualisierungen zu erstellen. Mithilfe von KI kann der Rendering-Prozess weiter optimiert werden, um Geschwindigkeit und Effizienz zu verbessern. Solche Fortschritte tragen zum wachsenden Markt für räumliches Computing bei.
Segmentierungsanalyse des Marktberichts zum räumlichen Computing
Wichtige Segmente, die zur Ableitung der Marktanalyse für räumliches Computing beigetragen haben, sind Komponente, Technologie und Endbenutzer.
- Basierend auf den Komponenten ist der Markt in Hardware, Software und Service unterteilt. Der Markt für das Hardwaresegment ist weiter unterteilt in Headsets und Sonstiges. Im Jahr 2022 hielt das Hardwaresegment einen größeren Marktanteil.
- Basierend auf der Technologie ist der Markt in Augmented Reality (AR), Virtual Reality (VR) und Mixed Reality (MR) segmentiert. Das Segment der Großunternehmen dominierte den Markt im Jahr 2023 aufgrund der wachsenden Investitionen großer Unternehmen in Meeting-Management-Software.
- In Bezug auf die Endnutzer ist der Markt in Architektur, Ingenieurwesen und Bauwesen (AEC), Verbraucher, Bildung, Gesundheitswesen, Einzelhandel und andere segmentiert. Meeting-Management-Software wird häufig in Unternehmensumgebungen verwendet. Auch Behörden, Bildungseinrichtungen und andere Endnutzer nutzen die Meeting-Management-Software in großem Umfang.
Spatial Computing Marktanteilsanalyse nach Geografie
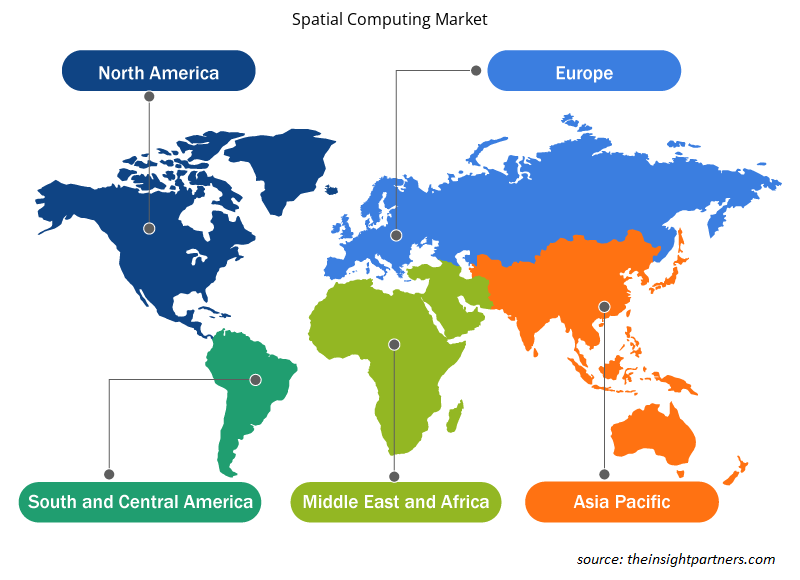
- In Bezug auf den Umsatz dominierte Nordamerika im Jahr 2022 den Marktanteil im Bereich Spatial Computing. Es wird erwartet, dass APAC im Prognosezeitraum am schnellsten wächst. Der Markt in APAC ist in Australien, China, Indien, Japan, Südkorea und den Rest von APAC unterteilt. Die Region ist demografisch vielfältig. Es ist eines der größten Technologieforschungszentren und die Mehrheit der Halbleiter der Welt wird in der Region hergestellt.
- Angesichts des wachsenden Bedarfs an fortschrittlichen Fertigungstechnologien übernehmen Hersteller in der Region AR- und VR-Technologien in rasantem Tempo. Da Länder wie die USA, Deutschland und Großbritannien ihre Anforderungen an importierte Produkte verschärfen, entscheiden sich Lieferanten aus dem asiatisch-pazifischen Raum zunehmend für räumliche Computertechnologien, um diese Vorschriften und Anforderungen besser einhalten zu können.
- Mit dem wachsenden Trend zur spezialisierten und personalisierten Patientenversorgung in der Region Asien-Pazifik gewinnt die Präzisionsmedizin an Bedeutung. Die zunehmende Verbreitung von Zivilisationskrankheiten und das zunehmende Bewusstsein für diese Krankheiten sind Faktoren, die Präzisions- und personalisierte Medizin fördern. Um eine effektivere Versorgung zu gewährleisten, werden die individuellen Bedürfnisse eines Patienten mit räumlicher Datenverarbeitung kombiniert, um solche Medikamente zu entwickeln. Die räumliche Datenverarbeitung wird auch vom Screening von Arzneimittelmolekülen bis zur Herstellung medizinischer Geräte eingesetzt. All diese Faktoren treiben das Wachstum des Marktes für räumliche Datenverarbeitung in der Region Asien-Pazifik voran.
Neuigkeiten und aktuelle Entwicklungen zum Spatial Computing-Markt
Der Markt für räumliche Computer wird durch die Erhebung qualitativer und quantitativer Daten nach Primär- und Sekundärforschung bewertet, die wichtige Unternehmensveröffentlichungen, Verbandsdaten und Datenbanken umfasst. Im Folgenden finden Sie eine Liste der Entwicklungen auf dem Markt für räumliche Computer:
- Im März 2024 gab das zu Bupa gehörende Cromwell Hospital in London bekannt, dass sein Operationsteam bei zwei mikrochirurgischen Eingriffen an der Wirbelsäule ein MR-Headset verwendet hat. Die Chirurgen verwendeten das Vision Pro-Headset von Apple, um medizinische Eingriffe zu erleichtern, was einen bemerkenswerten Fortschritt in der Gesundheitstechnologie darstellt. Nach seiner Veröffentlichung in den USA hat Apples Vision Pro einen Anstieg der mit dem Gerät kompatiblen Gesundheitsanwendungen erlebt, wie aus einer Pressemitteilung von Apple hervorgeht. Bemerkenswert unter diesen ist die Mako SmartRobotics-App von Stryker, die auf Chirurgen zugeschnitten ist, die Hüft- und Kniegelenkersatz durchführen.
(Quelle: Cromwell Hospital, Pressemitteilung)
- Im September 2023 begannen die Vorbestellungen für Meta Quest 3. Der Preis für das weltweit erste MR-Headset für den Massenmarkt wurde bekannt gegeben. Er begann bei 499,99 US-Dollar für die 128-GB-Version und 649,99 US-Dollar für die 512-GB-Variante. Meta Quest 3 verfügt über bahnbrechende MR, die ein breites Spektrum an Erfahrungen ermöglicht, und war das weltweit erste Gerät mit der neuen Snapdragon XR2 Gen 2-Plattform.
(Quelle: Meta, Pressemitteilung)
Regionale Einblicke in den Spatial Computing-Markt
Die regionalen Trends und Faktoren, die den Spatial Computing-Markt im Prognosezeitraum beeinflussen, wurden von den Analysten von Insight Partners ausführlich erläutert. In diesem Abschnitt werden auch die Marktsegmente und die Geografie des Spatial Computing in Nordamerika, Europa, im asiatisch-pazifischen Raum, im Nahen Osten und Afrika sowie in Süd- und Mittelamerika erörtert.
- Holen Sie sich die regionalspezifischen Daten für den Spatial Computing-Markt
Umfang des Marktberichts zum räumlichen Computing
| Berichtsattribut | Details |
|---|---|
| Marktgröße im Jahr 2022 | 86,52 Milliarden US-Dollar |
| Marktgröße bis 2030 | 407,20 Milliarden US-Dollar |
| Globale CAGR (2022 - 2030) | 21,4 % |
| Historische Daten | 2020-2021 |
| Prognosezeitraum | 2023–2030 |
| Abgedeckte Segmente |
Nach Komponente
|
| Abgedeckte Regionen und Länder |
Nordamerika
|
| Marktführer und wichtige Unternehmensprofile |
|
Dichte der Marktteilnehmer im Bereich Spatial Computing: Die Auswirkungen auf die Geschäftsdynamik verstehen
Der Markt für Spatial Computing wächst rasant, angetrieben durch die steigende Nachfrage der Endnutzer aufgrund von Faktoren wie sich entwickelnden Verbraucherpräferenzen, technologischen Fortschritten und einem größeren Bewusstsein für die Vorteile des Produkts. Mit steigender Nachfrage erweitern Unternehmen ihr Angebot, entwickeln Innovationen, um die Bedürfnisse der Verbraucher zu erfüllen, und nutzen neue Trends, was das Marktwachstum weiter ankurbelt.
Die Marktteilnehmerdichte bezieht sich auf die Verteilung der Firmen oder Unternehmen, die in einem bestimmten Markt oder einer bestimmten Branche tätig sind. Sie gibt an, wie viele Wettbewerber (Marktteilnehmer) in einem bestimmten Marktraum im Verhältnis zu seiner Größe oder seinem gesamten Marktwert präsent sind.
Die wichtigsten auf dem Spatial Computing-Markt tätigen Unternehmen sind:
- Adobe Inc
- Alphabet Inc
- Apple Inc
- Autodesk Inc
- Dassault Systemes
- HTC
Haftungsausschluss : Die oben aufgeführten Unternehmen sind nicht in einer bestimmten Reihenfolge aufgeführt.
- Überblick über die wichtigsten Akteure auf dem Spatial Computing-Markt
Marktbericht zum Thema Spatial Computing – Abdeckung und Ergebnisse
Die „Marktgröße und -prognose für Spatial Computing (2022–2030)“ bietet eine detaillierte Analyse des Marktes, die die unten genannten Bereiche abdeckt:
- Marktgröße und Prognose auf globaler, regionaler und Länderebene für alle wichtigen Marktsegmente, die im Rahmen des Projekts abgedeckt sind
- Marktdynamik wie Treiber, Beschränkungen und wichtige Chancen
- Wichtige Zukunftstrends
- Detaillierte PEST/Porters Five Forces- und SWOT-Analyse
- Globale und regionale Marktanalyse mit wichtigen Markttrends, wichtigen Akteuren, Vorschriften und aktuellen Marktentwicklungen
- Branchenlandschaft und Wettbewerbsanalyse, einschließlich Marktkonzentration, Heatmap-Analyse, prominenten Akteuren und aktuellen Entwicklungen
- Detaillierte Firmenprofile

Ankita ist eine dynamische Marktforschungs- und Beratungsexpertin mit über 8 Jahren Erfahrung in den Bereichen Technologie, Medien, IKT sowie Elektronik und Halbleiter. Sie hat über 100 Beratungs- und Forschungsaufträge für globale Kunden wie Microsoft, Oracle, NEC Corporation, SAP, KPMG und Expeditors International erfolgreich geleitet und durchgeführt. Zu ihren Kernkompetenzen gehören Marktbewertung, Datenanalyse, Prognose, Strategieformulierung, Wettbewerbsbeobachtung und das Verfassen von Berichten. Ankita ist versiert in der Abwicklung kompletter Projektzyklen – von der Angebotserstellung vor dem Verkauf und Kundengesprächen bis hin zur Bereitstellung umsetzbarer Erkenntnisse nach dem Verkauf. Sie ist versiert in der Leitung funktionsübergreifender Teams, der Strukturierung komplexer Forschungsmodule und der Ausrichtung von Lösungen an kundenspezifischen Geschäftszielen. Ihre ausgezeichneten Kommunikationsfähigkeiten, Führungsqualitäten und Präsentationsfähigkeiten haben es ihr ermöglicht, in einem schnelllebigen und sich entwickelnden Marktumfeld stets wertorientierte Ergebnisse zu liefern.
- Historische Analyse (2 Jahre), Basisjahr, Prognose (7 Jahre) mit CAGR
- PEST- und SWOT-Analyse
- Marktgröße Wert/Volumen – Global, Regional, Land
- Branchen- und Wettbewerbslandschaft
- Excel-Datensatz
Erfahrungsberichte
Der SCADA-Systemmarktbericht von Insight Partners ist umfassend und bietet wertvolle Einblicke in aktuelle Trends und Zukunftsprognosen. Das Team war durchweg hochprofessionell, reaktionsschnell und hilfsbereit. Wir sind sehr zufrieden und können die Dienstleistungen wärmstens empfehlen.
RAN KEDEM Partner, Reali Technologies LTDsIch habe einen Bericht über einen sehr spezifischen Softwaremarkt angefordert, und das Team hat ihn innerhalb weniger Tage erstellt. Die Informationen waren sehr relevant und gut präsentiert. Anschließend habe ich einige Änderungen und Ergänzungen zum Bericht angefordert. Das Team reagierte erneut sehr schnell, und ich erhielt den Abschlussbericht in weniger als einer Woche.
JEAN-HERVE JENN Vorsitzende, Future AnalyticaWir haben mit The Insight Partners für eine wichtige Marktstudie und Prognose zusammengearbeitet. Sie gaben uns klare Einblicke in Chancen und Risiken, die uns bei der Gestaltung unserer Pläne halfen. Ihre Recherchen waren benutzerfreundlich und basierten auf soliden Daten. Sie halfen uns, kluge und sichere Entscheidungen zu treffen. Wir können sie wärmstens empfehlen.
PIYUSH NAGPAL Sr. Vizepräsident, Fernlicht GlobalDie Insight Partners lieferten aufschlussreiche, gut strukturierte Marktforschung mit fundierter Fachkompetenz. Ihr Team war durchweg professionell und reaktionsschnell. Die benutzerfreundliche Website ermöglichte den Zugriff auf Branchenberichte. Wir empfehlen sie wärmstens für zuverlässige und hochwertige Forschungsdienstleistungen.
YUKIHIKO ADACHI Geschäftsführer, Deep Blue, LLC.Dies ist das erste Mal, dass ich einen Marktbericht von The Insight Partners erworben habe. Obwohl ich zunächst unsicher war, besuchte ich die Website und fühlte mich dann sicherer, das Risiko einzugehen und einen Marktbericht zu kaufen. Ich bin mit der Qualität des Berichts und dem Kundenservice rundum zufrieden. Ich hatte einige Fragen und Anmerkungen zum ersten Bericht, aber nach einigen E-Mail-Gesprächen mit dem Analysten bin ich überzeugt, dass ich einen Bericht habe, den ich als Input für unseren strategischen Planungsprozess verwenden kann. Vielen Dank, dass Sie sich die Zeit genommen und dies zu einer positiven Erfahrung gemacht haben. Ich werde Ihren Service auf jeden Fall weiterempfehlen und Sie werden meine erste Anlaufstelle sein, wenn wir weitere Marktdaten benötigen.
JOHN SUZUKI Präsident und Chief Executive Officer, Vorstandsmitglied, BK TechnologiesIch möchte mich für Ihre Unterstützung und die Professionalität bedanken, die Sie bei der Bearbeitung meiner Informationsanfrage zum IVD-Markt für Infektionskrankheiten in Nigeria gezeigt haben. Ich schätze Ihre Geduld, Ihre Beratung und die Tatsache, dass Sie bereit waren, einen Rabatt anzubieten, der uns schließlich den Abschluss eines Geschäfts ermöglichte. Ich freue mich darauf, The Insight Partners in Zukunft wieder zu beauftragen, dank des Eindrucks, den Sie bei dieser ersten Begegnung bei mir hinterlassen haben.
DR. CHIJIOKE ONYIA GESCHÄFTSFÜHRERIN, PineCrest Healthcare Ltd.Grund zum Kauf
- Fundierte Entscheidungsfindung
- Marktdynamik verstehen
- Wettbewerbsanalyse
- Kundeneinblicke
- Marktprognosen
- Risikominimierung
- Strategische Planung
- Investitionsbegründung
- Identifizierung neuer Märkte
- Verbesserung von Marketingstrategien
- Steigerung der Betriebseffizienz
- Anpassung an regulatorische Trends


Exklusive Berichtsrabatte freischalten
Jetzt anfragen


 Kostenlose Probe anfordern für - Markt für räumliches Computing