Estrategias de mercado de Robot cartesiano, principales actores, oportunidades de crecimiento, análisis y pronóstico para 2031
Datos históricos : 2021-2022 | Año base : 2023 | Período de pronóstico : 2024-2031Tamaño y pronóstico del mercado de robots cartesianos (2021-2031), participación global y regional, tendencias y análisis de oportunidades de crecimiento. Cobertura del informe: por tipo de eje (1 eje, 2 ejes, 3 ejes, 4 ejes), sectores industriales (fabricación, automoción, electricidad y electrónica, alimentos y bebidas, productos químicos y petroquímicos, otros) y geografía.
- Estado : Datos publicados
- Código de informe : TIPRE00006984
- Categoría : Electrónica y semiconductores
- Número de páginas : 150
- Formatos de informe disponibles :


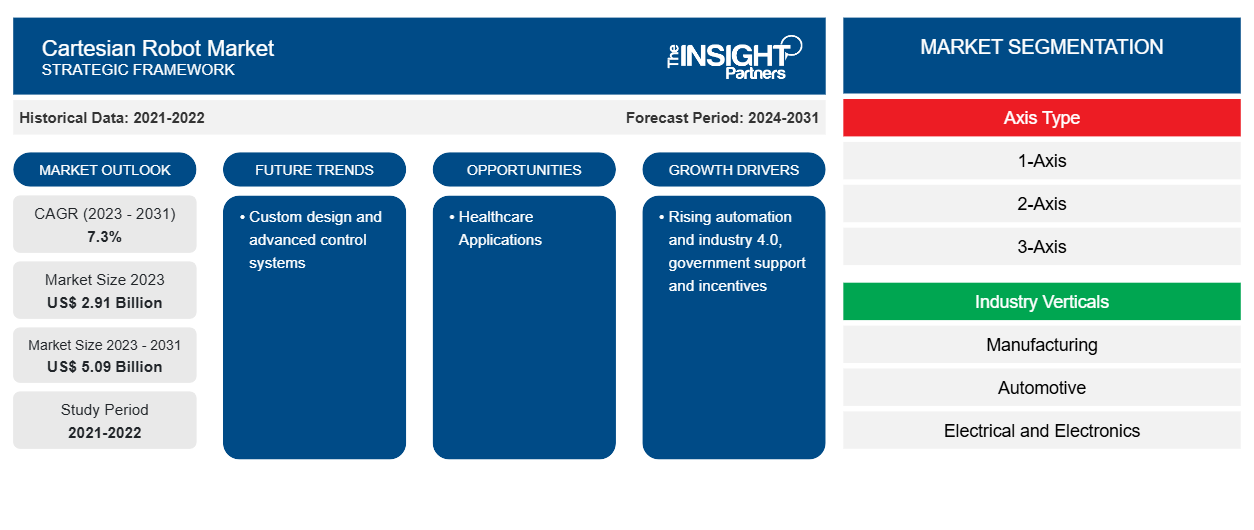
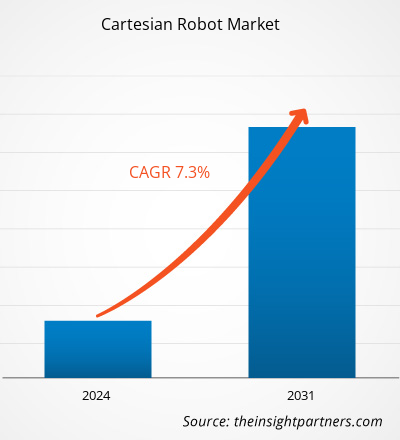
Se proyecta que el tamaño del mercado de robots cartesianos alcance los 5.090 millones de dólares en 2031, frente a los 2.910 millones de dólares en 2023. Se espera que el mercado registre una CAGR del 7,3 % entre 2023 y 2031. Es probable que el diseño personalizado y los sistemas de control avanzados sigan siendo tendencias clave en el mercado de robots cartesianos .
Análisis del mercado de robots cartesianos
Los robots cartesianos, los robots lineales y los robots de pórtico son términos que se utilizan para designar a los robots mecatrónicos que se mueven a lo largo de ejes lineales. Los robots de pórtico se parecen a las grúas de pórtico y actúan de manera similar. Sin embargo, los robots de pórtico pueden hacer más que simplemente levantar y mover. Pueden tener una funcionalidad específica según los requisitos.
Descripción general del mercado de robots cartesianos
Los robots cartesianos son una tecnología robótica popular y sencilla que los fabricantes han utilizado durante décadas. Empresas de todos los sectores y aplicaciones están aprovechando los beneficios de esta tecnología escalable . Los robots cartesianos son las plataformas robóticas más versátiles que existen. Esta escalabilidad se extiende tanto a su tamaño físico potencial como a su resistencia máxima. Los robots cartesianos pueden ser tan pequeños como miniimpresoras 3D o tan grandes como se desee. Actualmente, hay muchos robots cartesianos enormes disponibles que miden 50 metros (164 pies) o más. Esto se debe a la mecánica. Los actuadores de piñón y cremallera permiten a los fabricantes construir sistemas extremadamente grandes. Su mecánica también es la más potente que encontrará en las plataformas robóticas modernas.
Personalice este informe según sus necesidades
Obtendrá personalización en cualquier informe, sin cargo, incluidas partes de este informe o análisis a nivel de país, paquete de datos de Excel, así como también grandes ofertas y descuentos para empresas emergentes y universidades.
Mercado de robots cartesianos: perspectivas estratégicas
-
Obtenga las principales tendencias clave del mercado de este informe.Esta muestra GRATUITA incluirá análisis de datos, desde tendencias del mercado hasta estimaciones y pronósticos.
Factores impulsores y oportunidades del mercado de robots cartesianos
La creciente automatización y la industria 4.0 favorecerán al mercado
El mundo de la automatización industrial está cambiando drásticamente. Los avances en tecnologías como la inteligencia artificial (IA), la robótica colaborativa y la integración de IoT se encuentran entre los pocos impulsores de este crecimiento. Innumerables fabricantes emplean robots industriales para automatizar trabajos, mejorar la seguridad de los trabajadores y aumentar la producción general, al tiempo que reducen los desechos y los gastos operativos. A medida que los robots industriales se vuelven más comunes en los entornos de fabricación, existe una mayor demanda de varios tipos de robots industriales para adaptarse a ciertas aplicaciones e industrias. Por ejemplo, según un informe de 2024, actualmente hay más de 3,4 millones de robots industriales en el mundo. La proporción global de robots por humano en el negocio industrial es de 1:71. Las empresas industriales tienen la intención de invertir el 25% de su capital en automatización industrial durante los próximos cinco años.
Aplicaciones sanitarias: una oportunidad en la robótica cartesiana
Los robots cartesianos desempeñan un papel importante en la automatización de los procedimientos médicos. En diciembre de 2020, el sistema de angiografía Allia IGS 7 es la última generación del sistema de angiografía impulsado por robot de GE Healthcare para terapia guiada por imágenes. Se dio a conocer durante la reunión virtual de la Sociedad Radiológica de Norteamérica ( RSNA ) de 2020. El sistema no estaba montado en el suelo ni en el techo, sino que funcionaba sobre un pórtico con ruedas, lo que permitía estacionarlo en un lugar apartado para facilitar el acceso al paciente o la conversión a operaciones abiertas. El pórtico robótico estaba guiado por láser para garantizar un posicionamiento preciso en la sala y permitir tecnologías avanzadas de obtención de imágenes y guía disponibles en sistemas de arco en C de base fija. La aplicación de robots cartesianos en aplicaciones médicas tan críticas está creando oportunidades en el mercado.
Análisis de segmentación del informe de mercado de robots cartesianos
Los segmentos clave que contribuyeron a la derivación del análisis del mercado de robots cartesianos son el tipo de eje y la vertical de la industria.
- Según el tipo de eje, el mercado de robots cartesianos se divide en 1 eje, 2 ejes, 3 ejes y 4 ejes. El segmento de 3 ejes tuvo la mayor participación del mercado en 2023.
- Según las verticales de la industria, el mercado de robots cartesianos se divide en fabricación, automotriz, eléctrico y electrónico, alimentos y bebidas, productos químicos y petroquímicos, y otros.
Análisis de la cuota de mercado de robots cartesianos por geografía
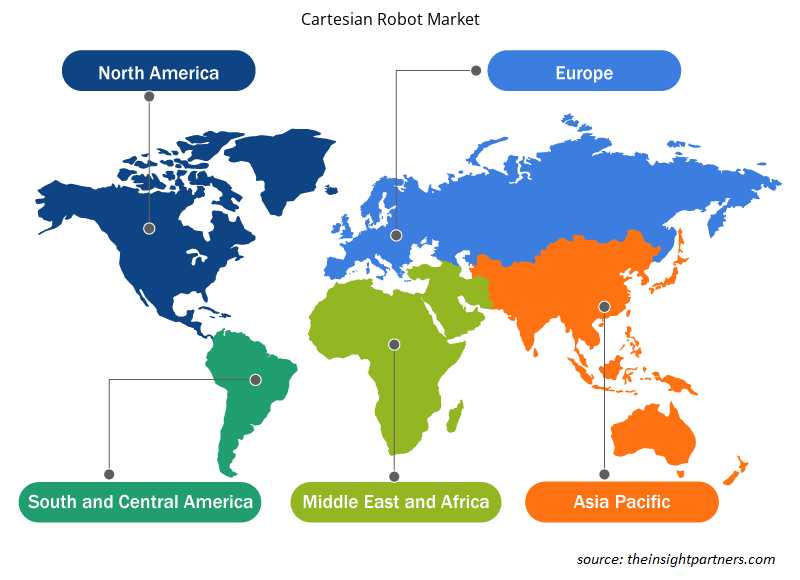
El alcance geográfico del informe de mercado de robots cartesianos se divide principalmente en cinco regiones: América del Norte, Asia Pacífico, Europa, Medio Oriente y África, y América del Sur / América del Sur y Central.
La región de Asia Pacífico ha dominado el mercado de robots cartesianos. La creciente industrialización en países como China, India, Japón y otros de la región de Asia Pacífico está impulsando la demanda de robots cartesianos en la región. El mercado de robots cartesianos está experimentando un desarrollo sustancial en América del Norte, al que se puede atribuir un aumento significativo en algunos sectores industriales, como el automotriz y el manufacturero.cartesian robot market. Rising industrialization in countries like China, India, Japan, and others in Asia Pacific countries are driving the demand for cartesian robots in the region. The Cartesian Robot market is undergoing substantial development in North America, which can be attributed significant rise in some of the industrial sectors such as automotive and manufacturing.
Perspectivas regionales del mercado de robots cartesianos
Los analistas de Insight Partners explicaron en detalle las tendencias y los factores regionales que influyen en el mercado de robots cartesianos durante el período de pronóstico. Esta sección también analiza los segmentos y la geografía del mercado de robots cartesianos en América del Norte, Europa, Asia Pacífico, Oriente Medio y África, y América del Sur y Central.
- Obtenga datos regionales específicos para el mercado de robots cartesianos
Alcance del informe sobre el mercado de robots cartesianos
| Atributo del informe | Detalles |
|---|---|
| Tamaño del mercado en 2023 | US$ 2.91 mil millones |
| Tamaño del mercado en 2031 | 5.090 millones de dólares estadounidenses |
| CAGR global (2023 - 2031) | 7,3% |
| Datos históricos | 2021-2022 |
| Período de pronóstico | 2024-2031 |
| Segmentos cubiertos |
Por tipo de eje
|
| Regiones y países cubiertos |
América del norte
|
| Líderes del mercado y perfiles de empresas clave |
|
Densidad de actores del mercado: comprensión de su impacto en la dinámica empresarial
El mercado de robots cartesianos está creciendo rápidamente, impulsado por la creciente demanda de los usuarios finales debido a factores como la evolución de las preferencias de los consumidores, los avances tecnológicos y una mayor conciencia de los beneficios del producto. A medida que aumenta la demanda, las empresas amplían sus ofertas, innovan para satisfacer las necesidades de los consumidores y aprovechan las tendencias emergentes, lo que impulsa aún más el crecimiento del mercado.
La densidad de actores del mercado se refiere a la distribución de las empresas o firmas que operan dentro de un mercado o industria en particular. Indica cuántos competidores (actores del mercado) están presentes en un espacio de mercado determinado en relación con su tamaño o valor total de mercado.
Las principales empresas que operan en el mercado de robots cartesianos son:
- TEJIDO
- DENSO WAVE INCORPORADO
- Grupo Midea.
- Corporación Seiko Epson.
- Shibaura Machine Co., Ltd.
- Compañía de motores Yamaha, Ltd.
Descargo de responsabilidad : Las empresas enumeradas anteriormente no están clasificadas en ningún orden particular.
- Obtenga una descripción general de los principales actores clave del mercado de robots cartesianos
Noticias y desarrollos recientes del mercado de robots cartesianos
El mercado de robots cartesianos se evalúa mediante la recopilación de datos cualitativos y cuantitativos posteriores a la investigación primaria y secundaria, que incluye publicaciones corporativas importantes, datos de asociaciones y bases de datos. A continuación, se incluye una lista de los desarrollos en el mercado de robots cartesianos y las estrategias:
- KUKA Robotics presentó en la Feria de Hannover 2021 un nuevo sistema operativo para sus brazos robóticos colaborativos e industriales. El nuevo sistema operativo KUKA iiQKA.OS pretende ser "tan sencillo de usar como un teléfono móvil". El objetivo fundamental del nuevo diseño del sistema operativo es que sea lo suficientemente sencillo para que los nuevos operadores puedan utilizarlo sin necesidad de formación especializada. Este es un objetivo importante en el diseño de software, sobre todo en el contexto de la robótica colaborativa. (Fuente: KUKA AG, nota de prensa, 2021)
Cobertura y resultados del informe sobre el mercado de robots cartesianos
El informe “Tamaño y pronóstico del mercado de robots cartesianos (2023-2031)” proporciona un análisis detallado del mercado que cubre las siguientes áreas:
- Tamaño del mercado y pronóstico a nivel global, regional y nacional para todos los segmentos clave del mercado cubiertos bajo el alcance
- Dinámica del mercado, como impulsores, restricciones y oportunidades clave
- Principales tendencias futuras
- Análisis detallado de las cinco fuerzas de Porter y PEST y FODA
- Análisis del mercado global y regional que cubre las tendencias clave del mercado, los principales actores, las regulaciones y los desarrollos recientes del mercado.
- Análisis del panorama de la industria y de la competencia que abarca la concentración del mercado, el análisis de mapas de calor, los actores destacados y los desarrollos recientes
- Perfiles detallados de empresas

Naveen es un experimentado profesional en investigación de mercados y consultoría con más de 9 años de experiencia en proyectos personalizados, sindicados y de consultoría. Actualmente se desempeña como Vicepresidente Asociado, donde ha gestionado con éxito a las partes interesadas en toda la cadena de valor del proyecto y ha redactado más de 100 informes de investigación y más de 30 proyectos de consultoría. Su trabajo abarca proyectos industriales y gubernamentales, contribuyendo significativamente al éxito de los clientes y a la toma de decisiones basada en datos.
Naveen es licenciado en Ingeniería Electrónica y Comunicaciones por la VTU (Karnataka) y tiene un MBA en Marketing y Operaciones por la Universidad de Manipal. Ha sido miembro activo del IEEE durante 9 años, participando en conferencias, simposios técnicos y realizando voluntariado tanto a nivel de sección como regional. Antes de su puesto actual, trabajó como Consultor Estratégico Asociado en IndustryARC y como Consultor de Servidores Industriales en Hewlett Packard (HP Global).
- Análisis histórico (2 años), año base, pronóstico (7 años) con CAGR
- Análisis PEST y FODA
- Tamaño del mercado, valor/volumen: global, regional y nacional
- Industria y panorama competitivo
- Conjunto de datos de Excel
Testimonios
El informe de mercado de sistemas SCADA de Insight Partners es completo y ofrece información valiosa sobre las tendencias actuales y las previsiones futuras. El equipo fue altamente profesional, receptivo y me brindó un gran apoyo en todo momento. Estamos muy satisfechos y recomendamos ampliamente sus servicios.
RAN KEDEM Socio, Reali Technologies LTDsSolicité un informe sobre un mercado de software muy específico y el equipo lo elaboró en pocos días. La información era muy relevante y estaba bien presentada. Posteriormente, solicité algunos cambios y adiciones al informe. El equipo fue muy receptivo y recibí el informe final en menos de una semana.
JEAN-HERVE JENN Presidente, Future AnalyticaTrabajamos con The Insight Partners para un importante estudio y pronóstico de mercado. Nos brindaron una visión clara de las oportunidades y los riesgos, lo que nos ayudó a definir nuestros planes. Su investigación fue fácil de usar y se basó en datos sólidos. Nos ayudó a tomar decisiones inteligentes y seguras. Los recomendamos ampliamente.
PIYUSH NAGPAL Vicepresidente Sénior, , High Beam GlobalThe Insight Partners realizó una investigación de mercado profunda y bien estructurada con una sólida experiencia en el sector. Su equipo fue profesional y receptivo en todo momento. El sitio web, fácil de usar, facilitó el acceso a los informes del sector. Los recomendamos ampliamente por sus servicios de investigación confiables y de alta calidad.
YUKIHIKO ADACHI Director Ejecutivo, , Deep Blue, LLCEsta es la primera vez que compro un informe de mercado de The Insight Partners. Aunque al principio tenía dudas, visité su sitio web y me sentí más cómodo al arriesgarme y comprarlo. Estoy completamente satisfecho con la calidad del informe y el servicio al cliente. Tenía varias preguntas y comentarios sobre el informe inicial, pero después de un par de conversaciones por correo electrónico con su analista, creo que tengo un informe que puedo usar como base para nuestro proceso de planificación estratégica. Muchas gracias por tomarse el tiempo y hacer de esta una experiencia positiva. Sin duda, recomendaré sus servicios y serán mi primera opción cuando necesitemos más datos de mercado.
JOHN SUZUKI Presidente y Director Ejecutivo, Director de la Junta Directiva, BK TechnologiesAgradezco su apoyo y la profesionalidad que demostraron al atender mi solicitud de información sobre el mercado de diagnóstico in vitro (IVD) para enfermedades infecciosas en Nigeria. Agradezco su paciencia, su orientación y su disposición a ofrecerme un descuento, lo que finalmente nos permitió cerrar un trato. Espero poder colaborar con The Insight Partners en el futuro, gracias a la impresión que me causó este primer encuentro.
DRA. CHIJIOKE ONYIA, DIRECTORA GENERAL, PineCrest Healthcare Ltd.Razón para comprar
- Toma de decisiones informada
- Comprensión de la dinámica del mercado
- Análisis competitivo
- Información sobre clientes
- Pronósticos del mercado
- Mitigación de riesgos
- Planificación estratégica
- Justificación de la inversión
- Identificación de mercados emergentes
- Mejora de las estrategias de marketing
- Impulso de la eficiencia operativa
- Alineación con las tendencias regulatorias


Desbloquea descuentos exclusivos en informes
Consultar ahora


 Obtenga una muestra gratuita para - Mercado de robots cartesianos