Panorama y oportunidades del mercado del software de fusión de imágenes multimodales (2026-2034)
Datos históricos : 2021-2022 | Año base : 2023 | Período de pronóstico : 2024-2031Tamaño y pronóstico del mercado de software de fusión de imágenes multimodales (2021-2034), participación global y regional, tendencias y análisis de oportunidades de crecimiento. Cobertura del informe: por tipo (imágenes multimodales preclínicas e imágenes multimodales clínicas), aplicación (hospitales, centros de diagnóstico e institutos académicos y de investigación) y geografía.
- Estado : Datos publicados
- Código de informe : TIPRE00018595
- Categoría : Tecnología, medios y telecomunicaciones
- Número de páginas : 150
- Formatos de informe disponibles :


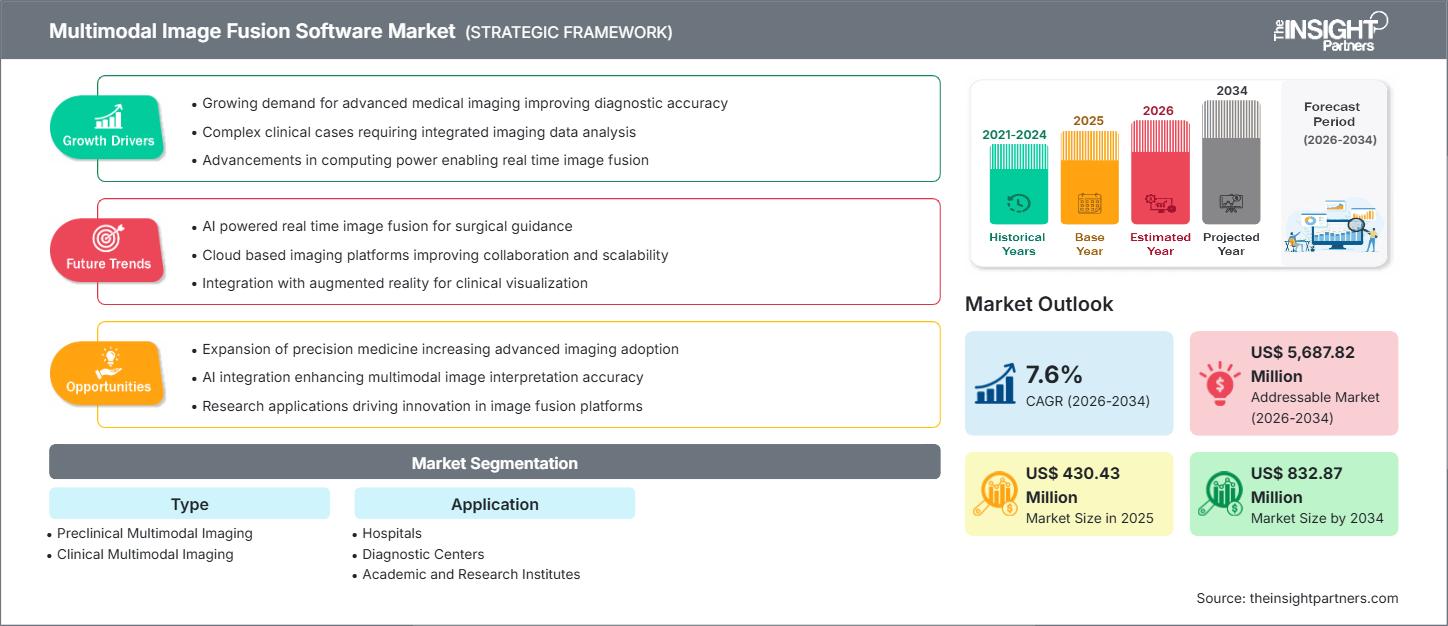
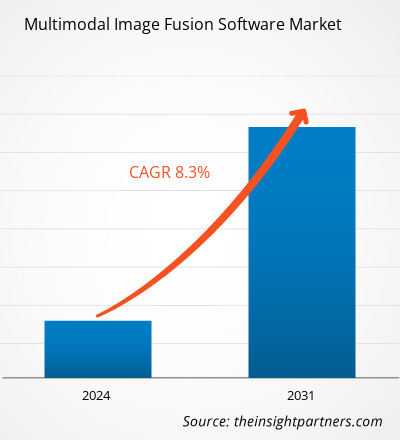
Se espera que el tamaño del mercado de software de fusión de imágenes multimodales alcance los 832,87 millones de dólares en 2034, desde los 430,43 millones de dólares en 2025. Se anticipa que el mercado registre una CAGR del 7,6 % durante el período 2026-2034.
Análisis del mercado de software de fusión de imágenes multimodales
El pronóstico para el mercado de software de fusión de imágenes multimodales muestra una fuerte expansión, impulsada por la creciente demanda de flujos de trabajo de imágenes integrados, el creciente uso de herramientas de diagnóstico basadas en IA y la rápida adopción de sistemas avanzados de imágenes médicas. La creciente utilidad de la fusión de imágenes en aplicaciones de defensa, vigilancia, vehículos autónomos e inteligencia geoespacial también respalda este crecimiento.
La integración de datos de resonancia magnética, tomografía computarizada, tomografía por emisión de positrones (PET), ultrasonido, infrarrojos, imágenes satelitales y LiDAR en plataformas de imágenes unificadas mejora la precisión en la toma de decisiones. Otros factores que contribuyen al crecimiento del mercado incluyen la implementación en la nube, los estándares de interoperabilidad, la fusión automatizada y la financiación gubernamental para la IA en imágenes.
Descripción general del mercado de software de fusión de imágenes multimodales
El software de fusión de imágenes multimodales crea un único resultado con información completa mediante la fusión de datos visuales importantes de múltiples fuentes de imágenes. Se utiliza en prácticamente todos los sectores, desde la salud y la defensa hasta la inspección industrial, la robótica, la monitorización ambiental y el transporte.
Este software mejora la precisión diagnóstica al fusionar conjuntos de datos de modalidades de imagen complementarias, optimizar la detección de objetos, reducir la ambigüedad en escenas de bajo contraste y optimizar el flujo de trabajo. Estos sistemas respaldan a instituciones de investigación, centros clínicos y empresas que buscan una interpretación visual consistente, de alta calidad y de múltiples fuentes.
Personalice este informe según sus necesidades
Obtenga PERSONALIZACIÓN GRATUITAMercado de software de fusión de imágenes multimodales: perspectivas estratégicas
-
Obtenga las principales tendencias clave del mercado de este informe.Esta muestra GRATUITA incluirá análisis de datos, desde tendencias del mercado hasta estimaciones y pronósticos.
Impulsores y oportunidades del mercado del software de fusión de imágenes multimodales
Factores impulsores del mercado:
- Creciente demanda de diagnósticos de precisión en la atención médica: la creciente adopción de flujos de trabajo de fusión PET-CT, PET-MRI y CT-MRI está mejorando el diagnóstico del cáncer, la planificación del tratamiento y la navegación quirúrgica, lo que impulsa el uso de plataformas avanzadas de fusión de imágenes.
- Adopción creciente en defensa, vigilancia y seguridad nacional: la fusión termovisible, la integración radar-óptica y la fusión de datos hiperespectrales se utilizan ampliamente para la vigilancia, la detección de objetivos y el conocimiento de la situación.
- Expansión de aplicaciones de IA/ML en imágenes multimodales: el registro de imágenes basado en aprendizaje automático, la reducción de ruido, la segmentación y los procesos de fusión automatizados mejoran significativamente la confiabilidad de la salida y reducen el error humano.
Oportunidades de mercado:
- Creciente adopción de vehículos autónomos y robótica: la fusión de datos LiDAR, de radar, térmicos y de cámara es esencial para la percepción ambiental en tiempo real, lo que crea oportunidades para motores de fusión especializados en tiempo real.
- Plataformas de fusión basadas en la nube para investigación y uso clínico: las soluciones de fusión nativas de la nube ofrecen computación escalable, lo que permite su adopción entre centros de atención médica y centros de investigación pequeños y medianos.
- Integración con análisis avanzados y sistemas de visualización 3D: la integración de la fusión de imágenes con análisis de IA, reconstrucción 3D, planificación quirúrgica VR/AR y tecnologías gemelas digitales abre nuevas vías para el crecimiento del mercado.
Análisis de segmentación del informe de mercado de software de fusión de imágenes multimodales
Se analiza la cuota de mercado del software de fusión de imágenes multimodales en múltiples segmentos para obtener una visión más profunda de la dinámica de crecimiento y los patrones de adopción emergentes.
Por tipo:
- Imágenes multimodales preclínicas
- Imágenes clínicas multimodales
Por aplicación:
- Hospitales
- Centros de diagnóstico
- Institutos académicos y de investigación
Por geografía:
- América del norte
- Europa
- Asia Pacífico
- América del Sur y Central
- Oriente Medio y África
Perspectivas regionales del mercado de software de fusión de imágenes multimodales
Los analistas de The Insight Partners han explicado detalladamente las tendencias y los factores regionales que influyen en el mercado de software de fusión de imágenes multimodales durante el período de pronóstico. Esta sección también analiza los segmentos y la geografía del mercado de software de fusión de imágenes multimodales en América del Norte, Europa, Asia Pacífico, Oriente Medio y África, y América del Sur y Central.
Alcance del informe de mercado del software de fusión de imágenes multimodales
| Atributo del informe | Detalles |
|---|---|
| Tamaño del mercado en 2025 | US$ 430,43 millones |
| Tamaño del mercado en 2034 | US$ 832,87 millones |
| CAGR global (2026-2034) | 7,6% |
| Datos históricos | 2021-2024 |
| Período de pronóstico | 2026-2034 |
| Segmentos cubiertos |
Por tipo
|
| Regiones y países cubiertos |
América del norte
|
| Líderes del mercado y perfiles de empresas clave |
|
Densidad de actores del mercado de software de fusión de imágenes multimodales: comprensión de su impacto en la dinámica empresarial
El mercado del software de fusión de imágenes multimodales está creciendo rápidamente, impulsado por la creciente demanda de los usuarios finales debido a factores como la evolución de las preferencias de los consumidores, los avances tecnológicos y un mayor conocimiento de los beneficios del producto. A medida que aumenta la demanda, las empresas amplían su oferta, innovan para satisfacer las necesidades de los consumidores y aprovechan las tendencias emergentes, lo que impulsa aún más el crecimiento del mercado.
- Obtenga una descripción general de los principales actores clave del mercado de software de fusión de imágenes multimodales
Análisis de la cuota de mercado del software de fusión de imágenes multimodales por geografía
1. América del Norte
- Cuota de mercado: posee la mayor cuota de mercado debido a la infraestructura de imágenes avanzada y la adopción temprana de herramientas basadas en IA.
-
Factores clave:
- Crecimiento en el diagnóstico de precisión
- Aumento de la inversión en imágenes de defensa
- Adopción de sistemas de vehículos autónomos
- Tendencias: Cambio hacia ecosistemas de imágenes fusionadas basados en la nube y flujos de trabajo de diagnóstico integrados.
2. Europa
- Cuota de mercado: Impulsada por sólidos marcos regulatorios y redes de imágenes clínicas en expansión.
-
Factores clave:
- Programas de imágenes de IA financiados por la UE
- Uso creciente de sistemas multimodales para neurología, oncología y ortopedia
- Adopción de estándares de imágenes como DICOM y cumplimiento del RGPD
- Tendencias: Plataformas de fusión interoperables que respalden el intercambio transfronterizo de datos sanitarios.
3. Asia Pacífico
- Cuota de mercado: Región de más rápido crecimiento debido a la rápida modernización de las instalaciones de atención médica y la automatización industrial.
-
Factores clave:
- Digitalización de la atención sanitaria liderada por el gobierno
- Creciente demanda de robótica y sistemas autónomos
- Aumento del volumen de imágenes en grandes centros de población
- Tendencias: Fusión impulsada por IA para diagnósticos de bajo costo y aplicaciones industriales escalables.
4. América del Sur y Central
- Cuota de mercado: Región emergente con creciente demanda de investigación y diagnóstico por imágenes.
-
Factores clave:
- Inversiones público-privadas en atención sanitaria
- Creciente adopción de soluciones de imágenes satelitales y geoespaciales
- Tendencias: Herramientas de fusión rentables y basadas en la nube para laboratorios y monitoreo remoto.
5. Oriente Medio y África
- Cuota de mercado: Región en desarrollo con potencial creciente debido a las misiones nacionales de salud digital y las inversiones en defensa.
-
Factores clave:
- Ampliación de centros de imágenes
- Crecimiento de la vigilancia basada en IA
- Proyectos geoespaciales y de ciudades inteligentes
- Tendencias: Adopción de software de fusión para redes de atención integradas y soluciones de seguridad.
Densidad de actores del mercado de software de fusión de imágenes multimodales: comprensión de su impacto en la dinámica empresarial
Alta densidad de mercado y competencia
El mercado es competitivo entre proveedores de tecnología de imágenes establecidos y empresas de inteligencia artificial emergentes que ofrecen flujos de trabajo de fusión especializados.
Este entorno competitivo anima a los proveedores a diferenciarse mediante:
- Flujos de trabajo de fusión y registro automatizados habilitados por IA
- Motores de fusión en tiempo real para robótica, defensa y vehículos autónomos
- Plataformas de fusión basadas en la nube y el borde
- Interoperabilidad con sistemas de resonancia magnética, tomografía computarizada, PET, LiDAR, radar y ópticos
Oportunidades y movimientos estratégicos
- Asociación con hospitales, laboratorios de imágenes y universidades para el desarrollo de diagnósticos basados en IA
- Ampliación de la integración con sistemas de imágenes geoespaciales e industriales
- Aprovechar el aprendizaje automático para mejorar la precisión de la fusión, la reducción de ruido y el rendimiento en tiempo real
Las principales empresas que operan en el mercado de software de fusión de imágenes multimodales son:
- Sistemas médicos aycan, LLC
- Brainlab AG
- Corporación de usuarios
- FUJIFILM VisualSonics, Inc.
- INFINITT Norteamérica Inc.
- Mediso Ltd
- PerkinElmer, Inc.
- Carl Zeiss Meditec
- Soluciones MR Ltd.
- SA intrasense
Otras empresas analizadas durante el curso de la investigación:
- MVTec Software GmbH
- Fusionar la atención médica (IBM Watson Health)
- Kitware Inc.
- ESRI
- Hexágono AB
- Visor DICOM RadiAnt
- ImFusion GmbH
- Pix4D
- VoxelCloud IA
- Sistemas de imágenes médicas Mediso
Noticias y desarrollos recientes del mercado de software de fusión de imágenes multimodales
- Siemens Healthineers anunció el lanzamiento de su motor de fusión mejorado con IA de próxima generación, que permite la alineación automatizada de conjuntos de datos PET-CT y PET-MRI con mayor precisión para aplicaciones de oncología y cardiología.
- Thales Group presentó una actualización de fusión de múltiples sensores para vigilancia de defensa, integrando señales infrarrojas, de radar y ópticas dentro de una interfaz de comando-vista unificada, mejorando significativamente el conocimiento de la situación para las operaciones militares.
Informe de mercado sobre software de fusión de imágenes multimodales: cobertura y resultados
El informe "Tamaño y pronóstico del mercado del software de fusión de imágenes multimodales (2021-2034)" ofrece un análisis detallado que abarca:
- Tamaño y pronóstico del mercado de software de fusión de imágenes multimodales (global, regional y nacional)
- Dinámica del mercado: incluidos impulsores, restricciones y oportunidades
- Análisis PEST y FODA detallado
- Análisis de tendencias tecnológicas clave, entorno regulatorio y desarrollos
- Panorama de la industria, análisis de concentración, mapeo de la competencia e innovaciones recientes
- Perfiles detallados de empresas

Ankita es una profesional dinámica en investigación de mercados y consultoría con más de 8 años de experiencia en los sectores de tecnología, medios de comunicación, TIC, electrónica y semiconductores. Ha liderado y ejecutado con éxito más de 100 proyectos de consultoría e investigación para clientes globales como Microsoft, Oracle, NEC Corporation, SAP, KPMG y Expeditors International. Sus principales competencias incluyen la evaluación de mercado, el análisis de datos, la previsión, la formulación de estrategias, la inteligencia competitiva y la redacción de informes.
Ankita es experta en la gestión de ciclos completos de proyecto, desde el diseño de propuestas de preventa y las conversaciones con los clientes hasta la entrega de información práctica posventa. Es experta en la gestión de equipos multifuncionales, la estructuración de módulos de investigación complejos y la alineación de soluciones con los objetivos de negocio específicos del cliente. Sus excelentes habilidades de comunicación, liderazgo y presentación le han permitido obtener constantemente resultados orientados al valor en entornos de mercado dinámicos y en constante evolución.
- Análisis histórico (2 años), año base, pronóstico (7 años) con CAGR
- Análisis PEST y FODA
- Tamaño del mercado, valor/volumen: global, regional y nacional
- Industria y panorama competitivo
- Conjunto de datos de Excel
Testimonios
El informe de mercado de sistemas SCADA de Insight Partners es completo y ofrece información valiosa sobre las tendencias actuales y las previsiones futuras. El equipo fue altamente profesional, receptivo y me brindó un gran apoyo en todo momento. Estamos muy satisfechos y recomendamos ampliamente sus servicios.
RAN KEDEM Socio, Reali Technologies LTDsSolicité un informe sobre un mercado de software muy específico y el equipo lo elaboró en pocos días. La información era muy relevante y estaba bien presentada. Posteriormente, solicité algunos cambios y adiciones al informe. El equipo fue muy receptivo y recibí el informe final en menos de una semana.
JEAN-HERVE JENN Presidente, Future AnalyticaTrabajamos con The Insight Partners para un importante estudio y pronóstico de mercado. Nos brindaron una visión clara de las oportunidades y los riesgos, lo que nos ayudó a definir nuestros planes. Su investigación fue fácil de usar y se basó en datos sólidos. Nos ayudó a tomar decisiones inteligentes y seguras. Los recomendamos ampliamente.
PIYUSH NAGPAL Vicepresidente Sénior, , High Beam GlobalThe Insight Partners realizó una investigación de mercado profunda y bien estructurada con una sólida experiencia en el sector. Su equipo fue profesional y receptivo en todo momento. El sitio web, fácil de usar, facilitó el acceso a los informes del sector. Los recomendamos ampliamente por sus servicios de investigación confiables y de alta calidad.
YUKIHIKO ADACHI Director Ejecutivo, , Deep Blue, LLCEsta es la primera vez que compro un informe de mercado de The Insight Partners. Aunque al principio tenía dudas, visité su sitio web y me sentí más cómodo al arriesgarme y comprarlo. Estoy completamente satisfecho con la calidad del informe y el servicio al cliente. Tenía varias preguntas y comentarios sobre el informe inicial, pero después de un par de conversaciones por correo electrónico con su analista, creo que tengo un informe que puedo usar como base para nuestro proceso de planificación estratégica. Muchas gracias por tomarse el tiempo y hacer de esta una experiencia positiva. Sin duda, recomendaré sus servicios y serán mi primera opción cuando necesitemos más datos de mercado.
JOHN SUZUKI Presidente y Director Ejecutivo, Director de la Junta Directiva, BK TechnologiesAgradezco su apoyo y la profesionalidad que demostraron al atender mi solicitud de información sobre el mercado de diagnóstico in vitro (IVD) para enfermedades infecciosas en Nigeria. Agradezco su paciencia, su orientación y su disposición a ofrecerme un descuento, lo que finalmente nos permitió cerrar un trato. Espero poder colaborar con The Insight Partners en el futuro, gracias a la impresión que me causó este primer encuentro.
DRA. CHIJIOKE ONYIA, DIRECTORA GENERAL, PineCrest Healthcare Ltd.Razón para comprar
- Toma de decisiones informada
- Comprensión de la dinámica del mercado
- Análisis competitivo
- Información sobre clientes
- Pronósticos del mercado
- Mitigación de riesgos
- Planificación estratégica
- Justificación de la inversión
- Identificación de mercados emergentes
- Mejora de las estrategias de marketing
- Impulso de la eficiencia operativa
- Alineación con las tendencias regulatorias


Desbloquea descuentos exclusivos en informes
Consultar ahora


 Obtenga una muestra gratuita para - Mercado de software de fusión de imágenes multimodales