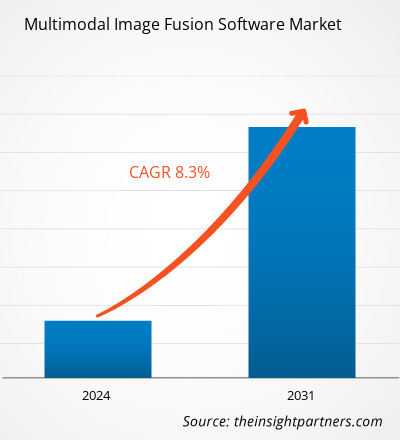
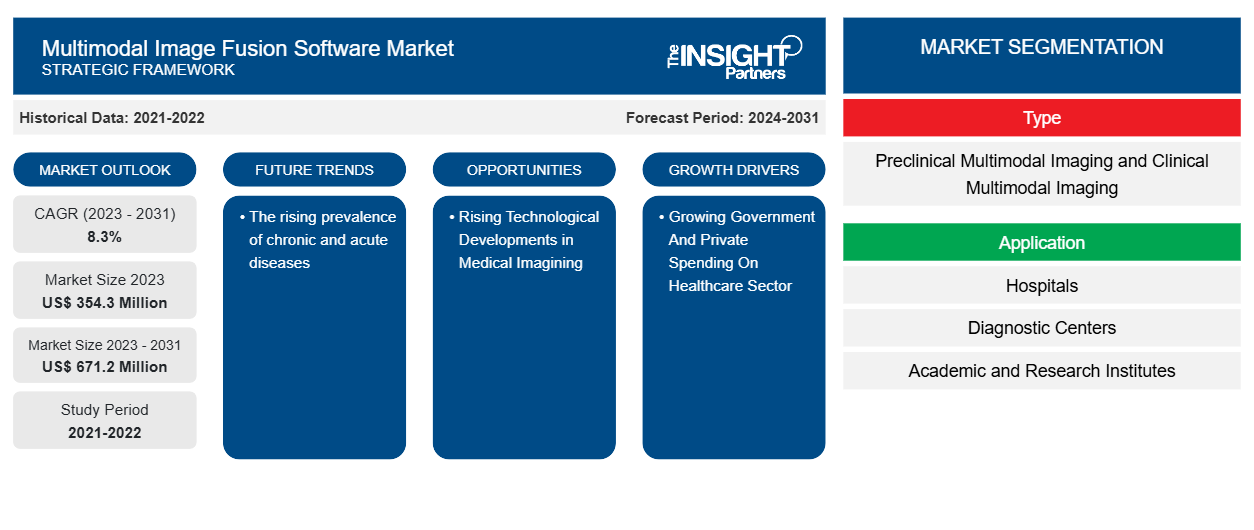
Der Markt für multimodale Bildfusionssoftware soll von 354,3 Millionen US-Dollar im Jahr 2023 auf 671,2 Millionen US-Dollar im Jahr 2031 anwachsen. Der Markt wird zwischen 2023 und 2031 voraussichtlich eine durchschnittliche jährliche Wachstumsrate (CAGR) von 8,3 % verzeichnen. Die zunehmende Verbreitung chronischer und akuter Krankheiten dürfte ein wichtiger Trend auf dem Markt bleiben.
Marktanalyse für multimodale Bildfusionssoftware
Software zur multimodalen Bildfusion kann durch die Fusion zahlreicher Merkmale von Bilddaten eine vollständigere und genauere Ansicht der Szene erzeugen, was die Entscheidungsfindung erleichtert und die Leistung des gesamten Systems verbessert. Darüber hinaus können multimodale Bilddaten die Entscheidungsfindung und die Systemleistung unterstützen. Der Bedarf an multimodaler Bildfusionstechnologie steigt aufgrund ihres breiten Anwendungsspektrums kontinuierlich an. In der medizinischen Bildgebung kann die multimodale Bildfusion beispielsweise dazu beitragen, die Diagnose und Behandlungsplanung zu verbessern, indem Informationen aus verschiedenen Bildgebungsmodalitäten zusammengeführt werden.
Marktübersicht für multimodale Bildfusionssoftware
Multimodale Bildfusionssoftware versucht, wichtige Informationen aus Bildern, die von mehreren Sensoren erfasst wurden, in einem einzigen Bild zu kombinieren. Die fusionierten Bilder sollen alle wichtigen Informationen der Originalfotos enthalten und gleichzeitig keine Verzerrungen oder Artefakte aufweisen. Multimodale Bildfusionssoftware wird voraussichtlich in mehreren Anwendungen eine wichtige Rolle spielen, darunter autonomes Fahren, Überwachungssysteme und Robotik. Durch die Integration von Daten aus vielen Quellen können diese Systeme in komplexen und dynamischen Kontexten arbeiten und so Effizienz, Zuverlässigkeit und Sicherheit steigern.
Passen Sie diesen Bericht Ihren Anforderungen an
Sie erhalten kostenlose Anpassungen an jedem Bericht, einschließlich Teilen dieses Berichts oder einer Analyse auf Länderebene, eines Excel-Datenpakets sowie tolle Angebote und Rabatte für Start-ups und Universitäten.
-
Holen Sie sich die wichtigsten Markttrends aus diesem Bericht.Dieses KOSTENLOSE Beispiel umfasst eine Datenanalyse von Markttrends bis hin zu Schätzungen und Prognosen.
Markttreiber und Chancen für multimodale Bildfusionssoftware
Steigende staatliche und private Ausgaben im Gesundheitssektor begünstigen den Markt
Die staatlichen und privaten Ausgaben für den Gesundheitssektor steigen als Reaktion auf eine bessere öffentliche Gesundheit kontinuierlich an. So stiegen beispielsweise laut den US Centers for Medicare & Medicaid Services die nationalen Gesundheitsausgaben (NHE) im Jahr 2022 um 4,1 % auf 4,5 Billionen US-Dollar oder 13.493 US-Dollar pro Person. Sie machten 17,3 % des Bruttoinlandsprodukts (BIP) aus. Die Medicare-Ausgaben stiegen im Jahr 2022 um 5,9 % auf 944,3 Milliarden US-Dollar oder 21 % der gesamten NHE. 2021. Darüber hinaus wurden die größten Anteile der gesamten Gesundheitsausgaben in den USA von der Bundesregierung (33 %) und den Haushalten (28 %) getragen. Der Anteil der privaten Unternehmen an den Gesundheitsausgaben betrug 18 % der gesamten Gesundheitsausgaben, 15 % entfielen auf staatliche und lokale Regierungen und 7 % auf sonstige private Einnahmen. Die multimodale Bildfusion spielt in der Medizinbranche eine entscheidende Rolle. Sie ist ausschließlich für die medizinische Bildgebung konzipiert. Diese Strategie zielt darauf ab, die medizinische Bildgebung für die Untersuchung und Beurteilung von Gesundheitszuständen klinisch relevanter zu machen, indem unnötige Arbeit reduziert und die Qualität verbessert wird. Sie ermöglicht eine genauere Diagnose und rationalisiert den Diagnoseprozess. Bei der medizinischen Bildfusion (MIF) hilft ein intuitionistisches Fuzzy-Set (IFS), die Bildqualität zu verbessern, was für die medizinische Diagnose nützlich ist. Somit treiben die wachsenden staatlichen und privaten Ausgaben für den Gesundheitssektor das Wachstum des Marktes voran.
Zunehmende technologische Entwicklungen in der medizinischen Bildgebung
Medizinische Bildgebungstechnologien entwickeln sich ständig weiter, was zu neuen Anwendungen für die Diagnose und Behandlung von Krankheiten führt. Neue medizinische Bildgebungstechnologien versprechen eine direkte Verbesserung der Patientenergebnisse. Innovative medizinische Bildgebungstechnologien versprechen eine Verbesserung der Patientenergebnisse auf vielfältige Weise. Beispielsweise können mobile Bildgebungsgeräte ältere Patienten überwachen und diagnostizieren, ohne dass eine persönliche Arztsitzung erforderlich ist . Tragbare medizinische Geräte, die Bildgebungskomponenten enthalten, machen es Patienten einfacher und bequemer, wichtige Fakten zu melden, weshalb medizinische Forscher künstliche Intelligenz (KI), virtuelle Realität (VR), tragbare Computer und andere technologische Fortschritte nutzen, um die Gesundheitsversorgung zu verbessern. Computer können reale Umstände auf eine Weise nachahmen, die es Menschen ermöglicht, neue Ideen und Ansichten zu gewinnen, die über ihre Sinneswahrnehmung hinausgehen. Darüber hinaus kann die multimodale Bildfusion bei der Erkennung und Behandlung komplexer Erkrankungen helfen, indem sie Informationen aus mehreren Bildgebungsverfahren wie Computertomographie (CT) und Magnetresonanztomographie (MRT) zusammenführt.
Marktbericht zur multimodalen Bildfusionssoftware – Segmentierungsanalyse
Wichtige Segmente, die zur Ableitung der Marktanalyse für multimodale Bildfusionssoftware beigetragen haben, sind Typ und Anwendung.
- Basierend auf dem Typ ist der Markt für multimodale Bildfusionssoftware in präklinische multimodale Bildgebung und klinische multimodale Bildgebung segmentiert.
- Hinsichtlich der Anwendung ist der Markt in Krankenhäuser, Diagnosezentren sowie akademische und Forschungsinstitute segmentiert.
Marktanteilsanalyse für multimodale Bildfusionssoftware nach geografischer Lage
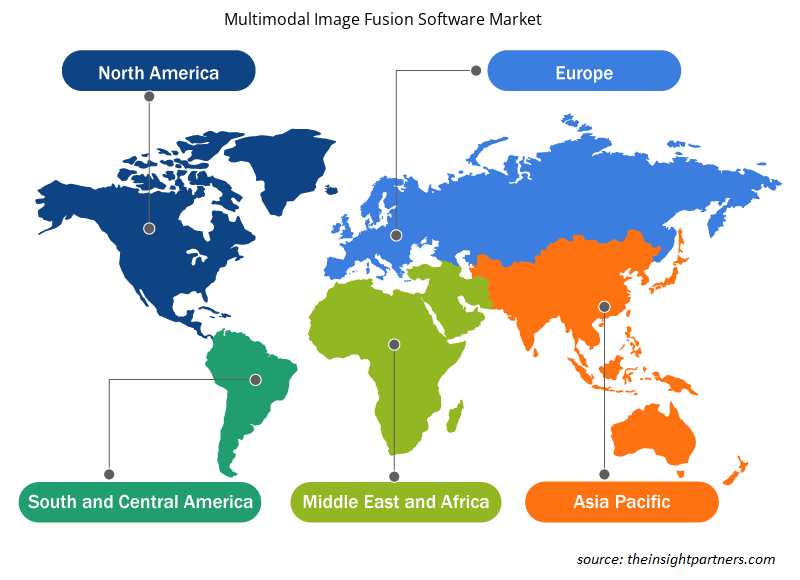
Der geografische Umfang des Marktberichts für multimodale Bildfusionssoftware ist hauptsächlich in fünf Regionen unterteilt: Nordamerika, Asien-Pazifik, Europa, Naher Osten und Afrika sowie Süd- und Mittelamerika. Da Krankenhäuser und Gesundheitsdienstleister in ganz Nordamerika daran arbeiten, ihre Verfahren zu digitalisieren, wächst die Nachfrage nach qualifizierten Unternehmen für die Entwicklung von Gesundheitssoftware. Dieser Beitrag enthält eine Liste namhafter Unternehmen für die Entwicklung von Gesundheitssoftware, die bereit sind, einen transformativen Wandel herbeizuführen. Die nordamerikanische Region dominiert die Softwareeinführung im Gesundheitswesen und anderen Bereichen aufgrund ihrer hohen Einführungsrate innovativer medizinischer Softwarelösungen und einer großen Patientenpopulation, was ihre Dominanz während des Prognosezeitraums sichert. Solche Fälle schaffen lukrative Möglichkeiten für das Wachstum des Marktes.
Regionale Einblicke in den Markt für multimodale Bildfusionssoftware
Die regionalen Trends und Faktoren, die den Markt für multimodale Bildfusionssoftware während des gesamten Prognosezeitraums beeinflussen, wurden von den Analysten von Insight Partners ausführlich erläutert. In diesem Abschnitt werden auch Marktsegmente und Geografie für multimodale Bildfusionssoftware in Nordamerika, Europa, im asiatisch-pazifischen Raum, im Nahen Osten und Afrika sowie in Süd- und Mittelamerika erörtert.

- Erhalten Sie regionale Daten zum Markt für multimodale Bildfusionssoftware
Umfang des Marktberichts zur multimodalen Bildfusionssoftware
| Berichtsattribut | Details |
|---|---|
| Marktgröße im Jahr 2023 | 354,3 Millionen US-Dollar |
| Marktgröße bis 2031 | 671,2 Millionen US-Dollar |
| Globale CAGR (2023 - 2031) | 8,3 % |
| Historische Daten | 2021-2022 |
| Prognosezeitraum | 2024–2031 |
| Abgedeckte Segmente |
Nach Typ
|
| Abgedeckte Regionen und Länder |
Nordamerika
|
| Marktführer und wichtige Unternehmensprofile |
|
Marktteilnehmerdichte für multimodale Bildfusionssoftware: Auswirkungen auf die Geschäftsdynamik verstehen
Der Markt für multimodale Bildfusionssoftware wächst rasant, angetrieben durch die steigende Nachfrage der Endnutzer aufgrund von Faktoren wie sich entwickelnden Verbraucherpräferenzen, technologischen Fortschritten und einem größeren Bewusstsein für die Vorteile des Produkts. Mit steigender Nachfrage erweitern Unternehmen ihr Angebot, entwickeln Innovationen, um die Bedürfnisse der Verbraucher zu erfüllen, und nutzen neue Trends, was das Marktwachstum weiter ankurbelt.
Die Marktteilnehmerdichte bezieht sich auf die Verteilung der Firmen oder Unternehmen, die in einem bestimmten Markt oder einer bestimmten Branche tätig sind. Sie gibt an, wie viele Wettbewerber (Marktteilnehmer) in einem bestimmten Marktraum im Verhältnis zu seiner Größe oder seinem gesamten Marktwert präsent sind.
Die wichtigsten Unternehmen auf dem Markt für multimodale Bildfusionssoftware sind:
- aycan Medical Systems, LLC
- Brainlab AG
- Bruker Corporation
- FUJIFILM VisualSonics, Inc.
- INFINITT North America Inc.
- Mediso GmbH
Haftungsausschluss : Die oben aufgeführten Unternehmen sind nicht in einer bestimmten Reihenfolge aufgeführt.

- Überblick über die wichtigsten Akteure auf dem Markt für multimodale Bildfusionssoftware
Marktnachrichten und aktuelle Entwicklungen zur multimodalen Bildfusionssoftware
Der Markt für multimodale Bildfusionssoftware wird durch die Erfassung qualitativer und quantitativer Daten nach Primär- und Sekundärforschung bewertet, die wichtige Unternehmensveröffentlichungen, Verbandsdaten und Datenbanken umfasst. Nachfolgend sind einige der Entwicklungen auf dem Markt für multimodale Bildfusionssoftware aufgeführt:
- Intrasense SA hat eine neue Version von Myrian 2.9 veröffentlicht. Die neue Version der medizinischen Bildgebungssoftware konzentrierte sich stärker auf neue klinische Funktionen. (Quelle: Intrasense SA, April 2021)
- Bruker Corporation (Nasdaq: BRKR) hat die Einführung eines neuartigen, leistungsstarken MALDI-TOF/TOF-Systems angekündigt, des neofleX Imaging Profiler für die massenspektrometriebasierte Gewebebildgebung. Es ermöglicht eine einfache OME-TIFF-Dateiausgabe über die neue SCiLS Scope-Software. Das transformative neofleX MALDI-TOF/TOF MSI-System passt jetzt bequem auf eine Werkbank. (Quelle: Bruker Corporation, Juni 2024)
Marktbericht zur multimodalen Bildfusionssoftware – Abdeckung und Ergebnisse
Der Bericht „Marktgröße und Prognose für multimodale Bildfusionssoftware (2021–2031)“ bietet eine detaillierte Analyse des Marktes, die die folgenden Bereiche abdeckt:
- Marktgröße und Prognose für multimodale Bildfusionssoftware auf globaler, regionaler und Länderebene für alle wichtigen Marktsegmente, die im Rahmen des Projekts abgedeckt sind
- Markttrends für multimodale Bildfusionssoftware sowie Marktdynamik wie Treiber, Einschränkungen und wichtige Chancen
- Detaillierte PEST/Porters Five Forces- und SWOT-Analyse
- Marktanalyse für multimodale Bildfusionssoftware mit Blick auf wichtige Markttrends, globale und regionale Rahmenbedingungen, wichtige Akteure, Vorschriften und aktuelle Marktentwicklungen
- Branchenlandschaft und Wettbewerbsanalyse, die die Marktkonzentration, Heatmap-Analyse, prominente Akteure und aktuelle Entwicklungen für den Markt für multimodale Bildfusionssoftware umfasst
- Detaillierte Firmenprofile.
- Historische Analyse (2 Jahre), Basisjahr, Prognose (7 Jahre) mit CAGR
- PEST- und SWOT-Analyse
- Marktgröße Wert/Volumen – Global, Regional, Land
- Branchen- und Wettbewerbslandschaft
- Excel-Datensatz
Aktuelle Berichte
Verwandte Berichte
Erfahrungsberichte
Grund zum Kauf
- Fundierte Entscheidungsfindung
- Marktdynamik verstehen
- Wettbewerbsanalyse
- Kundeneinblicke
- Marktprognosen
- Risikominimierung
- Strategische Planung
- Investitionsbegründung
- Identifizierung neuer Märkte
- Verbesserung von Marketingstrategien
- Steigerung der Betriebseffizienz
- Anpassung an regulatorische Trends


 Kostenlose Probe anfordern für - Markt für multimodale Bildfusionssoftware