Mercado de sistemas de tuberías virtuales: mapeo competitivo y perspectivas estratégicas para 2031
Datos históricos : 2021-2022 | Año base : 2023 | Período de pronóstico : 2024-2031Tamaño y pronóstico del mercado de sistemas de tuberías virtuales (2021-2031), participación global y regional, tendencias y análisis de oportunidades de crecimiento. Cobertura del informe: por tipo (remolque estándar y remolcable), gas (GNC, hidrógeno y otros), presión nominal (menos de 3000 psi, de 3001 a 5000 psi y más de 5000 psi), aplicación (industrial, transporte, comercial y residencial) y geografía.
- Estado : Datos publicados
- Código de informe : TIPRE00011605
- Categoría : Energía y potencia
- Número de páginas : 150
- Formatos de informe disponibles :


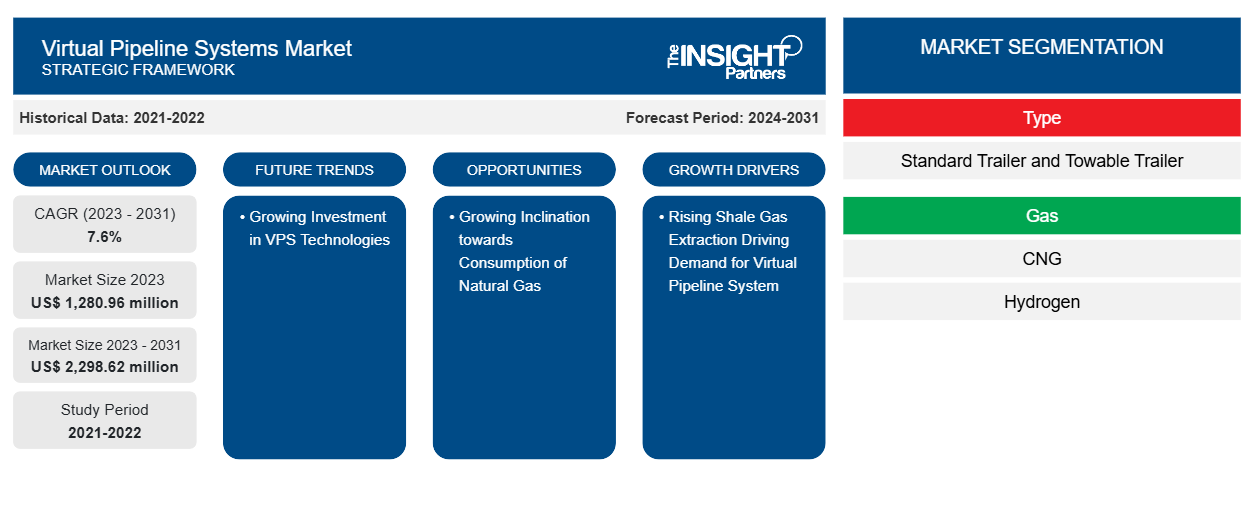
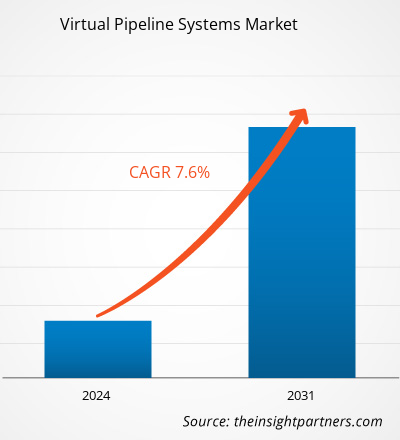
Se proyecta que el tamaño del mercado de sistemas de tuberías virtuales alcance los 2298,62 millones de dólares estadounidenses en 2031, frente a los 1280,96 millones de dólares estadounidenses en 2023. Se espera que el mercado registre una CAGR del 7,6 % entre 2023 y 2031. Es probable que la inversión en infraestructura de tuberías virtuales, que está aumentando significativamente, siga siendo una tendencia clave en el mercado de sistemas de tuberías virtuales.
Análisis del mercado de sistemas de tuberías virtuales
Los principales usuarios finales del mercado de sistemas de tuberías virtuales incluyen aplicaciones industriales, petroquímicas, petroleras y gasísticas y otras. El creciente uso del gas natural como combustible fósil más limpio y sostenible para la industria y los hogares implica que el suministro de gas natural licuado a nivel mundial es una tendencia beneficiosa. Las compañías navieras, petroleras y gasísticas y petroquímicas están optando estratégicamente por diversificarse en flotas de gas natural para aprovechar esta tendencia. Por lo tanto, las industrias de usuarios finales están adoptando cada vez más sistemas de tuberías virtuales, lo que está aprovechando aún más la dinámica del mercado durante los años previstos.
Descripción general del mercado de sistemas de tuberías virtuales
El gasoducto virtual permite la transmisión de gas natural renovable capturado o biogás desde los sitios agrícolas hasta los usuarios finales. Por lo tanto, se espera que un mayor enfoque en lograr cero emisiones netas y un énfasis en la energía verde y la gestión de la energía renovable impulsen el crecimiento del mercado durante el período de pronóstico. Las iniciativas gubernamentales alentadoras para fortalecer la demanda de suministro de gas natural en áreas industriales y comerciales están aumentando el crecimiento del mercado. En los EE. UU., se prevé que la creciente financiación gubernamental a la industria del petróleo y el gas con el aumento de las actividades de producción y exploración tenga un impacto positivo en el crecimiento del mercado.
Personalice este informe según sus necesidades
Obtendrá personalización en cualquier informe, sin cargo, incluidas partes de este informe o análisis a nivel de país, paquete de datos de Excel, así como también grandes ofertas y descuentos para empresas emergentes y universidades.
Mercado de sistemas de tuberías virtuales: perspectivas estratégicas
-
Obtenga las principales tendencias clave del mercado de este informe.Esta muestra GRATUITA incluirá análisis de datos, desde tendencias del mercado hasta estimaciones y pronósticos.
Impulsores y oportunidades del mercado de sistemas de tuberías virtuales
La creciente extracción de gas de esquisto impulsa la demanda de un sistema de gasoductos virtuales
Los constantes avances en los procedimientos de perforación de esquisto han convertido a este gas en uno de los recursos energéticos más importantes. El gas de esquisto puede explotarse como una alternativa energética más limpia en países que dependen del carbón como fuente de energía, ya que emite menos carbono que este. La producción de gas de esquisto ha garantizado un suministro abundante de gas natural en todo el mundo. El aumento de los proyectos de exploración y extracción de gas de esquisto debido a los avances en las tecnologías relacionadas, junto con la disponibilidad de un gran número de reservas, está aumentando la demanda de sistemas de gasoductos virtuales, lo que aumenta el desarrollo del mercado.shales one of the consistent energy resource. Shale gas can be exploited as a cleaner energy alternatives in countries that are dependent on coal as an energy source, as it emits less carbon than coal. Shale gas production has ensued the plenty of natural gas supply worldwide. The increase in shell gas exploration and extraction projects due to developments in related technologies, coupled with the availability of a large number of reserves, is enhancing the demand for virtual pipeline systems, thereby increasing market development.
Demanda creciente de gas natural: una oportunidad en el mercado de sistemas de gasoductos virtuales
Se prevé que el aumento de la atención y las inversiones en investigación y desarrollo de gas natural por parte de los operadores de petróleo, gas y energía ofrecerán perspectivas de crecimiento sustanciales para el desarrollo futuro de las empresas en el mercado de sistemas de gasoductos virtuales. Estas actividades de I+D están impulsadas principalmente por su objetivo de promover el uso de productos de gas natural de bajas emisiones . El envejecimiento de la infraestructura de los gasoductos ha sido una preocupación clave para los gobiernos de todo el mundo. Como resultado, se están esforzando por encontrar alternativas a los métodos estándar de transporte de petróleo y gas. Por lo tanto, se prevé que las estrictas regulaciones gubernamentales para garantizar la protección ambiental contra las emisiones de carbono y los derrames de petróleo creen oportunidades lucrativas para los vendedores del mercado de gasoductos virtuales.
Análisis de segmentación del informe de mercado de sistemas de tuberías virtuales
Los segmentos clave que contribuyeron a la derivación del análisis del mercado de sistemas de tuberías virtuales son el tipo, el gas, la clasificación de presión y la aplicación.
- Según el tipo, el mercado de sistemas de tuberías virtuales se ha dividido en remolque estándar y remolque remolcable. El segmento de remolque estándar tuvo una mayor participación de mercado en 2023.
- En cuanto al gas, el mercado se ha segmentado en GNC, hidrógeno y otros. El segmento de GNC dominó el mercado en 2023.
- En términos de clasificación de presión, el mercado se ha segmentado en menos de 3000 Psi, de 3001 a 5000 Psi y más de 5000 Psi. El segmento de 3001 a 5000 Psi dominó el mercado en 2023.
- En términos de aplicación, el mercado se ha segmentado en industrial, transporte, comercial y residencial. El segmento de transporte dominó el mercado en 2023.
Análisis de la cuota de mercado de los sistemas de tuberías virtuales por geografía
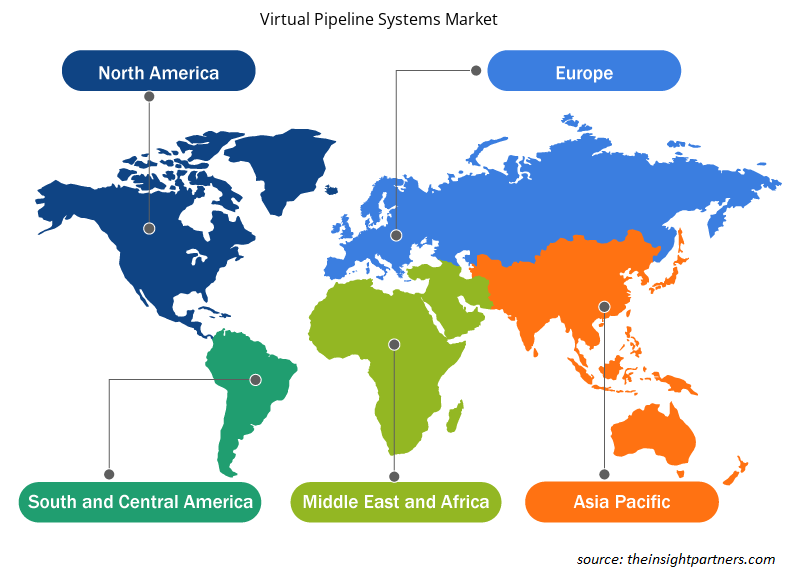
El alcance geográfico del informe de mercado de sistemas de tuberías virtuales se divide principalmente en cinco regiones: América del Norte, Asia Pacífico, Europa, Medio Oriente y África, y América del Sur/América del Sur y Central.
América del Norte lideró el mercado de sistemas de gasoductos virtuales. Estados Unidos, Canadá y México se encuentran entre las principales economías de América del Norte. El crecimiento del mercado de sistemas de gasoductos virtuales en América del Norte se atribuye principalmente al creciente comercio de GNL, al continuo desarrollo de la infraestructura de gas natural y al aumento de las capacidades de generación de energía impulsada por gas. Los nuevos proyectos y la importante producción de gas de esquisto en la Cuenca Pérmica mejorarán el desarrollo general de la región. Las principales empresas de sistemas de gasoductos virtuales que trabajan en América del Norte son Certarus Ltd., Throttle Energy Inc. Technology, Clean Fuel Connection Inc., Compass Natural Gas, NG Advantage, CNG Delivery, TX Energy Drilling Corporation y Corban Energy Group. Muchas empresas se han sentido atraídas por el fuerte potencial de producción que posee América del Norte, lo que ha llevado a un gasto significativo en la construcción de infraestructura de gasoductos de gas natural, lo que está impulsando el crecimiento del mercado de sistemas de gasoductos virtuales en América del Norte.
Perspectivas regionales del mercado de sistemas de tuberías virtuales
Los analistas de Insight Partners explicaron en detalle las tendencias y los factores regionales que influyen en el mercado de sistemas de tuberías virtuales durante el período de pronóstico. Esta sección también analiza los segmentos y la geografía del mercado de sistemas de tuberías virtuales en América del Norte, Europa, Asia Pacífico, Oriente Medio y África, y América del Sur y Central.
- Obtenga datos regionales específicos para el mercado de sistemas de tuberías virtuales
Alcance del informe de mercado de sistemas de tuberías virtuales
| Atributo del informe | Detalles |
|---|---|
| Tamaño del mercado en 2023 | US$ 1.280,96 millones |
| Tamaño del mercado en 2031 | US$ 2.298,62 millones |
| CAGR global (2023 - 2031) | 7,6% |
| Datos históricos | 2021-2022 |
| Período de pronóstico | 2024-2031 |
| Segmentos cubiertos |
Por tipo
|
| Regiones y países cubiertos |
América del norte
|
| Líderes del mercado y perfiles de empresas clave |
|
Densidad de actores del mercado: comprensión de su impacto en la dinámica empresarial
El mercado de sistemas de tuberías virtuales está creciendo rápidamente, impulsado por la creciente demanda de los usuarios finales debido a factores como la evolución de las preferencias de los consumidores, los avances tecnológicos y una mayor conciencia de los beneficios del producto. A medida que aumenta la demanda, las empresas amplían sus ofertas, innovan para satisfacer las necesidades de los consumidores y aprovechan las tendencias emergentes, lo que impulsa aún más el crecimiento del mercado.
La densidad de actores del mercado se refiere a la distribución de las empresas o firmas que operan dentro de un mercado o industria en particular. Indica cuántos competidores (actores del mercado) están presentes en un espacio de mercado determinado en relación con su tamaño o valor total de mercado.
Las principales empresas que operan en el mercado de sistemas de tuberías virtuales son:
- Fabricante: Bayotech, Inc.
- Servicios de GNC Ltd.
- Petroliam Nacional Berhad (PETRONAS)
- RAG Austria AG
- Sistemas de combustible cuántico LLC
- Tecnologías Galileo SA
Descargo de responsabilidad : Las empresas enumeradas anteriormente no están clasificadas en ningún orden particular.
- Obtenga una descripción general de los principales actores clave del mercado de sistemas de tuberías virtuales
Noticias y desarrollos recientes del mercado de sistemas de tuberías virtuales
El mercado de sistemas de tuberías virtuales se evalúa mediante la recopilación de datos cualitativos y cuantitativos posteriores a la investigación primaria y secundaria, que incluye publicaciones corporativas importantes, datos de asociaciones y bases de datos. A continuación, se incluye una lista de los avances en el mercado en materia de innovaciones, expansión comercial y estrategias:
- En enero de 2022, PETRONAS entregó 1.000 toneladas de gas natural licuado (GNL) utilizando su sistema de gasoducto virtual y la tecnología 40 VPS y 41. La creativa solución de PETRONAS, que comenzó a funcionar en 2020, ha proporcionado a los consumidores fuera de la red más de 16 millones de kg de energía baja en carbono utilizando vehículos equipados con tanques criogénicos. (Fuente: PETRONAS, comunicado de prensa/sitio web de la empresa/boletín informativo)
- En mayo de 2022, Chart Industries, Inc. adquirió CSC Cryogenic Service Center AB para fortalecer su presencia en la región nórdica. (Fuente: Chart Industries, Inc., comunicado de prensa/sitio web de la empresa/boletín informativo)
Informe de mercado sobre sistemas de tuberías virtuales: cobertura y resultados
El informe “Tamaño y pronóstico del mercado de sistemas de tuberías virtuales (2021-2031)” proporciona un análisis detallado del mercado que cubre las siguientes áreas:
- Tamaño del mercado de sistemas de tuberías virtuales y pronóstico a nivel global, regional y nacional para todos los segmentos clave del mercado cubiertos bajo el alcance
- Dinámica del mercado, como impulsores, restricciones y oportunidades clave
- Tendencias del mercado de sistemas de tuberías virtuales
- Análisis PEST y FODA detallados
- Análisis del mercado de sistemas de tuberías virtuales que cubre las tendencias clave del mercado, el marco global y regional, los principales actores, las regulaciones y los desarrollos recientes del mercado
- Mercado de sistemas de tuberías virtualesAnálisis de la industria, el panorama y la competencia, que abarca la concentración del mercado, el análisis de mapas de calor, los actores destacados y los desarrollos recientes
- Perfiles detallados de empresas

Nivedita es una investigadora con más de 9 años de experiencia en Investigación de Mercados y Consultoría de Negocios. Actualmente se desempeña como Gerente de Proyectos en el área de TIC en The Insight Partners, y aporta una amplia experiencia en la gestión y ejecución de proyectos de investigación sindicados, personalizados, por suscripción y de consultoría en diversos sectores tecnológicos.
Con una trayectoria comprobada en la entrega de análisis basados en datos e información práctica, Nivedita ha sido una colaboradora clave en varios proyectos cruciales. Su trabajo abarca la ejecución integral de proyectos, desde la comprensión de los objetivos del cliente y el análisis de las tendencias del mercado hasta la formulación de recomendaciones estratégicas. Ha colaborado extensamente con empresas líderes en TIC, ayudándolas a identificar oportunidades de mercado y a adaptarse a los cambios del sector.
Nivedita posee un MBA en Administración de Empresas por IMS, Dehradun. Antes de unirse a The Insight Partners, adquirió una valiosa experiencia en MarketsandMarkets y Future Market Insights en Pune, donde ocupó diversos puestos de investigación y desarrolló una sólida base en análisis del sector y la interacción con el cliente.
- Análisis histórico (2 años), año base, pronóstico (7 años) con CAGR
- Análisis PEST y FODA
- Tamaño del mercado, valor/volumen: global, regional y nacional
- Industria y panorama competitivo
- Conjunto de datos de Excel
Testimonios
El informe de mercado de sistemas SCADA de Insight Partners es completo y ofrece información valiosa sobre las tendencias actuales y las previsiones futuras. El equipo fue altamente profesional, receptivo y me brindó un gran apoyo en todo momento. Estamos muy satisfechos y recomendamos ampliamente sus servicios.
RAN KEDEM Socio, Reali Technologies LTDsSolicité un informe sobre un mercado de software muy específico y el equipo lo elaboró en pocos días. La información era muy relevante y estaba bien presentada. Posteriormente, solicité algunos cambios y adiciones al informe. El equipo fue muy receptivo y recibí el informe final en menos de una semana.
JEAN-HERVE JENN Presidente, Future AnalyticaTrabajamos con The Insight Partners para un importante estudio y pronóstico de mercado. Nos brindaron una visión clara de las oportunidades y los riesgos, lo que nos ayudó a definir nuestros planes. Su investigación fue fácil de usar y se basó en datos sólidos. Nos ayudó a tomar decisiones inteligentes y seguras. Los recomendamos ampliamente.
PIYUSH NAGPAL Vicepresidente Sénior, , High Beam GlobalThe Insight Partners realizó una investigación de mercado profunda y bien estructurada con una sólida experiencia en el sector. Su equipo fue profesional y receptivo en todo momento. El sitio web, fácil de usar, facilitó el acceso a los informes del sector. Los recomendamos ampliamente por sus servicios de investigación confiables y de alta calidad.
YUKIHIKO ADACHI Director Ejecutivo, , Deep Blue, LLCEsta es la primera vez que compro un informe de mercado de The Insight Partners. Aunque al principio tenía dudas, visité su sitio web y me sentí más cómodo al arriesgarme y comprarlo. Estoy completamente satisfecho con la calidad del informe y el servicio al cliente. Tenía varias preguntas y comentarios sobre el informe inicial, pero después de un par de conversaciones por correo electrónico con su analista, creo que tengo un informe que puedo usar como base para nuestro proceso de planificación estratégica. Muchas gracias por tomarse el tiempo y hacer de esta una experiencia positiva. Sin duda, recomendaré sus servicios y serán mi primera opción cuando necesitemos más datos de mercado.
JOHN SUZUKI Presidente y Director Ejecutivo, Director de la Junta Directiva, BK TechnologiesAgradezco su apoyo y la profesionalidad que demostraron al atender mi solicitud de información sobre el mercado de diagnóstico in vitro (IVD) para enfermedades infecciosas en Nigeria. Agradezco su paciencia, su orientación y su disposición a ofrecerme un descuento, lo que finalmente nos permitió cerrar un trato. Espero poder colaborar con The Insight Partners en el futuro, gracias a la impresión que me causó este primer encuentro.
DRA. CHIJIOKE ONYIA, DIRECTORA GENERAL, PineCrest Healthcare Ltd.Razón para comprar
- Toma de decisiones informada
- Comprensión de la dinámica del mercado
- Análisis competitivo
- Información sobre clientes
- Pronósticos del mercado
- Mitigación de riesgos
- Planificación estratégica
- Justificación de la inversión
- Identificación de mercados emergentes
- Mejora de las estrategias de marketing
- Impulso de la eficiencia operativa
- Alineación con las tendencias regulatorias


Desbloquea descuentos exclusivos en informes
Consultar ahora


 Obtenga una muestra gratuita para - Mercado de sistemas de tuberías virtuales