仮想パイプラインシステム市場 - 2031年の成長予測、統計、事実
過去データ : 2021-2022 | 基準年 : 2023 | 予測期間 : 2024-2031仮想パイプラインシステム市場の規模と予測(2021年 - 2031年)、世界および地域のシェア、トレンド、成長機会分析レポートの対象範囲:タイプ別(標準トレーラーおよび牽引式トレーラー)、ガス別(CNG、水素、その他)、圧力定格別(3000 Psi未満、3001~5000 Psi、5000 Psi以上)、アプリケーション別(産業、輸送、商業、住宅)、および地理別
- ステータス : 公開されたデータ
- レポートコード : TIPRE00011605
- カテゴリー : エネルギーと電力
- ページ数 : 150
- 利用可能なレポート形式 :


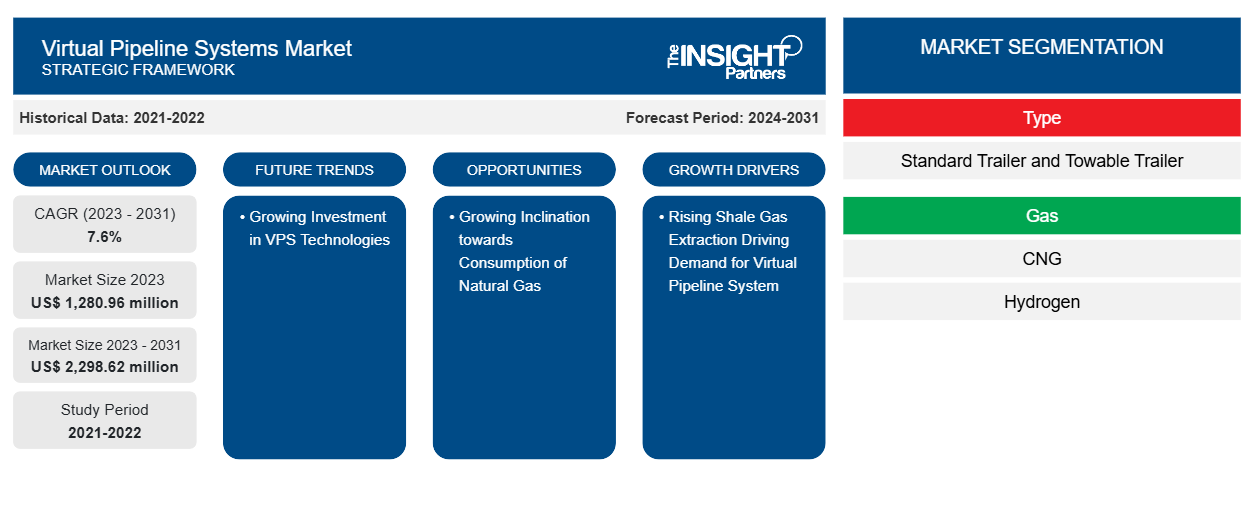
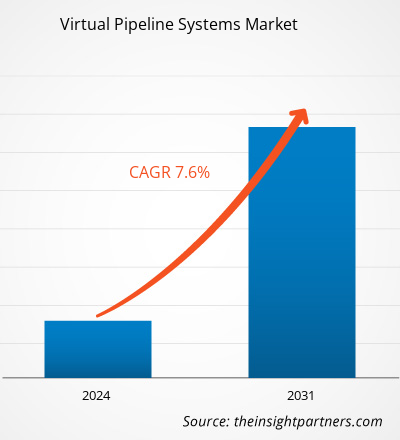
仮想パイプラインシステム市場規模は、2023年の12億8,096万米ドルから2031年には22億9,862万米ドルに達すると予測されています。市場は2023年から2031年にかけて7.6%のCAGRを記録すると予想されています。仮想パイプラインインフラストラクチャへの投資の大幅な増加は、仮想パイプラインシステム市場の重要なトレンドであり続けると思われます。
仮想パイプラインシステム市場分析
仮想パイプライン システム市場の主なエンドユーザーには、海洋、石油・ガス、石油化学、その他の産業用途が含まれます。産業や家庭向けのよりクリーンで持続可能な化石燃料としての天然ガスの利用が増えていることは、液化天然ガスの世界的な供給が有益な傾向にあることを示唆しています。海運会社、石油・ガス会社、石油化学会社は、この傾向を把握するために、戦略的に天然ガス フリートへの多様化を選択しています。したがって、エンドユーザー業界では、予測期間中に市場の動向をさらに活用する仮想パイプライン システムを採用するケースが増えています。
仮想パイプラインシステム市場の概要
仮想パイプラインにより、農業現場から回収した再生可能な天然ガスまたはバイオガスをエンドユーザーに送ることができます。したがって、ネットゼロの達成への関心の高まりと、グリーンエネルギーと再生可能エネルギー管理の重視により、予測期間中に市場の成長が促進されると予想されます。産業および商業分野での天然ガス供給の需要を強化する政府の取り組みを奨励することで、市場の成長が加速しています。米国では、生産と探査活動の増加に伴う石油およびガス産業への政府資金の増加が、市場の成長にプラスの影響を与えると予想されています。
要件に合わせてレポートをカスタマイズする
このレポートの一部、国レベルの分析、Excelデータパックなど、あらゆるレポートを無料でカスタマイズできます。また、スタートアップや大学向けのお得なオファーや割引もご利用いただけます。
仮想パイプラインシステム市場:戦略的洞察
-
このレポートの主要な市場動向を入手してください。この無料サンプルには、市場動向から見積もりや予測に至るまでのデータ分析が含まれます。
仮想パイプラインシステムの市場推進要因と機会
シェールガス採掘の増加が仮想パイプラインシステムの需要を牽引
シェール掘削手順の継続的な開発により、シェールは安定したエネルギー資源の 1 つになりました。シェールガスは石炭よりも炭素排出量が少ないため、エネルギー源として石炭に依存している国々では、よりクリーンなエネルギーの代替として活用できます。シェールガスの生産により、世界中で天然ガスの供給が豊かになりました。関連技術の開発によるシェルのガス探査および抽出プロジェクトの増加と、大量の埋蔵量の存在により、仮想パイプライン システムの需要が高まり、市場開発が進んでいます。shales one of the consistent energy resource. Shale gas can be exploited as a cleaner energy alternatives in countries that are dependent on coal as an energy source, as it emits less carbon than coal. Shale gas production has ensued the plenty of natural gas supply worldwide. The increase in shell gas exploration and extraction projects due to developments in related technologies, coupled with the availability of a large number of reserves, is enhancing the demand for virtual pipeline systems, thereby increasing market development.
天然ガス需要の高まり – 仮想パイプラインシステム市場におけるチャンス
石油・ガスおよびエネルギー事業者による天然ガス研究開発への重点と投資の増加は、仮想パイプラインシステム市場における企業の将来の発展に大幅な成長の見通しをもたらすと予測されています。これらの研究開発活動は、主に低排出天然ガス製品の使用を促進するという目標によって推進されています。老朽化したパイプラインインフラは、世界中の政府にとって重要な懸念事項となっています。その結果、政府は石油およびガス輸送の標準的な方法に代わる方法を見つけようと努めています。したがって、炭素排出と石油流出からの環境保護を確保するための厳格な政府規制は、仮想パイプライン市場のベンダーにとって有利な機会を生み出すと予想されます。
仮想パイプラインシステム市場レポートのセグメンテーション分析
仮想パイプライン システム市場分析の導出に貢献した主要なセグメントは、タイプ、ガス、圧力定格、およびアプリケーションです。
- タイプに基づいて、仮想パイプラインシステム市場は標準トレーラーと牽引式トレーラーに分けられています。標準トレーラーセグメントは2023年に大きな市場シェアを占めました。
- ガスに関しては、市場はCNG、水素、その他に細分化されています。2023年にはCNGセグメントが市場を支配しました。
- 圧力定格に関しては、市場は3000 Psi未満、3001〜5000 Psi、5000 Psi以上に分割されています。2023年には、3001〜5000 Psiのセグメントが市場を支配しました。
- 用途別に見ると、市場は産業、輸送、商業、住宅に区分されています。2023年には輸送部門が市場を支配しました。
仮想パイプラインシステムの地域別市場シェア分析
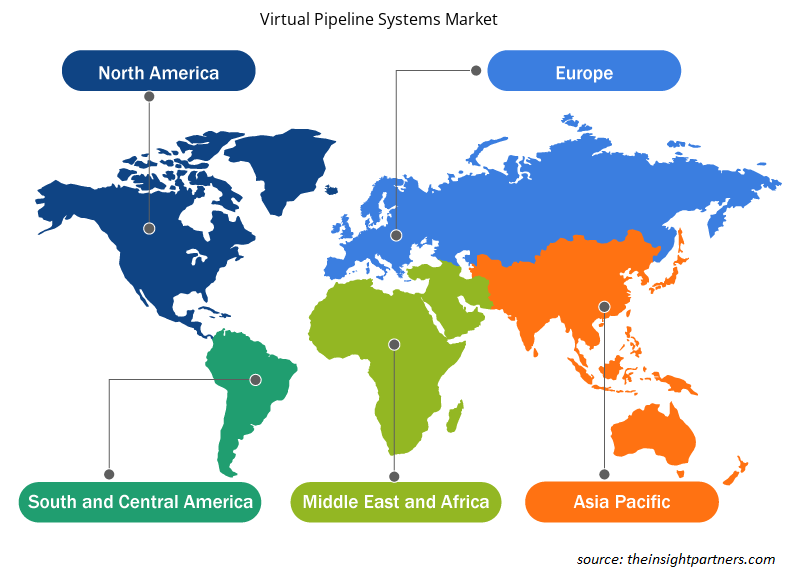
仮想パイプライン システム市場レポートの地理的範囲は、主に北米、アジア太平洋、ヨーロッパ、中東およびアフリカ、南米/中南米の 5 つの地域に分かれています。
北米は仮想パイプラインシステム市場をリードしました。北米の主要経済国には、米国、カナダ、メキシコがあります。北米の仮想パイプラインシステム市場の成長は、主に、LNG取引の増加、進行中の天然ガスインフラ開発、ガス駆動型エネルギー生成能力の向上に起因しています。パーミアン盆地での新規プロジェクトと大規模なシェールガス生産は、この地域の全体的な発展を促進するでしょう。北米で活動している主要な仮想パイプラインシステム企業は、Certarus Ltd.、Throttle Energy Inc. Technology、Clean Fuel Connection Inc.、Compass Natural Gas、NG Advantage、CNG Delivery、TX Energy Drilling Corporation、およびCorban Energy Groupです。多くの企業が北米の強力な生産ポテンシャルに惹かれ、天然ガスパイプラインインフラの構築に多額の支出が行われ、北米の仮想パイプラインシステム市場の成長を牽引しています。
仮想パイプラインシステム市場の地域別分析
予測期間を通じて仮想パイプライン システム市場に影響を与える地域的な傾向と要因は、Insight Partners のアナリストによって徹底的に説明されています。このセクションでは、北米、ヨーロッパ、アジア太平洋、中東およびアフリカ、南米および中米にわたる仮想パイプライン システム市場のセグメントと地理についても説明します。
- 仮想パイプラインシステム市場の地域別データを入手
仮想パイプラインシステム市場レポートの範囲
| レポート属性 | 詳細 |
|---|---|
| 2023年の市場規模 | 12億8,096万米ドル |
| 2031年までの市場規模 | 22億9,862万ドル |
| 世界のCAGR(2023年~2031年) | 7.6% |
| 履歴データ | 2021-2022 |
| 予測期間 | 2024-2031 |
| 対象セグメント |
タイプ別
|
| 対象地域と国 |
北米
|
| 市場リーダーと主要企業プロフィール |
|
市場プレーヤーの密度:ビジネスダイナミクスへの影響を理解する
仮想パイプライン システム市場は、消費者の嗜好の変化、技術の進歩、製品の利点に対する認識の高まりなどの要因により、エンド ユーザーの需要が高まり、急速に成長しています。需要が高まるにつれて、企業は提供内容を拡大し、消費者のニーズを満たすために革新し、新たなトレンドを活用し、市場の成長をさらに促進しています。
市場プレーヤー密度とは、特定の市場または業界内で活動している企業または会社の分布を指します。これは、特定の市場スペースに、その市場規模または総市場価値に対してどれだけの競合相手 (市場プレーヤー) が存在するかを示します。
仮想パイプラインシステム市場で事業を展開している主要企業は次のとおりです。
- ベイオテック株式会社
- CNGサービス株式会社
- ペトロリアム ナショナル ベルハッド (PETRONAS)
- RAGオーストリアAG
- クォンタムフューエルシステムズLLC
- ガリレオテクノロジーズSA
免責事項:上記の企業は、特定の順序でランク付けされていません。
- 仮想パイプラインシステム市場のトップキープレーヤーの概要を入手
仮想パイプラインシステムの市場ニュースと最近の動向
仮想パイプライン システム市場は、重要な企業出版物、協会データ、データベースを含む一次調査と二次調査後の定性的および定量的データを収集することによって評価されます。以下は、イノベーション、ビジネス拡大、および戦略の市場における動向のリストです。
- 2022年1月、ペトロナスはバーチャルパイプラインシステムと40VPSおよび41テクノロジーを使用して、1,000トンの液化天然ガス(LNG)を輸送しました。2020年に運用を開始したこの独創的なペトロナスのソリューションは、極低温タンクを装備した車両を使用して、オフグリッド消費者に1,600万kgを超える低炭素エネルギーを提供しました。(出典:ペトロナス、プレスリリース/会社ウェブサイト/ニュースレター)
- 2022年5月、Chart Industries, Inc.は、北欧地域での拠点を強化するために、CSC Cryogenic Service Center ABを買収しました。(出典:Chart Industries, Inc.、プレスリリース/企業ウェブサイト/ニュースレター)
仮想パイプラインシステム市場レポートの対象範囲と成果物
「仮想パイプラインシステム市場規模と予測(2021〜2031年)」レポートでは、以下の分野をカバーする市場の詳細な分析を提供しています。
- 仮想パイプラインシステムの市場規模と予測は、対象範囲に含まれるすべての主要市場セグメントについて、世界、地域、国レベルで示されています。
- 市場の動向(推進要因、制約、主要な機会など)
- 仮想パイプラインシステムの市場動向
- 詳細なPESTおよびSWOT分析
- 主要な市場動向、世界および地域の枠組み、主要プレーヤー、規制、最近の市場動向を網羅した仮想パイプラインシステム市場分析
- 仮想パイプラインシステム市場業界、ランドスケープ、競争分析、市場集中、ヒートマップ分析、主要プレーヤー、最近の動向
- 詳細な企業プロフィール

ニヴェディタは、市場調査とビジネスコンサルティングの分野で9年以上の経験を持つ、優れたリサーチプロフェッショナルです。現在、The Insight PartnersでICT分野のプロジェクトマネージャーを務め、多様なテクノロジー分野におけるシンジケート、カスタム、サブスクリプションベース、そしてコンサルティングといった調査業務の管理と実行において深い専門知識を有しています。
データドリブンな分析と実用的なインサイトを提供してきた実績を持つニヴェディタは、数々の重要プロジェクトにおいて重要な貢献を果たしてきました。クライアントの目標理解、市場動向の分析、そして戦略的な提言の導出に至るまで、プロジェクトをエンドツーエンドで遂行します。彼女は大手ICT企業と幅広く協業し、市場機会の特定や業界の変化への対応を支援してきました。
ニヴェディタは、デラドゥンにあるIMSで経営学のMBAを取得しています。The Insight Partners入社前は、プネーのMarketsandMarketsとFuture Market Insightsで貴重な経験を積み、様々なリサーチ業務を経験することで、業界分析とクライアントエンゲージメントにおける確固たる基盤を築きました。
- 過去2年間の分析、基準年、CAGRによる予測(7年間)
- PEST分析とSWOT分析
- 市場規模価値/数量 - 世界、地域、国
- 業界と競争環境
- Excel データセット
お客様の声
Insight PartnersのSCADAシステム市場レポートは包括的で、現在のトレンドと将来の予測に関する貴重な洞察が含まれています。チームは終始、非常にプロフェッショナルで、対応が早く、サポートも充実していました。私たちは彼らのサービスに非常に満足しており、強くお勧めします。
ラン・ケデム パートナー, レアリテクノロジーズ株式会社非常に特殊なソフトウェア市場に関するレポートを依頼したところ、チームは数日でレポートを作成してくれました。情報は非常に関連性が高く、分かりやすくまとめられていました。その後、レポートにいくつか修正と追加を依頼しましたが、チームは非常に迅速に対応し、1週間も経たないうちに最終レポートを受け取ることができました。
ジャン=エルヴェ・ジェン 会長, フューチャー・アナリティカ重要な市場調査と予測のために、The Insight Partnersと協力しました。彼らは機会とリスクに関する明確な洞察を提供し、私たちの計画策定に役立ちました。彼らの調査は使いやすく、確かなデータに基づいており、賢明で自信に満ちた意思決定に役立ちました。彼らを強くお勧めします。
ピユーシュ・ナグパル 上級副社長, ハイビームグローバルInsight Partnersは、深い専門知識に基づき、洞察力に富み、構造化された市場調査を提供しました。チームは終始プロフェッショナルで、対応力も抜群でした。ユーザーフレンドリーなウェブサイトにより、業界レポートへのアクセスもスムーズでした。信頼性の高い高品質な調査サービスをお探しなら、Insight Partnersを強くお勧めします。
安達幸彦 最高経営責任者(CEO), ディープブルーLLC。The Insight Partnersから市場レポートを購入するのは今回が初めてです。最初は不安でしたが、ウェブサイトを見て、リスクを負ってでも購入してみようという気持ちになりました。レポートの品質とカスタマーサービスには大変満足しています。最初のレポートにはいくつか質問やコメントがありましたが、アナリストとメールで何度かやり取りした結果、戦略策定プロセスへのインプットとして活用できるレポートが完成しました。貴重なお時間を割いていただき、貴重な体験をさせていただき、誠にありがとうございました。他の方にもぜひお勧めしたいですし、今後さらに市場データが必要になった際には、まずThe Insight Partnersにご連絡させていただきます。
ジョン・スズキ 社長兼最高経営責任者、取締役, BKテクノロジーズナイジェリアの感染症IVD市場に関する情報提供依頼に対し、ご対応いただいた際、ご尽力とプロフェッショナルな姿勢に深く感謝申し上げます。忍耐強く、的確なアドバイスをいただき、また、最終的に取引成立に至った割引のご提供にも深く感謝申し上げます。今回の最初の出会いで得た強い印象のおかげで、今後もThe Insight Partnersとの連携を心待ちにしております。
チジオケ博士 オニア マネージングディレクター, パインクレストヘルスケア株式会社購入理由
- 情報に基づいた意思決定
- 市場動向の理解
- 競合分析
- 顧客インサイト
- 市場予測
- リスク軽減
- 戦略計画
- 投資の正当性
- 新興市場の特定
- マーケティング戦略の強化
- 業務効率の向上
- 規制動向への対応


 無料サンプルを入手 - 仮想パイプラインシステム市場