Markt für virtuelle Pipelinesysteme – Erkenntnisse durch globale und regionale Analyse – Prognose bis 2031
Historische Daten : 2021-2022 | Basisjahr : 2023 | Prognosezeitraum : 2024-2031Marktgröße und Prognose für virtuelle Pipelinesysteme (2021 – 2031), Bericht über globale und regionale Anteile, Trends und Wachstumschancenanalysen: Nach Typ (Standardanhänger und Anhänger), Gas (CNG, Wasserstoff und andere), Druckstufe (weniger als 3000 Psi, 3001 bis 5000 Psi und mehr als 5000 Psi) und Anwendung (Industrie, Transport, Gewerbe und Wohnen) sowie Geografie
- Status : Veröffentlichte Daten
- Berichtscode : TIPRE00011605
- Kategorie : Energie und Leistung
- Anzahl der Seiten : 150
- Verfügbare Berichtsformate :


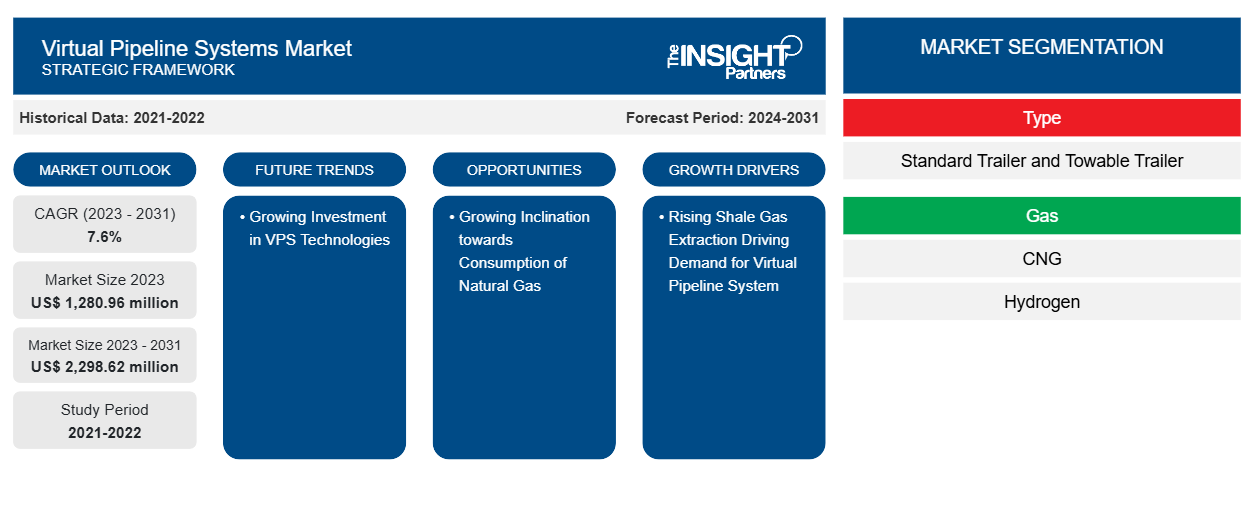
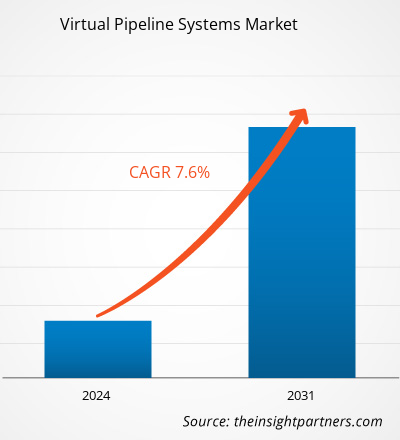
Der Markt für virtuelle Pipelinesysteme soll von 1.280,96 Millionen US-Dollar im Jahr 2023 auf 2.298,62 Millionen US-Dollar im Jahr 2031 anwachsen. Der Markt soll zwischen 2023 und 2031 eine durchschnittliche jährliche Wachstumsrate (CAGR) von 7,6 % verzeichnen. Die deutlich steigenden Investitionen in virtuelle Pipeline-Infrastrukturen dürften ein wichtiger Markttrend für virtuelle Pipelinesysteme bleiben.CAGR of 7.6% in 2023–2031. The significantly growing investment in virtual pipeline infrastructure is likely to remain a key virtual pipeline systems market trend.
Marktanalyse für virtuelle Pipelinesysteme
Zu den wichtigsten Endverbrauchern des Marktes für virtuelle Pipelinesysteme zählen die Schifffahrt, Öl- und Gasindustrie, Petrochemie und andere Industriezweige. Die zunehmende Nutzung von Erdgas als sauberer und nachhaltiger fossiler Brennstoff für Industrie und Haushalte hat gezeigt, dass die Versorgung mit verflüssigtem Erdgas weltweit ein positiver Trend ist. Um diesen Trend zu nutzen, entscheiden sich Schifffahrtsunternehmen, Öl- und Gasunternehmen sowie Petrochemieunternehmen strategisch für eine Diversifizierung in Erdgasflotten. Daher setzen Endverbraucherbranchen zunehmend auf virtuelle Pipelinesysteme, was die Marktdynamik in den Prognosejahren weiter steigern wird.liquified natural gas globally is a beneficial trend. Shipping companies, oil & gas, and petrochemical companies are strategically choosing to diversify into natural gas fleets to grasp this trend. Thus, end-user industries are increasingly adopting virtual pipeline systems which is further leveraging the market dynamics over the forecast years.
Marktübersicht für virtuelle Pipelinesysteme
Virtuelle Pipelines ermöglichen die Übertragung von gewonnenem erneuerbarem Erdgas oder Biogas von landwirtschaftlichen Standorten zu Endverbrauchern. Daher wird erwartet, dass eine stärkere Fokussierung auf das Erreichen von Netto-Null und eine Betonung von grüner Energie und erneuerbarem Energiemanagement das Marktwachstum im Prognosezeitraum ankurbeln werden. Die Förderung staatlicher Initiativen zur Stärkung der Nachfrage nach Erdgasversorgung in Industrie- und Gewerbegebieten steigert das Marktwachstum. In den USA wird erwartet, dass die wachsende staatliche Förderung der Öl- und Gasindustrie mit zunehmenden Produktions- und Explorationsaktivitäten das Marktwachstum positiv beeinflussen wird.
Passen Sie diesen Bericht Ihren Anforderungen an
Sie erhalten kostenlos individuelle Anpassungen an jedem Bericht, einschließlich Teilen dieses Berichts oder einer Analyse auf Länderebene, eines Excel-Datenpakets sowie tolle Angebote und Rabatte für Start-ups und Universitäten.
Markt für virtuelle Pipelinesysteme: Strategische Einblicke
-
Holen Sie sich die wichtigsten Markttrends aus diesem Bericht.Dieses KOSTENLOSE Beispiel umfasst eine Datenanalyse von Markttrends bis hin zu Schätzungen und Prognosen.
Markttreiber und Chancen für virtuelle Pipelinesysteme
Steigende Schiefergasförderung treibt Nachfrage nach virtuellen Pipelinesystemen
Durch die ständige Weiterentwicklung der Schieferbohrverfahren ist Schiefer zu einer der beständigsten Energieressourcen geworden. Schiefergas kann in Ländern, die von Kohle als Energiequelle abhängig sind, als sauberere Energiealternative genutzt werden, da es weniger Kohlenstoff ausstößt als Kohle. Die Schiefergasproduktion hat zu einer weltweiten Fülle an Erdgas geführt. Die Zunahme von Schiefergas-Explorations- und -Extraktionsprojekten aufgrund der Entwicklung verwandter Technologien, gepaart mit der Verfügbarkeit großer Mengen an Reserven, steigert die Nachfrage nach virtuellen Pipelinesystemen und fördert damit die Marktentwicklung.shales one of the consistent energy resource. Shale gas can be exploited as a cleaner energy alternatives in countries that are dependent on coal as an energy source, as it emits less carbon than coal. Shale gas production has ensued the plenty of natural gas supply worldwide. The increase in shell gas exploration and extraction projects due to developments in related technologies, coupled with the availability of a large number of reserves, is enhancing the demand for virtual pipeline systems, thereby increasing market development.
Steigende Nachfrage nach Erdgas – eine Chance auf dem Markt für virtuelle Pipelinesysteme
Die verstärkte Konzentration und Investition in die Erdgasforschung und -entwicklung durch Öl- und Gas- sowie Energieunternehmen dürfte erhebliche Wachstumsaussichten für die zukünftige Entwicklung von Unternehmen auf dem Markt für virtuelle Pipelinesysteme bieten. Diese F&E-Aktivitäten werden hauptsächlich von ihrem Ziel angetrieben, die Verwendung emissionsarmer Erdgasprodukte zu fördern . Die alternde Pipeline-Infrastruktur ist für Regierungen weltweit ein Hauptanliegen. Daher bemühen sie sich, Alternativen zu den herkömmlichen Methoden des Öl- und Gastransports zu finden. Daher wird erwartet, dass strenge staatliche Vorschriften zum Schutz der Umwelt vor Kohlenstoffemissionen und Ölverschmutzungen lukrative Möglichkeiten für Anbieter auf dem Markt für virtuelle Pipelines schaffen.
Segmentierungsanalyse des Marktberichts zu virtuellen Pipelinesystemen
Wichtige Segmente, die zur Ableitung der Marktanalyse für virtuelle Pipelinesysteme beigetragen haben, sind Typ, Gas, Druckwert und Anwendung.
- Basierend auf dem Typ wurde der Markt für virtuelle Pipelinesysteme in Standardanhänger und Zuganhänger unterteilt. Das Segment der Standardanhänger hatte im Jahr 2023 einen größeren Marktanteil.
- In Bezug auf Gas wurde der Markt in CNG, Wasserstoff und andere segmentiert. Das CNG-Segment dominierte den Markt im Jahr 2023.
- In Bezug auf den Druckwert wurde der Markt in weniger als 3000 Psi, 3001 bis 5000 Psi und mehr als 5000 Psi segmentiert. Das Segment 3001 bis 5000 Psi dominierte den Markt im Jahr 2023.
- In Bezug auf die Anwendung wurde der Markt in Industrie, Transport, Gewerbe und Wohnen segmentiert. Das Transportsegment dominierte den Markt im Jahr 2023.
Marktanteilsanalyse für virtuelle Pipelinesysteme nach Geografie
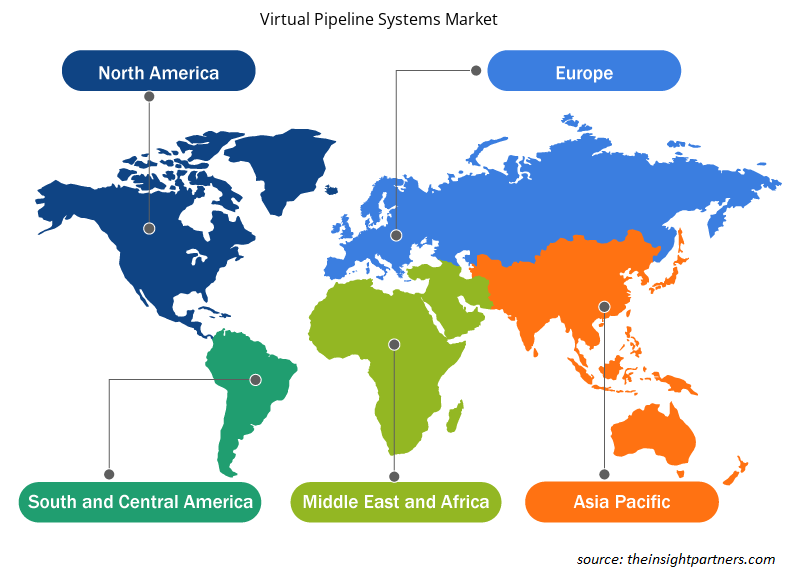
Der geografische Umfang des Marktberichts zu virtuellen Pipelinesystemen ist hauptsächlich in fünf Regionen unterteilt: Nordamerika, Asien-Pazifik, Europa, Naher Osten und Afrika sowie Südamerika/Süd- und Mittelamerika.
Nordamerika war führend auf dem Markt für virtuelle Pipelinesysteme. Die USA, Kanada und Mexiko gehören zu den größten Volkswirtschaften Nordamerikas. Das Wachstum des Marktes für virtuelle Pipelinesysteme in Nordamerika ist hauptsächlich auf den steigenden LNG-Handel, die laufende Entwicklung der Erdgasinfrastruktur und die erhöhten gasbetriebenen Energieerzeugungskapazitäten zurückzuführen. Neue Projekte und eine erhebliche Schiefergasproduktion im Permian Basin werden die Gesamtentwicklung der Region fördern. Die wichtigsten in Nordamerika tätigen Unternehmen für virtuelle Pipelinesysteme sind Certarus Ltd., Throttle Energy Inc. Technology, Clean Fuel Connection Inc., Compass Natural Gas, NG Advantage, CNG Delivery, TX Energy Drilling Corporation und Corban Energy Group. Viele Unternehmen wurden vom starken Produktionspotenzial Nordamerikas angezogen, was zu erheblichen Ausgaben für den Bau der Erdgaspipeline-Infrastruktur geführt hat, was das Wachstum des Marktes für virtuelle Pipelinesysteme in Nordamerika vorantreibt.
Regionale Einblicke in den Markt für virtuelle Pipelinesysteme
Die regionalen Trends und Faktoren, die den Markt für virtuelle Pipelinesysteme während des gesamten Prognosezeitraums beeinflussen, wurden von den Analysten von Insight Partners ausführlich erläutert. In diesem Abschnitt werden auch Marktsegmente und Geografien für virtuelle Pipelinesysteme in Nordamerika, Europa, im asiatisch-pazifischen Raum, im Nahen Osten und Afrika sowie in Süd- und Mittelamerika erörtert.
- Erhalten Sie regionale Daten zum Markt für virtuelle Pipelinesysteme
Umfang des Marktberichts zu virtuellen Pipelinesystemen
| Berichtsattribut | Details |
|---|---|
| Marktgröße im Jahr 2023 | 1.280,96 Millionen US-Dollar |
| Marktgröße bis 2031 | 2.298,62 Millionen US-Dollar |
| Globale CAGR (2023 - 2031) | 7,6 % |
| Historische Daten | 2021-2022 |
| Prognosezeitraum | 2024–2031 |
| Abgedeckte Segmente |
Nach Typ
|
| Abgedeckte Regionen und Länder |
Nordamerika
|
| Marktführer und wichtige Unternehmensprofile |
|
Marktteilnehmerdichte: Der Einfluss auf die Geschäftsdynamik
Der Markt für virtuelle Pipelinesysteme wächst rasant, angetrieben durch die steigende Nachfrage der Endnutzer aufgrund von Faktoren wie sich entwickelnden Verbraucherpräferenzen, technologischen Fortschritten und einem größeren Bewusstsein für die Vorteile des Produkts. Mit steigender Nachfrage erweitern Unternehmen ihr Angebot, entwickeln Innovationen, um die Bedürfnisse der Verbraucher zu erfüllen, und nutzen neue Trends, was das Marktwachstum weiter ankurbelt.
Die Marktteilnehmerdichte bezieht sich auf die Verteilung der Firmen oder Unternehmen, die in einem bestimmten Markt oder einer bestimmten Branche tätig sind. Sie gibt an, wie viele Wettbewerber (Marktteilnehmer) in einem bestimmten Marktraum im Verhältnis zu seiner Größe oder seinem gesamten Marktwert präsent sind.
Die wichtigsten auf dem Markt für virtuelle Pipelinesysteme tätigen Unternehmen sind:
- Bayotech, Inc.
- CNG-Services GmbH
- Petroliam Nasional Berhad (PETRONAS)
- RAG Austria AG
- Quantum Fuel Systems LLC
- Galileo Technologies SA
Haftungsausschluss : Die oben aufgeführten Unternehmen sind nicht in einer bestimmten Reihenfolge aufgeführt.
- Überblick über die wichtigsten Akteure auf dem Markt für virtuelle Pipelinesysteme
Marktnachrichten und aktuelle Entwicklungen zu virtuellen Pipelinesystemen
Der Markt für virtuelle Pipelinesysteme wird durch die Erfassung qualitativer und quantitativer Daten nach Primär- und Sekundärforschung bewertet, die wichtige Unternehmensveröffentlichungen, Verbandsdaten und Datenbanken umfasst. Im Folgenden finden Sie eine Liste der Entwicklungen auf dem Markt für Innovationen, Geschäftserweiterungen und Strategien:
- Im Januar 2022 lieferte PETRONAS mithilfe seines Virtual Pipeline System und der 40 VPS & 41-Technologie 1.000 Tonnen Flüssigerdgas (LNG). Die kreative PETRONAS-Lösung, die 2020 in Betrieb genommen wurde, hat netzunabhängige Verbraucher mit über 16 Millionen kg kohlenstoffarmer Energie versorgt, wobei Fahrzeuge mit kryogenen Tanks zum Einsatz kamen. (Quelle: PETRONAS, Pressemitteilung/Unternehmenswebsite/Newsletter)
- Im Mai 2022 erwarb Chart Industries, Inc. CSC Cryogenic Service Center AB, um seine Präsenz in der nordischen Region zu stärken. (Quelle: Chart Industries, Inc., Pressemitteilung/Unternehmenswebsite/Newsletter)
Marktbericht zu virtuellen Pipelinesystemen – Umfang und Ergebnisse
Der Bericht „Marktgröße und Prognose für virtuelle Pipelinesysteme (2021–2031)“ bietet eine detaillierte Analyse des Marktes, die die folgenden Bereiche abdeckt:
- Marktgröße und Prognose für virtuelle Pipelinesysteme auf globaler, regionaler und Länderebene für alle wichtigen Marktsegmente, die im Rahmen des Projekts abgedeckt sind
- Marktdynamik wie Treiber, Beschränkungen und wichtige Chancen
- Markttrends für virtuelle Pipelinesysteme
- Detaillierte PEST- und SWOT-Analyse
- Marktanalyse für virtuelle Pipelinesysteme, die wichtige Markttrends, globale und regionale Rahmenbedingungen, wichtige Akteure, Vorschriften und aktuelle Marktentwicklungen umfasst
- Markt für virtuelle PipelinesystemeBranchen-, Landschafts- und Wettbewerbsanalyse, einschließlich Marktkonzentration, Heatmap-Analyse, prominenten Akteuren und jüngsten Entwicklungen
- Detaillierte Firmenprofile

Nivedita ist eine versierte Forschungsexpertin mit über 9 Jahren Erfahrung in Marktforschung und Unternehmensberatung. Sie ist derzeit als Projektmanagerin im IKT-Bereich bei The Insight Partners tätig und verfügt über umfassende Fachkenntnisse in der Leitung und Durchführung von syndizierten, kundenspezifischen, abonnementbasierten und beratenden Forschungsaufträgen in unterschiedlichen Technologiesektoren.
Mit einer nachgewiesenen Erfolgsbilanz bei der Bereitstellung datengestützter Analysen und umsetzbarer Erkenntnisse war Nivedita maßgeblich an mehreren kritischen Projekten beteiligt. Ihre Arbeit umfasst die vollständige Projektabwicklung – vom Verständnis der Kundenziele über die Analyse von Markttrends bis hin zur Ableitung strategischer Empfehlungen. Sie hat umfassend mit führenden IKT-Unternehmen zusammengearbeitet und ihnen geholfen, Marktchancen zu erkennen und Branchenveränderungen zu meistern.
Nivedita hat einen MBA in Management vom IMS, Dehradun. Vor ihrem Eintritt bei The Insight Partners sammelte sie wertvolle Erfahrungen bei MarketsandMarkets und Future Market Insights in Pune, wo sie verschiedene Forschungspositionen innehatte und sich ein solides Fundament in Branchenanalyse und Kundenbindung erarbeitete.
- Historische Analyse (2 Jahre), Basisjahr, Prognose (7 Jahre) mit CAGR
- PEST- und SWOT-Analyse
- Marktgröße Wert/Volumen – Global, Regional, Land
- Branchen- und Wettbewerbslandschaft
- Excel-Datensatz
Erfahrungsberichte
Der SCADA-Systemmarktbericht von Insight Partners ist umfassend und bietet wertvolle Einblicke in aktuelle Trends und Zukunftsprognosen. Das Team war durchweg hochprofessionell, reaktionsschnell und hilfsbereit. Wir sind sehr zufrieden und können die Dienstleistungen wärmstens empfehlen.
RAN KEDEM Partner, Reali Technologies LTDsIch habe einen Bericht über einen sehr spezifischen Softwaremarkt angefordert, und das Team hat ihn innerhalb weniger Tage erstellt. Die Informationen waren sehr relevant und gut präsentiert. Anschließend habe ich einige Änderungen und Ergänzungen zum Bericht angefordert. Das Team reagierte erneut sehr schnell, und ich erhielt den Abschlussbericht in weniger als einer Woche.
JEAN-HERVE JENN Vorsitzende, Future AnalyticaWir haben mit The Insight Partners für eine wichtige Marktstudie und Prognose zusammengearbeitet. Sie gaben uns klare Einblicke in Chancen und Risiken, die uns bei der Gestaltung unserer Pläne halfen. Ihre Recherchen waren benutzerfreundlich und basierten auf soliden Daten. Sie halfen uns, kluge und sichere Entscheidungen zu treffen. Wir können sie wärmstens empfehlen.
PIYUSH NAGPAL Sr. Vizepräsident, Fernlicht GlobalDie Insight Partners lieferten aufschlussreiche, gut strukturierte Marktforschung mit fundierter Fachkompetenz. Ihr Team war durchweg professionell und reaktionsschnell. Die benutzerfreundliche Website ermöglichte den Zugriff auf Branchenberichte. Wir empfehlen sie wärmstens für zuverlässige und hochwertige Forschungsdienstleistungen.
YUKIHIKO ADACHI Geschäftsführer, Deep Blue, LLC.Dies ist das erste Mal, dass ich einen Marktbericht von The Insight Partners erworben habe. Obwohl ich zunächst unsicher war, besuchte ich die Website und fühlte mich dann sicherer, das Risiko einzugehen und einen Marktbericht zu kaufen. Ich bin mit der Qualität des Berichts und dem Kundenservice rundum zufrieden. Ich hatte einige Fragen und Anmerkungen zum ersten Bericht, aber nach einigen E-Mail-Gesprächen mit dem Analysten bin ich überzeugt, dass ich einen Bericht habe, den ich als Input für unseren strategischen Planungsprozess verwenden kann. Vielen Dank, dass Sie sich die Zeit genommen und dies zu einer positiven Erfahrung gemacht haben. Ich werde Ihren Service auf jeden Fall weiterempfehlen und Sie werden meine erste Anlaufstelle sein, wenn wir weitere Marktdaten benötigen.
JOHN SUZUKI Präsident und Chief Executive Officer, Vorstandsmitglied, BK TechnologiesIch möchte mich für Ihre Unterstützung und die Professionalität bedanken, die Sie bei der Bearbeitung meiner Informationsanfrage zum IVD-Markt für Infektionskrankheiten in Nigeria gezeigt haben. Ich schätze Ihre Geduld, Ihre Beratung und die Tatsache, dass Sie bereit waren, einen Rabatt anzubieten, der uns schließlich den Abschluss eines Geschäfts ermöglichte. Ich freue mich darauf, The Insight Partners in Zukunft wieder zu beauftragen, dank des Eindrucks, den Sie bei dieser ersten Begegnung bei mir hinterlassen haben.
DR. CHIJIOKE ONYIA GESCHÄFTSFÜHRERIN, PineCrest Healthcare Ltd.Grund zum Kauf
- Fundierte Entscheidungsfindung
- Marktdynamik verstehen
- Wettbewerbsanalyse
- Kundeneinblicke
- Marktprognosen
- Risikominimierung
- Strategische Planung
- Investitionsbegründung
- Identifizierung neuer Märkte
- Verbesserung von Marketingstrategien
- Steigerung der Betriebseffizienz
- Anpassung an regulatorische Trends


Exklusive Berichtsrabatte freischalten
Jetzt anfragen


 Kostenlose Probe anfordern für - Markt für virtuelle Pipelinesysteme