
Descripción general del mercado de equipos de prueba de calidad del agua, crecimiento, tendencias, análisis, informe de investigación (2019-2027)
Descripción general del mercado de equipos de prueba de calidad del agua , crecimiento , tendencias , análisis , informe de investigación (2019-2027)
- Estado : Publicada
- Código de informe : TIPRE00004108
- Categoría : Electrónica y semiconductores
- Número de páginas : 173
- Formatos de informe disponibles :


- Fecha de última actualización : June 13, 2024

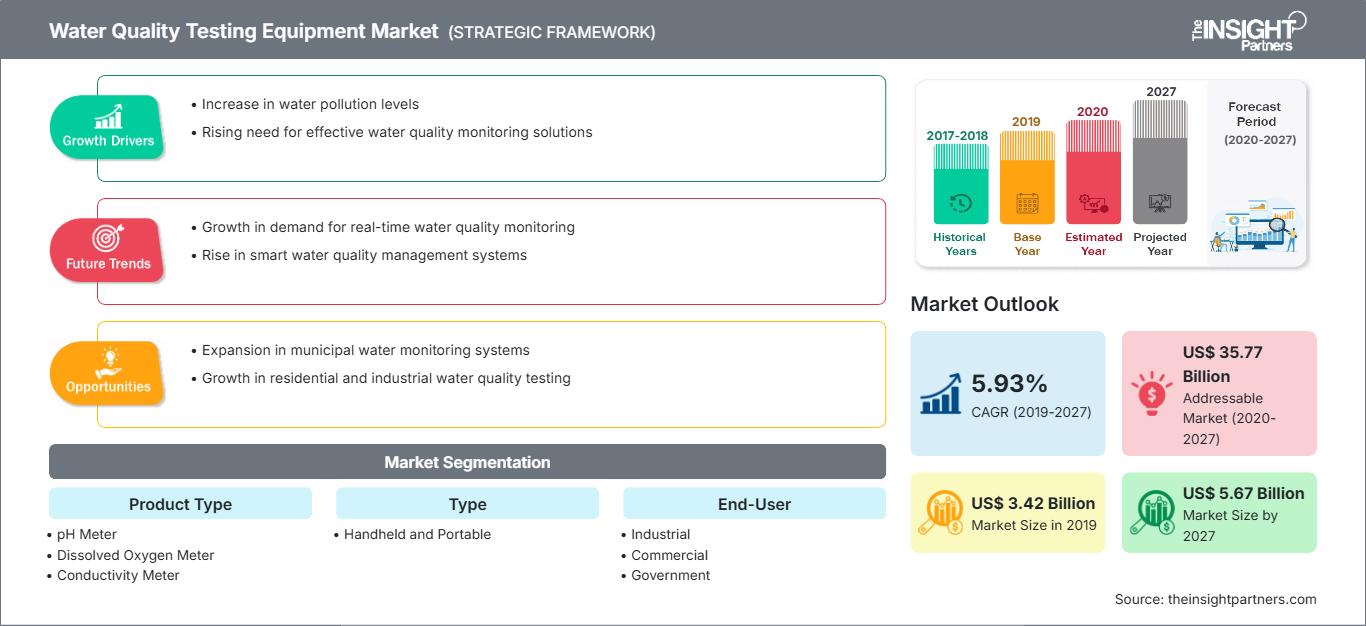
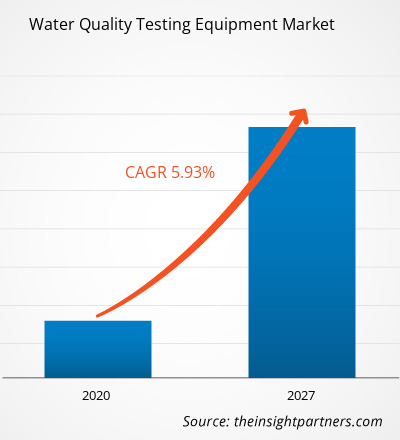
El mercado de equipos para el análisis de la calidad del agua alcanzó los 3.420 millones de dólares estadounidenses en 2018 y se espera que crezca a una tasa de crecimiento anual compuesta (TCAC) del 5,93% durante el período de previsión 2019-2027, hasta alcanzar los 5.670 millones de dólares estadounidenses en 2027.
América del Norte fue el principal mercado geográfico y se prevé que siga siendo el que más ingresos genere durante todo el período de pronóstico. Se espera que las importantes inversiones gubernamentales en infraestructura hídrica en los países desarrollados de Estados Unidos y Canadá impulsen el mercado de equipos para el análisis de la calidad del agua en esta región.
Perspectivas del mercado
Las estrictas legislaciones a nivel mundial sobre el mantenimiento de la calidad del agua contribuyen al crecimiento del mercado de equipos para el análisis de la calidad del agua.
La Ley de Agua Limpia (CWA, por sus siglas en inglés) de Estados Unidos se encarga de la protección de los cuerpos de agua en el país, estableciendo estándares acordes al uso previsto. La Ley de Agua Potable Segura (SWDA, por sus siglas en inglés) se encarga de mantener y mejorar la calidad del agua potable suministrada a la población. Asimismo, la SWDA es responsable de establecer los estándares en las plantas públicas de tratamiento de agua.
Obtendrá personalización en cualquier informe, sin cargo, incluidas partes de este informe o análisis a nivel de país, paquete de datos de Excel, así como también grandes ofertas y descuentos para empresas emergentes y universidades.
Mercado de equipos para análisis de la calidad del agua: Perspectivas estratégicas
-
Obtenga las principales tendencias clave del mercado que se describen en este informe.Esta muestra GRATUITA incluirá análisis de datos, que abarcarán desde tendencias de mercado hasta estimaciones y pronósticos.
Técnicas innovadoras de procesamiento de agua para impulsar el crecimiento general del mercado de equipos para el análisis de la calidad del agua
La desalinización es un proceso ampliamente utilizado en los países de Oriente Medio para equilibrar la oferta y la demanda de agua. Sin embargo, se ha observado que este proceso tiene impactos negativos específicos en los cuerpos de agua y el ecosistema acuático asociado. Se ha constatado que la desalinización provoca la dispersión de productos químicos y agentes antiincrustantes en el mar. Como medida correctiva, las agencias de gestión del agua utilizan estaciones de alerta automáticas y otros equipos de análisis de la calidad del agua. Por lo tanto, se prevé un aumento significativo en la adopción de sistemas de monitoreo de la calidad del agua en la región de Oriente Medio.
Información sobre tipos de productos
El mercado mundial de equipos para el análisis de la calidad del agua, segmentado por tipo de producto, estuvo liderado por los medidores de pH. Otros sistemas presentes en este mercado incluyen sensores de temperatura, de sílice, de sodio, de hierro y de carbono orgánico total (COT), entre otros. Los turbidímetros ocuparon el segundo lugar en 2017, pero se prevé que pierdan cuota de mercado durante el periodo de pronóstico de 2019 a 2027.
Información sobre tipos
El mercado mundial de equipos para análisis de la calidad del agua, segmentado por tipo, estuvo liderado por los equipos de sobremesa. El creciente interés de los gobiernos y la academia por la investigación y el desarrollo del análisis de la calidad del agua ha impulsado significativamente la demanda de estos equipos, principalmente para uso en laboratorio.
Información sobre el usuario final
El mercado global de equipos para el análisis de la calidad del agua se segmenta según el usuario final en equipos portátiles y de sobremesa. El sector comercial ocupó el segundo lugar en 2017 y se prevé que mantenga su cuota de mercado durante el período de pronóstico de 2019 a 2027. Otros usuarios finales de este mercado incluyen los sectores de educación, ciencias biológicas y otras ciencias naturales.
Los actores del mercado de equipos para el análisis de la calidad del agua se centran principalmente en la mejora de sus productos mediante la implementación de tecnologías avanzadas. La firma de acuerdos de colaboración, contratos, empresas conjuntas, financiación y la apertura de nuevas oficinas en todo el mundo permiten a la empresa mantener su prestigio a nivel global. A continuación, se enumeran algunos de los avances recientes:
2019: Emerson anunció la introducción de una nueva tecnología de sensores que proporciona una estabilidad diez veces mayor y reduce el riesgo en la calidad y el rendimiento para los fabricantes biofarmacéuticos.
2017: AquaPhoenix anunció una nueva aplicación móvil de análisis llamada «Aliquot», diseñada principalmente para que los técnicos de tratamiento de agua realicen análisis de forma sencilla y eficiente. Esta aplicación está disponible para dispositivos iOS y Android.
2017: Shimadzu anunció un centro conjunto de investigación y desarrollo en Singapur. Este centro cuenta con siete miembros del personal que trabajan en el desarrollo de un sensor ambiental de alta sensibilidad para detectar el nitrógeno y el fósforo presentes en lagos y ríos.
Perspectivas regionales del mercado de equipos para análisis de la calidad del agua
Los analistas de The Insight Partners han explicado en detalle las tendencias regionales y los factores que influyen en el mercado de equipos para el análisis de la calidad del agua durante el período de previsión. Esta sección también analiza los segmentos y la geografía del mercado de equipos para el análisis de la calidad del agua en Norteamérica, Europa, Asia Pacífico, Oriente Medio y África, y Sudamérica y Centroamérica.
Alcance del informe de mercado de equipos para pruebas de calidad del agua
| Atributo del informe | Detalles |
|---|---|
| Tamaño del mercado en 2019 | 3.420 millones de dólares estadounidenses |
| Tamaño del mercado en 2027 | 5.670 millones de dólares estadounidenses |
| Tasa de crecimiento anual compuesto global (2019 - 2027) | 5,93% |
| Datos históricos | 2017-2018 |
| período de previsión | 2020-2027 |
| Segmentos cubiertos |
Por tipo de producto
|
| Regiones y países cubiertos |
América del norte
|
| Líderes del mercado y perfiles de empresas clave |
|
Densidad de los actores del mercado de equipos para análisis de la calidad del agua: comprensión de su impacto en la dinámica empresarial
El mercado de equipos para el análisis de la calidad del agua está creciendo rápidamente, impulsado por la creciente demanda de los usuarios finales debido a factores como la evolución de las preferencias de los consumidores, los avances tecnológicos y una mayor conciencia de los beneficios del producto. A medida que aumenta la demanda, las empresas amplían su oferta, innovan para satisfacer las necesidades de los consumidores y aprovechan las nuevas tendencias, lo que impulsa aún más el crecimiento del mercado.
- Obtenga una visión general de los principales actores del mercado de equipos para análisis de la calidad del agua.
EQUIPOS DE ANÁLISIS DE CALIDAD DEL AGUA A NIVEL MUNDIAL – SEGMENTACIÓN DEL MERCADO
Por tipo de producto
-
Medidor de pH
- Medidor de oxígeno disuelto
- Medidor de conductividad
- Medidor de turbidez
- Otros
Por tipo
- Portátil
- Banco de trabajo
Por usuario final
- Industrial
- Comercial
- Gobierno
- Otros
Por geografía
-
América del norte
- A NOSOTROS
- Canadá
- México
-
Europa
- Francia
- Alemania
- Reino Unido
- Rusia
- Italia
- Resto de Europa
-
Asia Pacífico (APAC)
- Australia
- Porcelana
- India
- Japón
- Corea del Sur
- Resto de APAC
-
Oriente Medio y África (MEA)
- Arabia Saudita
- Sudáfrica
- Emiratos Árabes Unidos
- Resto de MEA
-
Sudamérica (SAM)
- Brasil
- Argentina
- El resto de SAM
Perfiles de empresas
- ABB Ltd
- Tecnologías Agilent Inc.
- AquaPhoenix Scientific Inc.
- Corporación Danaher,
- Compañía eléctrica Emerson
- Eurofins Scientific SE
- General Electric (GE)
- Horiba, Ltd.
- Corporación Shimadzu
- Thermo-Fisher Scientific

Naveen es un experimentado profesional en investigación de mercados y consultoría con más de 9 años de experiencia en proyectos personalizados, sindicados y de consultoría. Actualmente se desempeña como Vicepresidente Asociado, donde ha gestionado con éxito a las partes interesadas en toda la cadena de valor del proyecto y ha redactado más de 100 informes de investigación y más de 30 proyectos de consultoría. Su trabajo abarca proyectos industriales y gubernamentales, contribuyendo significativamente al éxito de los clientes y a la toma de decisiones basada en datos.
Naveen es licenciado en Ingeniería Electrónica y Comunicaciones por la VTU (Karnataka) y tiene un MBA en Marketing y Operaciones por la Universidad de Manipal. Ha sido miembro activo del IEEE durante 9 años, participando en conferencias, simposios técnicos y realizando voluntariado tanto a nivel de sección como regional. Antes de su puesto actual, trabajó como Consultor Estratégico Asociado en IndustryARC y como Consultor de Servidores Industriales en Hewlett Packard (HP Global).
- Análisis exhaustivo del tamaño del mercado y previsiones
- Análisis detallado de la segmentación
- Evaluación en profundidad de la dinámica del mercado
- Información a nivel regional y nacional
- Panorama competitivo y análisis comparativo de empresas
- Inteligencia empresarial estratégica
Testimonios
El informe de mercado de sistemas SCADA de Insight Partners es completo y ofrece información valiosa sobre las tendencias actuales y las previsiones futuras. El equipo fue altamente profesional, receptivo y me brindó un gran apoyo en todo momento. Estamos muy satisfechos y recomendamos ampliamente sus servicios.
RAN KEDEM Socio, Reali Technologies LTDsSolicité un informe sobre un mercado de software muy específico y el equipo lo elaboró en pocos días. La información era muy relevante y estaba bien presentada. Posteriormente, solicité algunos cambios y adiciones al informe. El equipo fue muy receptivo y recibí el informe final en menos de una semana.
JEAN-HERVE JENN Presidente, Future AnalyticaTrabajamos con The Insight Partners para un importante estudio y pronóstico de mercado. Nos brindaron una visión clara de las oportunidades y los riesgos, lo que nos ayudó a definir nuestros planes. Su investigación fue fácil de usar y se basó en datos sólidos. Nos ayudó a tomar decisiones inteligentes y seguras. Los recomendamos ampliamente.
PIYUSH NAGPAL Vicepresidente Sénior, , High Beam GlobalThe Insight Partners realizó una investigación de mercado profunda y bien estructurada con una sólida experiencia en el sector. Su equipo fue profesional y receptivo en todo momento. El sitio web, fácil de usar, facilitó el acceso a los informes del sector. Los recomendamos ampliamente por sus servicios de investigación confiables y de alta calidad.
YUKIHIKO ADACHI Director Ejecutivo, , Deep Blue, LLCEsta es la primera vez que compro un informe de mercado de The Insight Partners. Aunque al principio tenía dudas, visité su sitio web y me sentí más cómodo al arriesgarme y comprarlo. Estoy completamente satisfecho con la calidad del informe y el servicio al cliente. Tenía varias preguntas y comentarios sobre el informe inicial, pero después de un par de conversaciones por correo electrónico con su analista, creo que tengo un informe que puedo usar como base para nuestro proceso de planificación estratégica. Muchas gracias por tomarse el tiempo y hacer de esta una experiencia positiva. Sin duda, recomendaré sus servicios y serán mi primera opción cuando necesitemos más datos de mercado.
JOHN SUZUKI Presidente y Director Ejecutivo, Director de la Junta Directiva, BK TechnologiesAgradezco su apoyo y la profesionalidad que demostraron al atender mi solicitud de información sobre el mercado de diagnóstico in vitro (IVD) para enfermedades infecciosas en Nigeria. Agradezco su paciencia, su orientación y su disposición a ofrecerme un descuento, lo que finalmente nos permitió cerrar un trato. Espero poder colaborar con The Insight Partners en el futuro, gracias a la impresión que me causó este primer encuentro.
DRA. CHIJIOKE ONYIA, DIRECTORA GENERAL, PineCrest Healthcare Ltd.Razón para comprar
- Toma de decisiones informada
- Comprensión de la dinámica del mercado
- Análisis competitivo
- Información sobre clientes
- Pronósticos del mercado
- Mitigación de riesgos
- Planificación estratégica
- Justificación de la inversión
- Identificación de mercados emergentes
- Mejora de las estrategias de marketing
- Impulso de la eficiencia operativa
- Alineación con las tendencias regulatorias


