
Panoramica del mercato delle apparecchiature per test della qualità dell’acqua, crescita, tendenze, analisi, rapporto di ricerca (2019-2027)
Mercato delle apparecchiature per il test della qualità dell'acqua fino al 2027 - Analisi e previsioni globali per tipo di prodotto (misuratore di pH, misuratore di ossigeno disciolto, conduttivimetro, tester di torbidità e altri); tipo (portatile e portatile); e utente finale (industriale, commerciale, governativo e altri)
- Stato : Edito
- Codice del report : TIPRE00004108
- Categoria : Elettronica e semiconduttori
- Numero di pagine : 173
- Formati di report disponibili :


- Data dell'ultimo aggiornamento : June 13, 2024

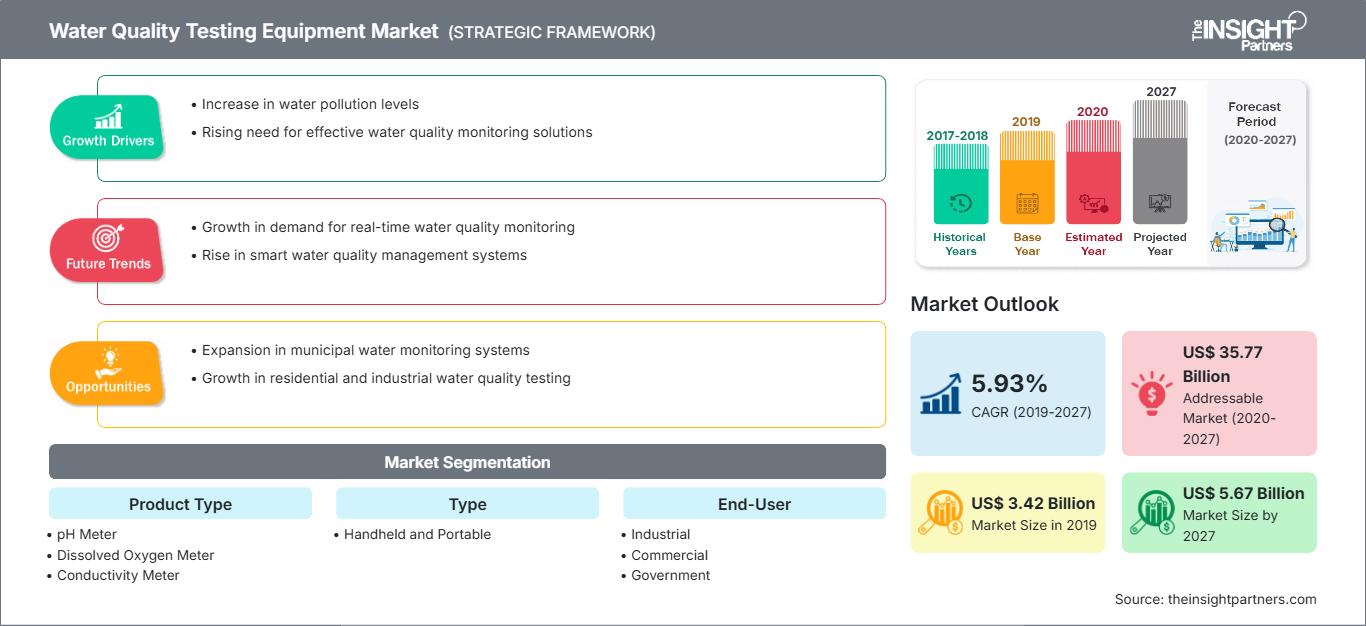
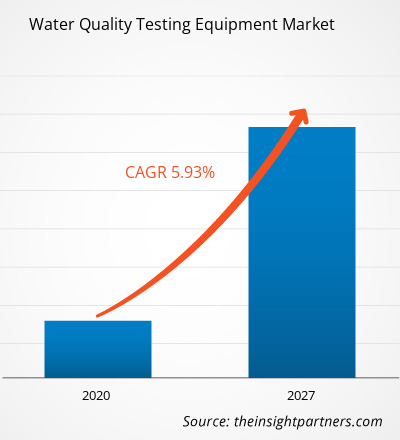
Il mercato delle apparecchiature per il test della qualità dell'acqua ha rappresentato 3,42 miliardi di dollari nel 2018 e si prevede che crescerà a un CAGR del 5,93% nel periodo di previsione 2019-2027, fino a raggiungere i 5,67 miliardi di dollari entro il 2027.
Il Nord America è stato il mercato geografico leader e si prevede che sarà il maggiore contributore di fatturato durante il periodo di previsione. Si prevede che significativi investimenti nel settore delle infrastrutture idriche da parte del governo nei paesi sviluppati di Stati Uniti e Canada alimenteranno il mercato delle apparecchiature per il test della qualità dell'acqua in questa regione.Approfondimenti di mercato: le severe normative globali sul mantenimento della qualità dell'acqua contribuiranno alla crescita del mercato delle apparecchiature per il test della qualità dell'acqua
Il Clean Water Act (CWA) negli Stati Uniti è responsabile della protezione dei corpi idrici negli Stati Uniti con standard stabiliti in base all'utilizzo desiderato. Il Safe Drinking Water Act (SWDA) è la legge nazionale che si occupa di mantenere e migliorare la qualità dell'acqua potabile fornita alla popolazione. È inoltre responsabile della definizione degli standard per gli impianti pubblici di trattamento delle acque.
Personalizza questo rapporto in base alle tue esigenze
Potrai personalizzare gratuitamente qualsiasi rapporto, comprese parti di questo rapporto, o analisi a livello di paese, pacchetto dati Excel, oltre a usufruire di grandi offerte e sconti per start-up e università
Mercato delle apparecchiature per il test della qualità dell'acqua: Approfondimenti strategici
-
Ottieni le principali tendenze chiave del mercato di questo rapporto.Questo campione GRATUITO includerà l'analisi dei dati, che vanno dalle tendenze di mercato alle stime e alle previsioni.
Il processo di desalinizzazione dell'acqua è un processo ampiamente adottato nei paesi del Medio Oriente per bilanciare domanda e offerta di acqua. Tuttavia, si osserva che il processo ha specifici impatti negativi sui corpi idrici e sull'ecosistema acquatico correlato. È stato osservato che il processo di desalinizzazione provoca la diffusione di sostanze chimiche e agenti antivegetativi in mare. Come misura correttiva, le agenzie idriche utilizzano stazioni di allerta automatiche e molte altre apparecchiature per il test della qualità dell'acqua per monitorarla. Si prevede pertanto un'impennata nell'adozione di sistemi di monitoraggio della qualità dell'acqua nella regione del Medio Oriente.
Approfondimenti sulle tipologie di prodotto
Il mercato globale delle apparecchiature per il test della qualità dell'acqua per tipologia di prodotto è stato guidato dal segmento dei pHmetri. Gli altri sistemi per il mercato delle apparecchiature per il test della qualità dell'acqua includono, tra gli altri, sensori di temperatura, sensori di misurazione della silice, sensori di misurazione del sodio, sensori di misurazione del ferro e sensori di carbonio organico totale (TOC). I tester di torbidità hanno rappresentato il secondo mercato più grande nel 2017 e si prevede che perderanno quote di mercato nel periodo di previsione dal 2019 al 2027.
Approfondimenti sulla tipologia
Il mercato globale delle apparecchiature per il test della qualità dell'acqua, per tipologia, è stato guidato dal segmento da banco. Con la crescente attenzione alla ricerca e allo sviluppo di analisi della qualità dell'acqua da parte del governo e della ricerca accademica, la domanda di apparecchiature da banco, principalmente per scopi di laboratorio, sta aumentando significativamente la richiesta di apparecchiature da banco per la qualità dell'acqua.
Approfondimenti sull'utente finale
Il mercato globale delle apparecchiature per il test della qualità dell'acqua è segmentato in base all'utente finale: apparecchiature portatili e da banco. I settori commerciali hanno rappresentato il secondo mercato più grande nel 2017 e si prevede che manterranno la loro quota di mercato nel periodo di previsione dal 2019 al 2027. 2027. Gli altri utenti finali del mercato delle apparecchiature per il test della qualità dell'acqua includono l'istruzione, le scienze biologiche e altri settori delle scienze naturali.
Gli operatori del mercato delle apparecchiature per il test della qualità dell'acqua si concentrano principalmente sul miglioramento dei prodotti attraverso l'implementazione di tecnologie avanzate. La stipula di partnership, contratti, joint venture, finanziamenti e l'inaugurazione di nuove sedi in tutto il mondo consentono all'azienda di mantenere il proprio marchio a livello globale. Di seguito sono elencati alcuni degli sviluppi recenti;
2019: Emerson ha annunciato l'introduzione di una nuova tecnologia di sensori per fornire una stabilità dei sensori circa dieci volte superiore e ridurre i rischi in termini di qualità e resa per i produttori biofarmaceutici. 2017: AquaPhoenix ha annunciato una nuova app di test mobile denominata "Aliquot", rivolta principalmente ai tecnici del settore idrico per rendere i test quotidiani semplici ed efficienti. Questa applicazione è disponibile per dispositivi mobili iOS e Android. 2017: Shimadzu ha annunciato un centro di innovazione congiunto per la ricerca e lo sviluppo a Singapore. Questo centro è composto da 7 membri dello staff che lavorano allo sviluppo di un sensore ambientale ad alta sensibilità per rilevare l'azoto e il fosforo contenuti in laghi e fiumi.
Approfondimenti regionali sul mercato delle apparecchiature per il test della qualità dell'acqua
Le tendenze regionali e i fattori che influenzano il mercato delle apparecchiature per il test della qualità dell'acqua durante il periodo di previsione sono stati ampiamente spiegati dagli analisti di The Insight Partners. Questa sezione illustra anche i segmenti di mercato e la geografia delle apparecchiature per il test della qualità dell'acqua in Nord America, Europa, Asia-Pacifico, Medio Oriente e Africa, America Meridionale e Centrale.
Ambito del rapporto di mercato sulle apparecchiature per il test della qualità dell'acqua
| Attributo del rapporto | Dettagli |
|---|---|
| Dimensioni del mercato in 2019 | US$ 3.42 Billion |
| Dimensioni del mercato per 2027 | US$ 5.67 Billion |
| CAGR globale (2019 - 2027) | 5.93% |
| Dati storici | 2017-2018 |
| Periodo di previsione | 2020-2027 |
| Segmenti coperti |
By Tipo di prodotto
|
| Regioni e paesi coperti |
Nord America
|
| Leader di mercato e profili aziendali chiave |
|
Densità degli operatori del mercato delle apparecchiature per il test della qualità dell'acqua: comprendere il suo impatto sulle dinamiche aziendali
Il mercato delle apparecchiature per il test della qualità dell'acqua è in rapida crescita, trainato dalla crescente domanda degli utenti finali, dovuta a fattori quali l'evoluzione delle preferenze dei consumatori, i progressi tecnologici e una maggiore consapevolezza dei vantaggi del prodotto. Con l'aumento della domanda, le aziende stanno ampliando la propria offerta, innovando per soddisfare le esigenze dei consumatori e sfruttando le tendenze emergenti, alimentando ulteriormente la crescita del mercato.
- Ottieni il Mercato delle apparecchiature per il test della qualità dell'acqua Panoramica dei principali attori chiave
- Misuratore di pH
- Misuratore di ossigeno disciolto
- Misuratore di conduttività
- Tester di torbidità
- Altri
Per tipo
- Portatile
- Da banco
Per utente finale
- Industriale
- Commerciale
- Governo
- Altri
Per area geografica
-
Nord America
- Stati Uniti
- Canada
- Messico
-
Europa
- Francia
- Germania
- Regno Unito
- Russia
- Italia
- Resto d'Europa
-
Asia Pacifico (APAC)
- Australia
- Cina
- India
- Giappone
- Corea del Sud
- Resto dell'APAC
-
Medio Oriente e Africa (MEA)
- Arabia Saudita
- Sudafrica
- Emirati Arabi Uniti
- Resto del MEA
-
Sud America (SAM)
- Brasile
- Argentina
- Resto del SAM
Profili aziendali
- ABB Ltd
- Agilent Technologies Inc.
- AquaPhoenix Scientific Inc.
- Danaher Corporation,
- Emerson Electric Co.
- Eurofins Scientific SE
- General Electric (GE)
- Horiba, Ltd.
- Shimadzu Corporation
- Thermo-Fisher Scientific

Naveen è un professionista esperto in ricerche di mercato e consulenza con oltre 9 anni di esperienza in progetti personalizzati, sindacati e di consulenza. Attualmente Vicepresidente Associato, ha gestito con successo gli stakeholder lungo l'intera catena del valore del progetto e ha redatto oltre 100 report di ricerca e oltre 30 incarichi di consulenza. Il suo lavoro spazia tra progetti industriali e governativi, contribuendo in modo significativo al successo dei clienti e al processo decisionale basato sui dati.
Naveen ha conseguito una laurea in Ingegneria Elettronica e delle Comunicazioni presso la VTU, Karnataka, e un MBA in Marketing e Operations presso la Manipal University. È membro attivo dell'IEEE da 9 anni, partecipando a conferenze, simposi tecnici e svolgendo attività di volontariato sia a livello di sezione che regionale. Prima del suo attuale ruolo, ha lavorato come Consulente Strategico Associato presso IndustryARC e come Consulente Server Industriali presso Hewlett Packard (HP Global).
- Analisi completa delle dimensioni e delle previsioni di mercato
- Analisi dettagliata della segmentazione
- Valutazione approfondita delle dinamiche di mercato
- Approfondimenti a livello regionale e nazionale
- Analisi del panorama competitivo e benchmarking aziendale
- Business intelligence strategica
Testimonianze
Il report di mercato sui sistemi SCADA di Insight Partners è completo, con preziosi spunti sulle tendenze attuali e sulle previsioni future. Il team si è dimostrato altamente professionale, reattivo e disponibile in ogni fase del progetto. Siamo molto soddisfatti e consigliamo vivamente i loro servizi.
RAN KEDEM Partner, Reali Technologies LTDsHo richiesto un report su un mercato software molto specifico e il team lo ha prodotto in pochi giorni. Le informazioni erano molto pertinenti e ben presentate. Ho quindi richiesto alcune modifiche e aggiunte al report. Il team è stato ancora una volta molto reattivo e ho ricevuto il report finale in meno di una settimana.
JEAN-HERVE JENN Presidente, Future AnalyticaAbbiamo collaborato con The Insight Partners per un importante studio di mercato e una previsione. Ci hanno fornito informazioni chiare su opportunità e rischi, che ci hanno aiutato a definire i nostri piani. La loro ricerca è stata facile da usare e basata su dati solidi. Ci ha aiutato a prendere decisioni intelligenti e consapevoli. Li consigliamo vivamente.
PIYUSH NAGPAL Vicepresidente senior, Abbaglianti globaliInsight Partners ha fornito ricerche di mercato approfondite e ben strutturate, con una solida competenza nel settore. Il loro team si è dimostrato professionale e reattivo in ogni fase. Il sito web intuitivo ha reso l'accesso ai report di settore semplice e immediato. Li consigliamo vivamente per servizi di ricerca affidabili e di alta qualità.
YUKIHIKO ADACHI Amministratore delegato, Deep Blue, LLC.Questa è la prima volta che acquisto un report di mercato da The Insight Partners. Sebbene inizialmente fossi indeciso, ho visitato il loro sito web e mi sono sentito più a mio agio nell'acquistare un report di mercato. Sono completamente soddisfatto della qualità del report e del servizio clienti. Avevo diverse domande e commenti sul report iniziale, ma dopo un paio di conversazioni via email con il loro analista credo di avere un report che posso utilizzare come input per il nostro processo di pianificazione strategica. Grazie mille per aver dedicato del tempo extra e aver reso questa esperienza positiva. Consiglierò sicuramente il vostro servizio ad altri e sarete la mia prima persona a cui rivolgermi quando avremo bisogno di ulteriori dati di mercato.
GIOVANNI SUZUKI Presidente e Amministratore Delegato, Consigliere di Amministrazione, Tecnologie BKDesidero esprimere la mia gratitudine per il supporto e la professionalità dimostrati nel rispondere alla mia richiesta di informazioni sul mercato dei dispositivi medici in vitro per malattie infettive in Nigeria. Apprezzo la vostra pazienza, la vostra guida e la vostra disponibilità a offrirmi uno sconto, che alla fine ci ha permesso di concludere l'affare. Non vedo l'ora di collaborare con The Insight Partners in futuro, grazie anche all'impressione che mi avete lasciato dopo questo primo incontro.
Dott. Chijioke AMMINISTRATORE DELEGATO DI ONYIA, PineCrest Healthcare Ltd.Motivo dell'acquisto
- Processo decisionale informato
- Comprensione delle dinamiche di mercato
- Analisi competitiva
- Analisi dei clienti
- Previsioni di mercato
- Mitigazione del rischio
- Pianificazione strategica
- Giustificazione degli investimenti
- Identificazione dei mercati emergenti
- Miglioramento delle strategie di marketing
- Aumento dell'efficienza operativa
- Allineamento alle tendenze normative


