Aperçu du marché des capteurs à fibre optique, croissance, tendances, analyse et rapport de recherche (2025-2031)
Données historiques : 2021-2023 | Année de référence : 2024 | Période de prévision : 2025-2031Analyse de la taille et des prévisions du marché des capteurs à fibre optique (2021-2031), des parts mondiales et régionales, des tendances et des opportunités de croissance. Couverture du rapport : par type de détection (détection de température, de pression, acoustique, de contrainte, etc.), utilisateur final (pétrole et gaz, fabrication, infrastructures, aérospatiale et défense, énergie et services publics, etc.), application (surveillance des pipelines, application en amont, détection d'incendie dans les actifs critiques, surveillance des câbles haute tension/d'alimentation, application CCS/CCUS, etc.) et géographie.
- Statut : Publié
- Code du rapport : TIPTE100000943
- Catégorie : Électronique et semi-conducteurs
- Nombre de pages : 270
- Formats de rapport disponibles :


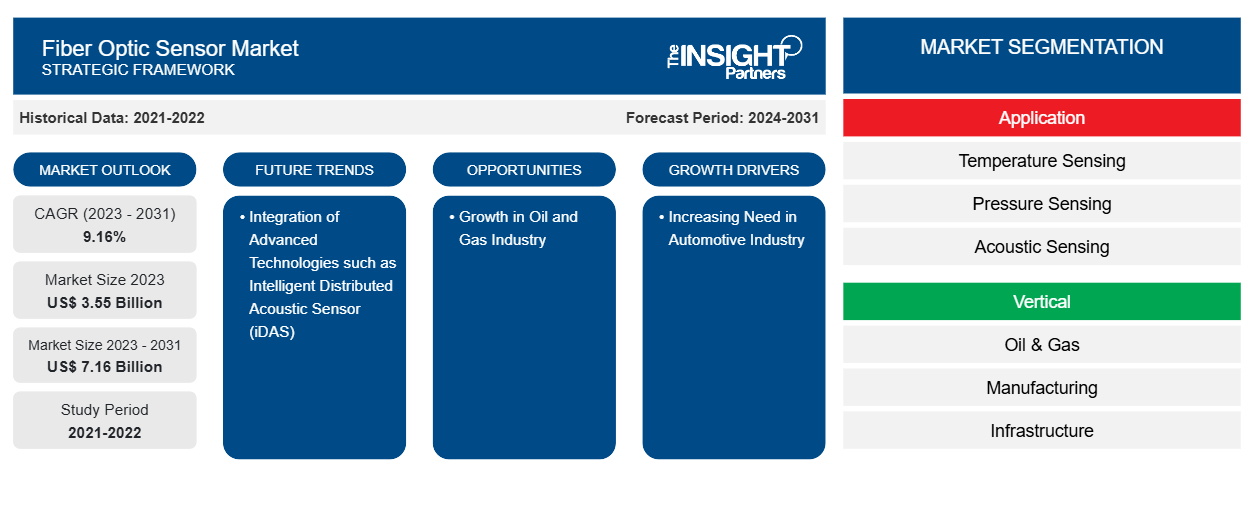
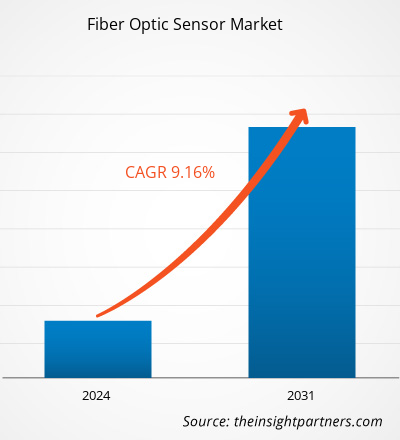
Le marché des capteurs à fibre optique devrait atteindre 6,76 milliards de dollars américains d'ici 2031, contre 3,61 milliards de dollars américains en 2024. Le marché devrait enregistrer un TCAC de 9,7 % entre 2025 et 2031. La miniaturisation et la portabilité devraient apporter de nouvelles tendances sur le marché dans les années à venir.
Analyse du marché des capteurs à fibre optique
La détection par fibre optique est une technologie utilisée pour mesurer les variations chimiques, la contrainte, la température, les champs électriques et magnétiques, la pression, le déplacement, la rotation, le rayonnement, le niveau de liquide, le débit, l'intensité lumineuse et les vibrations. Un capteur à fibre optique est un dispositif qui utilise la fibre optique soit pour détecter les changements environnementaux (capteurs intrinsèques), soit pour transmettre les signaux d'un capteur distant à un équipement de traitement (capteurs extrinsèques). Ces minuscules capteurs sont couramment utilisés en télédétection en raison de plusieurs avantages. Ils ne nécessitent pas d'alimentation électrique au point de détection et une seule fibre peut prendre en charge plusieurs capteurs. Ces avantages les rendent économiques et efficaces pour la surveillance des opérations sur de longues distances. Les capteurs à fibre optique sont durables et peuvent fonctionner à des températures extrêmes. Comme ils ne transportent pas d'électricité, ils fonctionnent également bien dans les zones à fortes interférences électriques, à haute tension ou présentant des matériaux inflammables ; ils sont donc parfaits pour une utilisation dans des secteurs tels que le pétrole et le gaz, la construction, l'aérospatiale et la santé.
Aperçu du marché des capteurs à fibre optique
L'essor des applications dans le secteur pétrolier et gazier et la demande croissante en surveillance de l'état des structures (SHM) dans différents secteurs sont les principaux facteurs qui stimulent le marché des capteurs à fibre optique. Ces capteurs jouent un rôle crucial dans l'amélioration de la sécurité et de l'efficacité des bâtiments, des pipelines et des systèmes de transport. Des secteurs comme le pétrole et le gaz, l'énergie et les télécommunications adoptent également ces technologies de détection pour améliorer leurs performances et leur fiabilité. Avec l'évolution croissante des industries vers l'automatisation et des systèmes plus intelligents, le marché mondial des capteurs à fibre optique devrait connaître une croissance constante dans les années à venir. Le développement des villes intelligentes et la croissance du secteur des énergies renouvelables créeront des opportunités lucratives sur ce marché dans un avenir proche.
Vous bénéficierez d'une personnalisation gratuite de n'importe quel rapport, y compris des parties de ce rapport, ou d'une analyse au niveau des pays, d'un pack de données Excel, ainsi que de superbes offres et réductions pour les start-ups et les universités.
Marché des capteurs à fibre optique : perspectives stratégiques
-
Obtenez les principales tendances clés du marché de ce rapport.Cet échantillon GRATUIT comprendra une analyse de données, allant des tendances du marché aux estimations et prévisions.
Moteurs et opportunités du marché des capteurs à fibre optique
Demande croissante en matière de surveillance de la santé structurelle
L'attention croissante portée à la sécurité des infrastructures et à leur surveillance en temps réel à travers le monde stimule la demande de systèmes avancés de surveillance de l'état des structures (SHM). Avec l'expansion des villes modernes et le vieillissement des infrastructures, il est constamment nécessaire de détecter les premiers signes de dommages ou de défaillances dans les structures telles que les ponts, les tunnels, les barrages et les bâtiments. Les systèmes traditionnels, tels que les jauges de contrainte résistives, présentent souvent des lacunes en termes de durabilité, de précision à long terme et d'adaptabilité. Les capteurs à fibre optique se sont imposés comme une alternative supérieure aux systèmes de surveillance traditionnels, offrant des avantages tels que leur compacité, leur résistance à la corrosion et leur tolérance aux interférences électromagnétiques. De plus, leur intégration directe dans les structures renforce leur popularité. Ces qualités les rendent idéaux pour la surveillance de l'état des structures à long terme, même dans des environnements difficiles. Ces capteurs peuvent mesurer avec précision des paramètres physiques clés tels que la déformation, la température, les vibrations et l'inclinaison, essentiels au maintien de l'intégrité et de la sécurité des infrastructures.
Pour répondre à la demande croissante, les entreprises du marché des capteurs à fibre optique mobilisent des investissements pour développer leurs technologies. Par exemple, Sentea, une spin-off d'imec et fournisseur de systèmes de lecture pour capteurs à fibre optique, a levé environ 2,6 millions de dollars américains (2,3 millions d'euros) en 2021 pour développer ses activités. L'annonce de cet investissement a été faite en octobre 2021. Soutenue par des investisseurs tels que Finindus, PMV, QBIC II et Fidimec, l'initiative d'expansion de Sentea se concentre sur le développement de la technologie photonique intégrée pour permettre la détection par fibre optique à grande échelle dans les domaines du génie civil, du pétrole et du gaz, des énergies renouvelables et des applications médicales. Ces investissements reflètent le potentiel croissant de déploiement de la technologie de détection par fibre optique dans les applications SHM, alimentant ainsi la croissance du marché des capteurs à fibre optique.
Développement des villes intelligentes
Le gouvernement indien a lancé la Mission 100 villes intelligentes le 25 juin 2015. Son objectif est de doter 100 villes du pays d'infrastructures modernes, d'un environnement propre et durable, et d'une meilleure qualité de vie grâce à des solutions intelligentes. Ce programme promeut un développement urbain global (social, économique, physique et institutionnel) dans le cadre d'un programme financé par le gouvernement central, doté d'un financement central d'environ 6 400 millions de dollars américains (48 000 crores de roupies indiennes), complété par les États et d'autres sources, notamment des partenariats public-privé (PPP). Cette mission vise à créer des modèles reproductibles de croissance urbaine durable et inclusive, que d'autres villes pourraient suivre. Au sein de l'Union européenne (UE), NetZeroCities soutient la mission « 100 villes climatiquement neutres et intelligentes d'ici 2030 » dans le cadre du programme Horizon Europe.
Avec le développement des villes intelligentes, le besoin d'outils de surveillance avancés tels que les capteurs à fibre optique ne cesse de croître. Ces capteurs peuvent fournir des données en temps réel, fonctionner efficacement dans des environnements difficiles et offrir une longue durée de vie. Ils peuvent être utilisés pour surveiller les ponts, les routes, les tunnels, les bâtiments, les conduites d'eau et les systèmes énergétiques. Par exemple, ils peuvent détecter des fissures dans les ponts, des fuites dans les pipelines ou des variations de température dans les réseaux électriques, aidant ainsi les autorités municipales à agir avant que les problèmes ne s'aggravent. Ces capteurs peuvent également être utilisés dans les systèmes de circulation intelligents, les réseaux intelligents et les bâtiments intelligents, où ils contribuent à améliorer les performances et la sécurité. Ainsi, l'essor des villes intelligentes offre une opportunité lucrative pour le marché des capteurs à fibre optique, car ces capteurs contribuent à la création de systèmes connectés et efficaces.
Analyse de segmentation du rapport sur le marché des capteurs à fibre optique
Les segments clés qui ont contribué à la dérivation de l’ analyse du marché des capteurs à fibre optique sont le type de détection, l’utilisateur final et l’application.
- Selon le type de capteur, le marché des capteurs à fibre optique est segmenté en capteurs de température, de pression, acoustiques et de contrainte, entre autres. En 2024, le segment des capteurs de température détenait la plus grande part de marché.
- En fonction de l'utilisateur final, le marché des capteurs à fibre optique est segmenté en secteurs du pétrole et du gaz, de l'industrie manufacturière, des infrastructures, de l'aérospatiale et de la défense, de l'énergie et des services publics, entre autres. Le secteur du pétrole et du gaz détenait la plus grande part de marché en 2024.
- En fonction des applications, le marché des capteurs à fibre optique est segmenté en surveillance de câbles haute tension ou haute puissance, surveillance de pipelines , applications en amont, détection d'incendie dans les actifs critiques, applications CCS/CCUS, etc. Ces autres segments détenaient la plus grande part de marché en 2024.
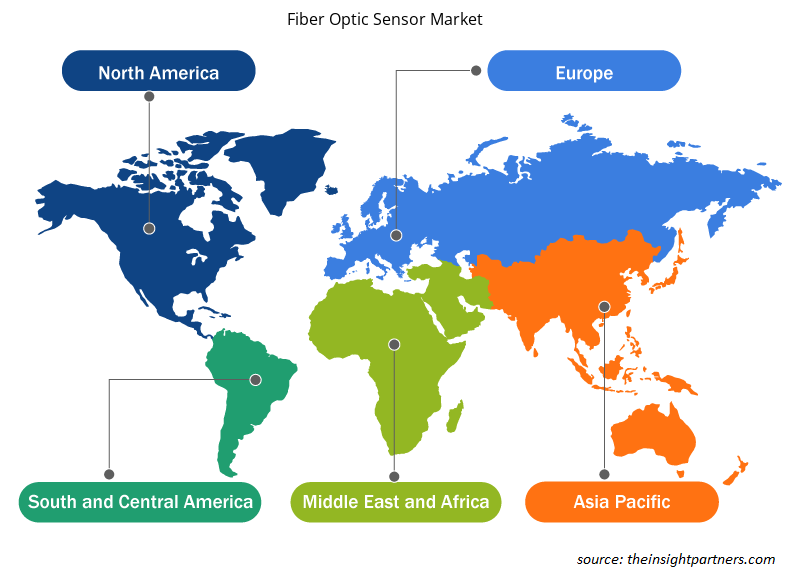
Analyse des parts de marché des capteurs à fibre optique par zone géographique
Le marché des capteurs à fibre optique est réparti géographiquement en cinq régions : Amérique du Nord, Asie-Pacifique, Europe, Moyen-Orient et Afrique, et Amérique du Sud et centrale. L'Asie-Pacifique détenait une part de marché significative en 2024.
Aperçu régional du marché des capteurs à fibre optique
Les tendances et facteurs régionaux influençant le marché des capteurs à fibre optique tout au long de la période de prévision ont été analysés en détail par les analystes d'Insight Partners. Cette section aborde également les segments et la géographie du marché des capteurs à fibre optique en Amérique du Nord, en Europe, en Asie-Pacifique, au Moyen-Orient et en Afrique, ainsi qu'en Amérique du Sud et en Amérique centrale.
- Obtenez les données régionales spécifiques au marché des capteurs à fibre optique
Portée du rapport sur le marché des capteurs à fibre optique
| Attribut de rapport | Détails |
|---|---|
| Taille du marché en 2024 | 3,61 milliards de dollars américains |
| Taille du marché d'ici 2031 | 6,76 milliards de dollars américains |
| TCAC mondial (2025 - 2031) | 9,7% |
| Données historiques | 2021-2023 |
| Période de prévision | 2025-2031 |
| Segments couverts |
Par type de détection
|
| Régions et pays couverts |
Amérique du Nord
|
| Leaders du marché et profils d'entreprises clés |
|
Densité des acteurs du marché des capteurs à fibre optique : comprendre son impact sur la dynamique commerciale
Le marché des capteurs à fibre optique connaît une croissance rapide, porté par une demande croissante des utilisateurs finaux, due à des facteurs tels que l'évolution des préférences des consommateurs, les avancées technologiques et une meilleure connaissance des avantages du produit. Face à cette demande croissante, les entreprises élargissent leur offre, innovent pour répondre aux besoins des consommateurs et capitalisent sur les nouvelles tendances, ce qui alimente la croissance du marché.
La densité des acteurs du marché désigne la répartition des entreprises opérant sur un marché ou un secteur particulier. Elle indique le nombre de concurrents (acteurs) présents sur un marché donné par rapport à sa taille ou à sa valeur marchande totale.
Les principales entreprises opérant sur le marché des capteurs à fibre optique sont :
- Baumer Holding AG
- Pepperl+Fuchs SE
- Wenglor Sensoric GmbH
- NEC Corp
- Proximion AB
- OMRON Corp
Avertissement : Les entreprises répertoriées ci-dessus ne sont pas classées dans un ordre particulier.
- Obtenez un aperçu des principaux acteurs du marché des capteurs à fibre optique
Actualités et développements récents du marché des capteurs à fibre optique
Le marché des capteurs à fibre optique est évalué en collectant des données qualitatives et quantitatives issues d'études primaires et secondaires, incluant des publications d'entreprises importantes, des données d'associations et des bases de données. Voici quelques-unes des évolutions du marché :
Wenglor a présenté l'amplificateur à fibre optique P1XD, spécialement conçu pour les applications en espace réduit. Les modèles de la série P1XD2 offrent des options d'intégration flexibles, permettant à l'amplificateur de fonctionner indépendamment ou au sein d'un système en réseau, en mode maître ou subordonné. (Source : Wenglor, communiqué de presse, décembre 2024)
Honeywell (NASDAQ : HON) et Civitanavi Systems (EURONEXT MILAN : CNS) ont lancé une nouvelle centrale inertielle destinée aux clients des secteurs commercial et militaire du monde entier. La famille HG2800 se compose de centrales inertielles à faible bruit, à large bande passante et hautes performances, de qualité tactique, conçues pour le pointage, la stabilisation et la navigation de courte durée sur les avions commerciaux et militaires, entre autres applications. (Source : Honeywell, communiqué de presse, septembre 2023)
Rapport sur le marché des capteurs à fibre optique : couverture et livrables
Le rapport « Taille et prévisions du marché des capteurs à fibre optique (2021-2031) » fournit une analyse détaillée du marché couvrant les domaines suivants :
- Taille et prévisions du marché des capteurs à fibre optique aux niveaux mondial, régional et national pour tous les segments de marché clés couverts par le champ d'application
- Tendances du marché des capteurs à fibre optique, ainsi que la dynamique du marché, telles que les moteurs, les contraintes et les opportunités clés
- Analyse PEST et SWOT détaillée
- Analyse du marché des capteurs à fibre optique couvrant les principales tendances du marché, le cadre mondial et régional, les principaux acteurs, les réglementations et les développements récents du marché
- Analyse du paysage industriel et de la concurrence couvrant la concentration du marché, l'analyse de la carte thermique, les principaux acteurs et les développements récents pour le marché des capteurs à fibre optique
- Profils d'entreprise détaillés

Naveen est un professionnel expérimenté des études de marché et du conseil, fort de plus de 9 ans d'expertise dans des projets personnalisés, syndiqués et de conseil. Actuellement vice-président associé, il a géré avec succès les parties prenantes tout au long de la chaîne de valeur des projets et a rédigé plus de 100 rapports de recherche et plus de 30 missions de conseil. Son expertise couvre des projets industriels et gouvernementaux, contribuant significativement à la réussite de ses clients et à la prise de décision fondée sur les données.
Naveen est titulaire d'un diplôme d'ingénieur en électronique et communication de la VTU, Karnataka, et d'un MBA en marketing et opérations de l'Université de Manipal. Membre actif de l'IEEE depuis 9 ans, il a participé à des conférences et des colloques techniques et s'est porté volontaire au niveau des sections et des régions. Avant d'occuper ce poste, il a travaillé comme consultant stratégique associé chez IndustryARC et comme consultant en serveurs industriels chez Hewlett Packard (HP Global).
- Analyse historique (2 ans), année de base, prévision (7 ans) avec TCAC
- Analyse PEST et SWOT
- Taille du marché Valeur / Volume - Mondial, Régional, Pays
- Industrie et paysage concurrentiel
- Ensemble de données Excel
Témoignages
Le rapport sur le marché des systèmes SCADA d'Insight Partners est complet et fournit des informations précieuses sur les tendances actuelles et les prévisions. L'équipe a fait preuve d'un grand professionnalisme, d'une grande réactivité et d'un grand soutien tout au long du projet. Nous sommes très satisfaits et recommandons vivement leurs services.
RAN KEDEM Partenaire, Reali Technologies LTDJ'ai demandé un rapport sur un marché logiciel très spécifique et l'équipe l'a produit en quelques jours. Les informations étaient très pertinentes et bien présentées. J'ai ensuite demandé des modifications et des ajouts au rapport. L'équipe a de nouveau été très réactive et j'ai reçu le rapport final en moins d'une semaine.
JEAN-HERVÉ JENN Président, Future AnalyticaNous avons collaboré avec The Insight Partners pour une importante étude de marché et des prévisions. Ils nous ont fourni une vision claire des opportunités et des risques, ce qui nous a aidés à élaborer nos plans. Leurs recherches étaient faciles à utiliser et basées sur des données solides. Elles nous ont permis de prendre des décisions éclairées et en toute confiance. Nous les recommandons vivement.
PIYUSH NAGPAL Vice-président principal, Feux de route mondiauxInsight Partners a réalisé une étude de marché pertinente et bien structurée, avec une solide expertise du domaine. Son équipe a fait preuve de professionnalisme et de réactivité tout au long du projet. Son site web convivial a facilité l'accès aux rapports sectoriels. Nous recommandons vivement ses services d'études fiables et de haute qualité.
YUKIHIKO ADACHI PDG, Bleu profond, LLC.C'est la première fois que j'achète une étude de marché auprès de The Insight Partners. J'étais un peu hésitant au début, mais j'ai consulté leur site web et me suis senti plus à l'aise pour prendre le risque d'acheter une étude de marché. Je suis entièrement satisfait de la qualité du rapport et du service client. J'avais plusieurs questions et commentaires concernant le rapport initial, mais après quelques échanges par e-mail avec leur analyste, je pense avoir obtenu un rapport qui pourra alimenter notre processus de planification stratégique. Merci beaucoup pour votre temps et pour avoir rendu cette expérience positive. Je recommanderai sans hésiter vos services et vous serez mon premier contact lorsque nous aurons besoin de données de marché supplémentaires.
JOHN SUZUKI Président-directeur général, administrateur du conseil d'administration, BK TechnologiesJe tiens à vous remercier pour votre soutien et le professionnalisme dont vous avez fait preuve lors du traitement de ma demande d'informations concernant le marché des dispositifs de diagnostic in vitro (DIV) pour les maladies infectieuses au Nigéria. J'apprécie votre patience, vos conseils et votre volonté d'offrir une réduction, ce qui nous a finalement permis de conclure un accord. Je me réjouis de collaborer à nouveau avec The Insight Partners, grâce à l'impression que vous m'avez laissée suite à cette première rencontre.
DR CHIJIOKE DIRECTEUR GÉNÉRAL D'ONYIA, PineCrest Healthcare Ltd.Raison d'acheter
- Prise de décision éclairée
- Compréhension de la dynamique du marché
- Analyse concurrentielle
- Connaissances clients
- Prévisions de marché
- Atténuation des risques
- Planification stratégique
- Justification des investissements
- Identification des marchés émergents
- Amélioration des stratégies marketing
- Amélioration de l'efficacité opérationnelle
- Alignement sur les tendances réglementaires


Débloquez des remises exclusives sur les rapports
Demander maintenant


 Obtenez un échantillon gratuit pour - Marché des capteurs à fibre optique