Crescita del mercato, dimensioni, quota, tendenze, analisi dei principali attori e previsioni fino al 2031
Dati storici : 2021-2022 | Anno base : 2023 | Periodo di previsione : 2024-2031Dimensioni e previsioni del mercato degli indicatori di livello (2021-2031), quota globale e regionale, trend e opportunità di crescita. Copertura del rapporto di analisi: per tipo di indicatore (livello del serbatoio, livello del carburante, livello dell'acqua e livello meccanico), tecnologia (indicatore di livello magnetico, indicatore di livello riflesso, indicatore di livello trasparente, indicatore di livello tabulare e altri), utente finale (petrolio e gas, alimenti e bevande, prodotti chimici e petrolchimici, settore marittimo, energia e potenza e altri) e area geografica.
- Stato : Dati rilasciati
- Codice del report : TIPRE00007888
- Categoria : Elettronica e semiconduttori
- Numero di pagine : 150
- Formati di report disponibili :


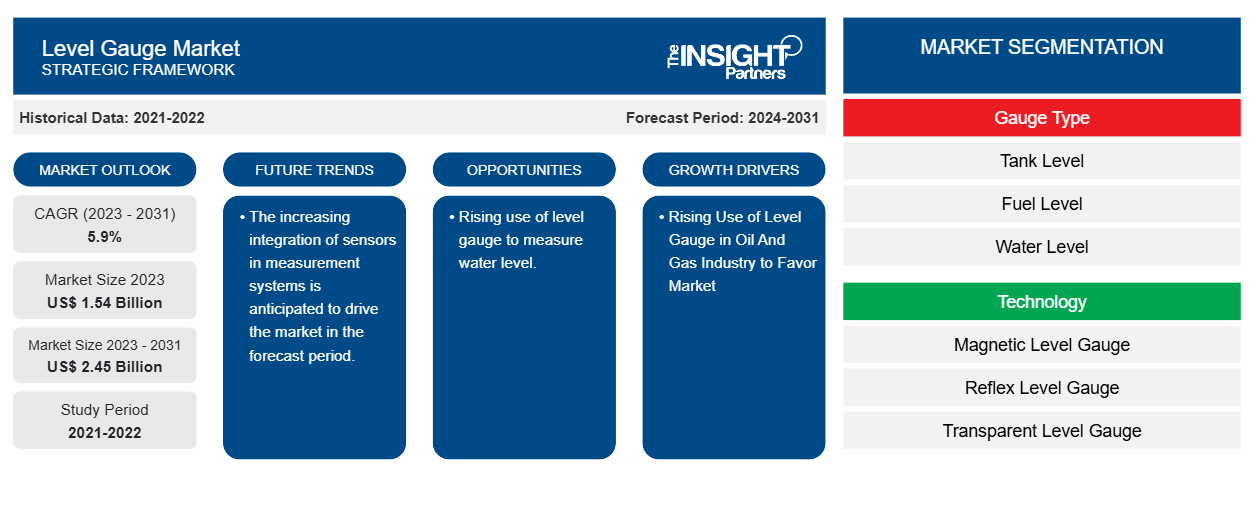
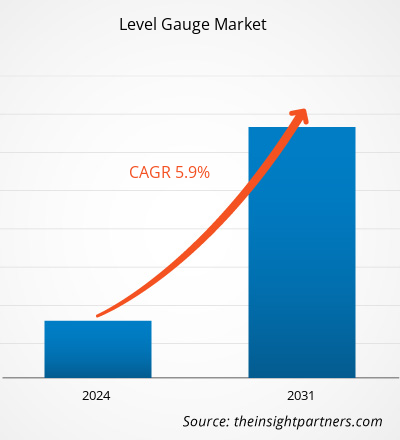
Si prevede che la dimensione del mercato degli indicatori di livello raggiungerà i 2,45 miliardi di dollari entro il 2031, rispetto agli 1,54 miliardi di dollari del 2023. Si prevede che il mercato registrerà un CAGR del 5,90% nel periodo 2023-2031. L'uso crescente degli indicatori di livello nel settore petrolifero e del gas e la crescente distribuzione di sistemi di indicatori automatici dei serbatoi rimarranno probabilmente tendenze e driver chiave nel mercato.
Analisi di mercato degli indicatori di livello
Il mercato degli indicatori sta vivendo una crescita significativa a livello globale. Questa crescita è attribuita al'uso crescente di misuratori di livello nel settore petrolifero e del gas e la crescente distribuzione di sistemi di misura automatici dei serbatoi. Inoltre, si prevede che l'uso crescente di misuratori di livello per misurare il livello dell'acqua e l'integrazione di sensori nei sistemi di misurazione guideranno la crescita del mercato nei prossimi anni.
Panoramica del mercato degli indicatori di livello
Gli indicatori di livello sono dispositivi di misurazione e rilevamento utilizzati per supervisionare il livello di un fluido in serbatoi o altri contenitori di stoccaggio. Questi strumenti sono frequentemente utilizzati in applicazioni di processo industriale per monitorare i livelli di fluido in serbatoi, fusti, recipienti a pressione e altre applicazioni simili. L'indicatore è composto da numerosi pezzi, tra cui una testa, un galleggiante, un nastro di misurazione, una staffa di ancoraggio inferiore, fili guida, gomiti, ancoraggi, giunto , staffe di supporto per tubi e tubazioni.
Personalizza questo report in base alle tue esigenze
Riceverai la personalizzazione gratuita di qualsiasi report, comprese parti di questo report, o analisi a livello nazionale, pacchetto dati Excel, oltre a usufruire di grandi offerte e sconti per start-up e università
Mercato degli indicatori di livello: approfondimenti strategici
-
Scopri le principali tendenze di mercato in questo rapporto.Questo campione GRATUITO includerà analisi di dati che spaziano dalle tendenze di mercato alle stime e alle previsioni.
Driver e opportunità del mercato degli indicatori di livello
L'uso crescente degli indicatori di livello nel settore petrolifero e del gas favorisce il mercato.
Gli indicatori di livello dell'olio vengono utilizzati per monitorare il livello di riempimento e per rilevare situazioni operative. Consentono un controllo visivo rapido e semplice e possono essere utilizzati anche per altri supporti insieme a sistemi riempiti con olio o con un flusso di olio. Il riflettore opzionale rende il livello facile da leggere, anche in condizioni di scarsa visibilità. Inoltre, i processi di misurazione manuale dei serbatoi possono essere utilizzati per serbatoi atmosferici, che sono adatti per petrolio e prodotti petrolchimici che possono essere conservati in condizioni ambientali. I metodi tradizionali comprendono l'uso di un indicatore di livello trasparente e di un metro a nastro per calcolare il livello di riempimento. Ad esempio, il metodo manuale può essere utilizzato per misurare i livelli di petrolio greggio in un serbatoio cilindrico a tetto galleggiante con un indicatore trasparente incorporato. Ciò aumenta la domanda e l'utilizzo di indicatori di livello nel settore petrolifero e del gas.
Crescente utilizzo di misuratori di livello per misurare il livello dell'acqua.
Gli indicatori di livello forniscono una rapida indicazione visiva del livello dell'acqua in un canale, una condotta o una diga. Sebbene non ci si debba basare esclusivamente su di essi quando sono disponibili dispositivi di misurazione del livello più precisi, gli indicatori di livello consentono agli operatori di misurare rapidamente il livello relativo dell'acqua e quindi procedere con altre attività. Inoltre, vengono introdotti sul mercato indicatori elettronici di misurazione del livello dell'acqua. Si tratta di un nuovo tipo di sensore di misurazione del livello dell'acqua, composto da una scheda di circuito PCB, un elettrodo comune, un elettrodo di rilevamento, resina epossidica , un guscio metallico, un cavo, ecc. Pertanto, considerando l'elevata richiesta di indicatori di livello nella misurazione del livello dell'acqua, si prevede che il mercato crescerà nei prossimi anni.
Analisi della segmentazione del rapporto di mercato degli indicatori di livello
I segmenti chiave che hanno contribuito alla derivazione dell'analisi di mercato degli indicatori di livello sono il tipo di indicatore, la tecnologia e l'utente finale.
- In base al tipo di misuratore, il mercato dei misuratori di livello è suddiviso in livello serbatoio, livello carburante, livello acqua e livello meccanico. Si prevede che il segmento del livello serbatoio detenga una quota di mercato significativa nel periodo di previsione.
- In base alla tecnologia, il mercato degli indicatori di livello è suddiviso in indicatori di livello magnetici, indicatori di livello a riflessione, indicatori di livello trasparenti, indicatori di livello tabulari e altri. Si prevede che il segmento degli indicatori di livello magnetici detenga una quota di mercato significativa nel periodo di previsione.
- In base all'utente finale, il mercato è segmentato in petrolio e gas, alimenti e bevande, prodotti chimici e petrolchimici, settore marittimo, energia e potenza e altri. Si prevede che petrolio e gas deterranno una quota di mercato significativa nel periodo di previsione.
Analisi della quota di mercato degli indicatori di livello per area geografica
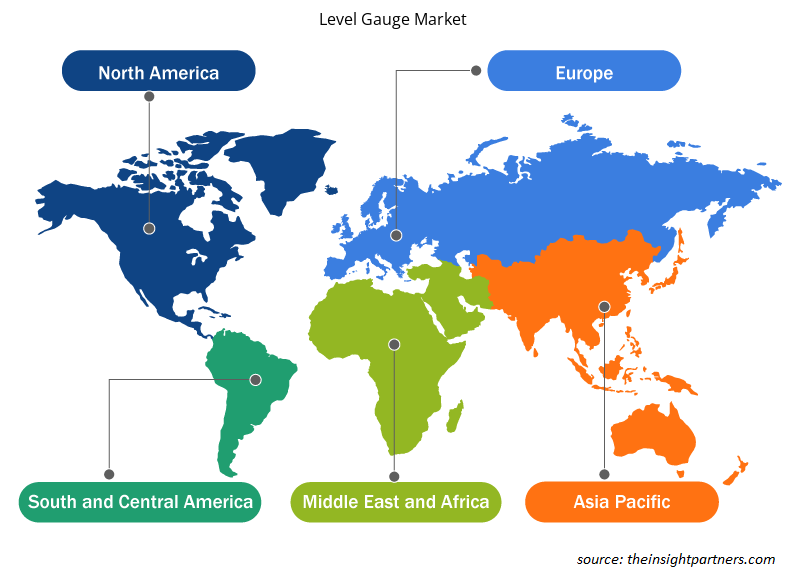
L'ambito geografico del rapporto sul mercato degli indicatori di livello è suddiviso principalmente in cinque regioni: Nord America, Asia Pacifico, Europa, Medio Oriente e Africa, Sud e Centro America.
Il Nord America ha dominato il mercato degli indicatori di livello. Il mercato degli indicatori di livello del Nord America è segmentato in Stati Uniti, Canada e Messico. Il mercato sta crescendo nella regione e la crescita è attribuita al crescente utilizzo degli indicatori di livello nel settore petrolifero e del gas e alla crescente distribuzione di sistemi di indicatori automatici dei serbatoi. Inoltre, una forte enfasi sulla ricerca e sviluppo nelle economie sviluppate di Stati Uniti e Canada sta costringendo gli operatori nordamericani a portare sul mercato soluzioni tecnologicamente avanzate. Inoltre, gli Stati Uniti hanno un gran numero di operatori del mercato degli indicatori di livello che si sono sempre più concentrati sullo sviluppo di soluzioni innovative. Tutti questi fattori contribuiscono alla crescita del mercato degli indicatori di livello nella regione.
Approfondimenti regionali sul mercato degli indicatori di livello
Le tendenze regionali e i fattori che influenzano il mercato degli indicatori di livello durante il periodo di previsione sono stati ampiamente spiegati dagli analisti di Insight Partners. Questa sezione discute anche i segmenti e la geografia del mercato degli indicatori di livello in Nord America, Europa, Asia Pacifico, Medio Oriente e Africa e Sud e Centro America.
- Ottieni i dati specifici regionali per il mercato degli indicatori di livello
Ambito del rapporto di mercato degli indicatori di livello
| Attributo del report | Dettagli |
|---|---|
| Dimensioni del mercato nel 2023 | 1,54 miliardi di dollari USA |
| Dimensioni del mercato entro il 2031 | 2,45 miliardi di dollari USA |
| CAGR globale (2023-2031) | 5,9% |
| Dati storici | 2021-2022 |
| Periodo di previsione | 2024-2031 |
| Segmenti coperti |
Per tipo di calibro
|
| Regioni e Paesi coperti |
America del Nord
|
| Leader di mercato e profili aziendali chiave |
|
Densità degli attori del mercato: comprendere il suo impatto sulle dinamiche aziendali
Il mercato del Level Gauge Market sta crescendo rapidamente, spinto dalla crescente domanda degli utenti finali dovuta a fattori quali l'evoluzione delle preferenze dei consumatori, i progressi tecnologici e una maggiore consapevolezza dei vantaggi del prodotto. Con l'aumento della domanda, le aziende stanno ampliando le loro offerte, innovando per soddisfare le esigenze dei consumatori e capitalizzando sulle tendenze emergenti, il che alimenta ulteriormente la crescita del mercato.
La densità degli operatori di mercato si riferisce alla distribuzione di aziende o società che operano in un particolare mercato o settore. Indica quanti concorrenti (operatori di mercato) sono presenti in un dato spazio di mercato in relazione alle sue dimensioni o al valore di mercato totale.
Le principali aziende che operano nel mercato degli indicatori di livello sono:
- ABB Ltd
- Barksdale Inc
- Ayvaz
- Maestro di Bin
- Tecniche JBJ Ltd.
- Società a responsabilità limitata
Disclaimer : le aziende elencate sopra non sono classificate secondo un ordine particolare.
- Ottieni la panoramica dei principali attori del mercato degli indicatori di livello
Notizie e sviluppi recenti sul mercato degli indicatori di livello
Il mercato degli indicatori di livello viene valutato raccogliendo dati qualitativi e quantitativi dopo la ricerca primaria e secondaria, che include importanti pubblicazioni aziendali, dati associativi e database. Di seguito sono elencati alcuni degli sviluppi nel mercato degli indicatori di livello:
- Con l'introduzione di BM26A-8000, KROHNE ha completato il lancio sul mercato della nuova serie BM26A di indicatori di livello magnetici (MLI) nel 2023. Sostituendo la generazione precedente, i dispositivi sono progettati in base alle specifiche esigenze del settore. (Fonte: sito Web aziendale KROHNE Messtechnik GmbH giugno 2023)
Copertura e risultati del rapporto di mercato sugli indicatori di livello
Il rapporto "Dimensioni e previsioni del mercato degli indicatori di livello (2021-2031)" fornisce un'analisi dettagliata del mercato che copre le seguenti aree:
- Dimensioni e previsioni del mercato degli indicatori di livello a livello globale, regionale e nazionale per tutti i segmenti di mercato chiave coperti dall'ambito
- Tendenze del mercato degli indicatori di livello e dinamiche di mercato come driver, vincoli e opportunità chiave
- Analisi dettagliata delle cinque forze PEST/Porter e SWOT
- Analisi di mercato degli indicatori di livello che copre le principali tendenze di mercato, il quadro globale e regionale, i principali attori, le normative e i recenti sviluppi del mercato
- Analisi del panorama industriale e della concorrenza che copre la concentrazione del mercato, l'analisi della mappa di calore, i principali attori e gli sviluppi recenti per il mercato degli indicatori di livello
- Profili aziendali dettagliati

Naveen è un professionista esperto in ricerche di mercato e consulenza con oltre 9 anni di esperienza in progetti personalizzati, sindacati e di consulenza. Attualmente Vicepresidente Associato, ha gestito con successo gli stakeholder lungo l'intera catena del valore del progetto e ha redatto oltre 100 report di ricerca e oltre 30 incarichi di consulenza. Il suo lavoro spazia tra progetti industriali e governativi, contribuendo in modo significativo al successo dei clienti e al processo decisionale basato sui dati.
Naveen ha conseguito una laurea in Ingegneria Elettronica e delle Comunicazioni presso la VTU, Karnataka, e un MBA in Marketing e Operations presso la Manipal University. È membro attivo dell'IEEE da 9 anni, partecipando a conferenze, simposi tecnici e svolgendo attività di volontariato sia a livello di sezione che regionale. Prima del suo attuale ruolo, ha lavorato come Consulente Strategico Associato presso IndustryARC e come Consulente Server Industriali presso Hewlett Packard (HP Global).
- Analisi storica (2 anni), anno base, previsione (7 anni) con CAGR
- Analisi PEST e SWOT
- Valore/volume delle dimensioni del mercato - Globale, Regionale, Nazionale
- Industria e panorama competitivo
- Set di dati Excel
Testimonianze
Il report di mercato sui sistemi SCADA di Insight Partners è completo, con preziosi spunti sulle tendenze attuali e sulle previsioni future. Il team si è dimostrato altamente professionale, reattivo e disponibile in ogni fase del progetto. Siamo molto soddisfatti e consigliamo vivamente i loro servizi.
RAN KEDEM Partner, Reali Technologies LTDsHo richiesto un report su un mercato software molto specifico e il team lo ha prodotto in pochi giorni. Le informazioni erano molto pertinenti e ben presentate. Ho quindi richiesto alcune modifiche e aggiunte al report. Il team è stato ancora una volta molto reattivo e ho ricevuto il report finale in meno di una settimana.
JEAN-HERVE JENN Presidente, Future AnalyticaAbbiamo collaborato con The Insight Partners per un importante studio di mercato e una previsione. Ci hanno fornito informazioni chiare su opportunità e rischi, che ci hanno aiutato a definire i nostri piani. La loro ricerca è stata facile da usare e basata su dati solidi. Ci ha aiutato a prendere decisioni intelligenti e consapevoli. Li consigliamo vivamente.
PIYUSH NAGPAL Vicepresidente senior, Abbaglianti globaliInsight Partners ha fornito ricerche di mercato approfondite e ben strutturate, con una solida competenza nel settore. Il loro team si è dimostrato professionale e reattivo in ogni fase. Il sito web intuitivo ha reso l'accesso ai report di settore semplice e immediato. Li consigliamo vivamente per servizi di ricerca affidabili e di alta qualità.
YUKIHIKO ADACHI Amministratore delegato, Deep Blue, LLC.Questa è la prima volta che acquisto un report di mercato da The Insight Partners. Sebbene inizialmente fossi indeciso, ho visitato il loro sito web e mi sono sentito più a mio agio nell'acquistare un report di mercato. Sono completamente soddisfatto della qualità del report e del servizio clienti. Avevo diverse domande e commenti sul report iniziale, ma dopo un paio di conversazioni via email con il loro analista credo di avere un report che posso utilizzare come input per il nostro processo di pianificazione strategica. Grazie mille per aver dedicato del tempo extra e aver reso questa esperienza positiva. Consiglierò sicuramente il vostro servizio ad altri e sarete la mia prima persona a cui rivolgermi quando avremo bisogno di ulteriori dati di mercato.
GIOVANNI SUZUKI Presidente e Amministratore Delegato, Consigliere di Amministrazione, Tecnologie BKDesidero esprimere la mia gratitudine per il supporto e la professionalità dimostrati nel rispondere alla mia richiesta di informazioni sul mercato dei dispositivi medici in vitro per malattie infettive in Nigeria. Apprezzo la vostra pazienza, la vostra guida e la vostra disponibilità a offrirmi uno sconto, che alla fine ci ha permesso di concludere l'affare. Non vedo l'ora di collaborare con The Insight Partners in futuro, grazie anche all'impressione che mi avete lasciato dopo questo primo incontro.
Dott. Chijioke AMMINISTRATORE DELEGATO DI ONYIA, PineCrest Healthcare Ltd.Motivo dell'acquisto
- Processo decisionale informato
- Comprensione delle dinamiche di mercato
- Analisi competitiva
- Analisi dei clienti
- Previsioni di mercato
- Mitigazione del rischio
- Pianificazione strategica
- Giustificazione degli investimenti
- Identificazione dei mercati emergenti
- Miglioramento delle strategie di marketing
- Aumento dell'efficienza operativa
- Allineamento alle tendenze normative


Sblocca sconti esclusivi sui report
Richiedi ora


 Ottieni un campione gratuito per - Mercato degli indicatori di livello