Strategie di mercato della perforazione a pressione gestita, principali attori, opportunità di crescita, analisi e previsioni entro il 2031
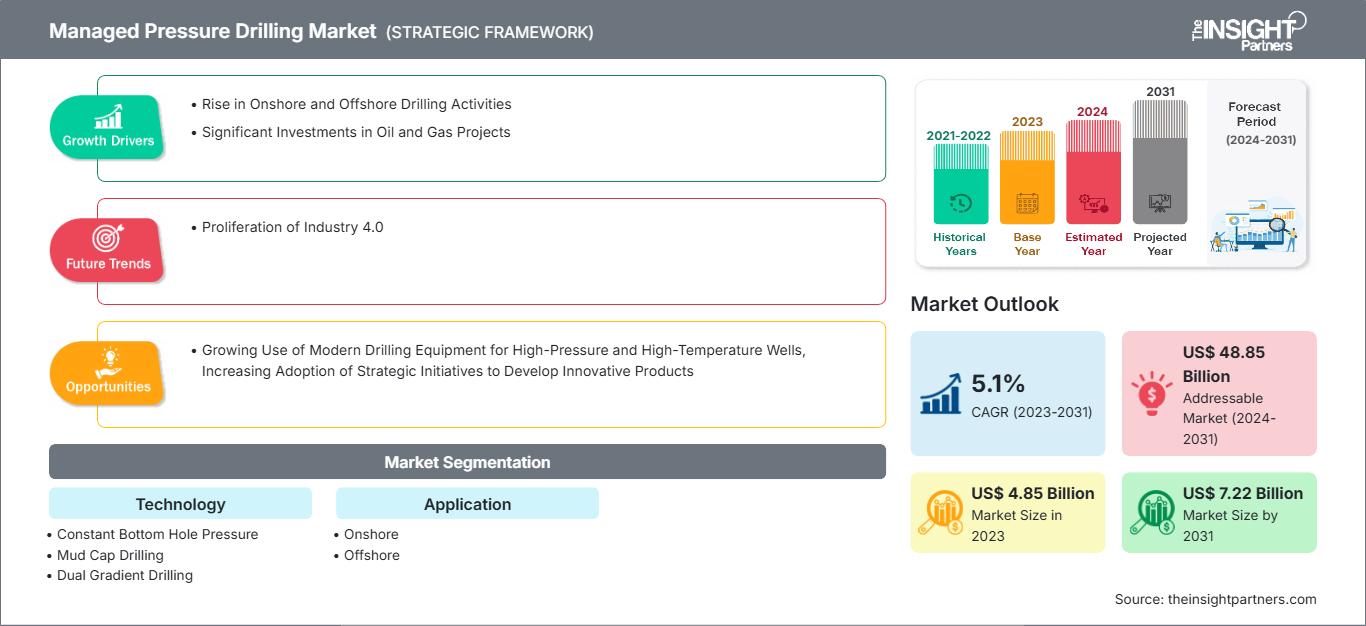
Dati storici : 2021-2022 | Anno base : 2023 | Periodo di previsione : 2024-2031Dimensioni e previsioni del mercato della perforazione a pressione gestita (2021-2031), quota globale e regionale, trend e opportunità di crescita. Copertura del rapporto di analisi: per tecnologia (pressione costante del fondo del foro, perforazione con tappo di fango, perforazione a doppio gradiente e perforazione con controllo del flusso di ritorno), applicazione (onshore e offshore) e geografia.
- Stato : Edito
- Codice del report : TIPRE00002998
- Categoria : Energia e potenza
- Numero di pagine : 152
- Formati di report disponibili :


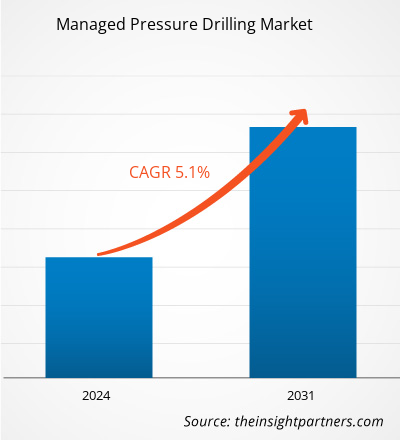
Si prevede che il mercato della perforazione a pressione controllata raggiungerà i 7,22 miliardi di dollari entro il 2031, dai 4,85 miliardi di dollari del 2023. Si stima che il mercato registrerà un CAGR del 5,1% nel periodo 2023-2031. La crescente adozione di moderne attrezzature di perforazione per pozzi ad alta pressione e ad alta temperatura porterà probabilmente nuove tendenze sul mercato nei prossimi anni.
Analisi del mercato della perforazione a pressione controllata
I principali attori dell'ecosistema del mercato della perforazione a pressione controllata includono fornitori di materie prime, produttori di attrezzature e macchinari per la perforazione a pressione controllata, fornitori di servizi e utenti finali. I fornitori di materie prime forniscono vari tipi di materiali, tra cui acciaio e alluminio, ai produttori di attrezzature e macchinari per la perforazione a pressione controllata per la produzione di perforazioni a pressione gestita integrate con diverse tecnologie. La perforazione a pressione costante di fondo foro (CBHP), la perforazione a fango (MCD), la perforazione a doppio gradiente (DGD) e la perforazione con controllo del flusso di ritorno (RFCD) sono alcune delle tecnologie per la perforazione a pressione gestita.
I fornitori di servizi offrono servizi di perforazione a pressione gestita agli utenti finali, come le aziende di estrazione petrolifera onshore e offshore. I servizi di perforazione a pressione gestita vengono adottati da molte aziende grazie all'aumento delle attività di perforazione e agli investimenti significativi in progetti petroliferi e del gas. Ad esempio, nel 2024, la Nigerian Upstream Petroleum Regulatory Commission (NUPRC) ha annunciato che alla Nigeria sono stati offerti 12 blocchi petroliferi in un nuovo ciclo di licenze. Nel 2023, il Ministero del Petrolio nigeriano ha annunciato che l'assegnazione delle licenze per sette blocchi offshore offerti in un ciclo di licenze del 2022 sarà probabilmente commissionata interamente con il ciclo che si terrà nel 2024, riservando le licenze complessive di 19 blocchi petroliferi a investitori capaci. Analogamente, nell'aprile 2023, la Oil and Natural Gas Corporation (ONGC) ha raccolto 7 miliardi di dollari di investimenti per i successivi 3-4 anni a sostegno della produzione di petrolio e gas. Alcuni produttori di attrezzature e macchinari per la perforazione a pressione controllata sono Ensign Energy Services, ADS Services LLC, Archer, Blade Energy Partners, Nabors Industries Ltd, Air Drilling Associates Inc, Halliburton Co, SLB Weatherford International Plc e NOV Inc.
Panoramica del mercato della perforazione a pressione controllata
Il processo di perforazione a pressione controllata viene utilizzato per controllare con precisione i livelli di pressione anulare lungo l'intera lunghezza del pozzo, gestendo l'ambiente di pressione a fondo foro. È una tecnica essenziale per la perforazione di pozzi con finestre strette di pressione interstiziale e gradiente di frattura. I sistemi di perforazione a pressione controllata, che spaziano dall'automatizzazione all'intelligenza, contribuiscono a migliorare la sicurezza, ridurre i costi di costruzione dei pozzi, ridurre i rischi di controllo dei pozzi e aumentare la produzione di petrolio e gas. La principale applicazione dei sistemi di perforazione a pressione controllata è nei pozzi di gas e petrolio offshore profondi. Il processo di estrazione di petrolio e gas richiede misure cautelative, poiché queste sostanze sono altamente volatili. Con l'aumento delle attività di perforazione onshore e offshore in tutto il mondo, anche la domanda di attrezzature per la perforazione a pressione controllata è in aumento. Ad esempio, nell'aprile 2023, BP ha avviato la produzione di petrolio presso la sua piattaforma Argos, situata nel Golfo del Messico. La piattaforma Argos è un impianto in acque profonde situato a circa 200 miglia a sud di New Orleans, in Louisiana.
Il mercato globale della perforazione a pressione controllata è segmentato in Nord America, Europa, Medio Oriente e Africa e America meridionale e centrale. Si prevede che il Nord America dominerà il mercato della perforazione a pressione controllata durante il periodo di previsione. Ciò è dovuto all'aumento delle attività di perforazione di petrolio e gas. US Energy Development Corporation (US Energy) mira a espandere le proprie operazioni nel prolifico bacino del Permiano, una delle aree petrolifere e del gas più produttive degli Stati Uniti. Nei prossimi 12 mesi del 2024, la società prevede di investire un capitale di 750 milioni di dollari, la maggior parte dei quali destinati a progetti nel Permiano. Inoltre, US Energy ha investito, gestito e perforato circa 4.000 pozzi in 13 stati degli Stati Uniti e in Canada. Questi crescenti investimenti nel settore petrolifero e del gas negli Stati Uniti, in Canada e in Messico alimentano la domanda di prodotti per la perforazione a pressione controllata.
Personalizza questo rapporto in base alle tue esigenze
Potrai personalizzare gratuitamente qualsiasi rapporto, comprese parti di questo rapporto, o analisi a livello di paese, pacchetto dati Excel, oltre a usufruire di grandi offerte e sconti per start-up e università
Mercato della perforazione a pressione gestita: Approfondimenti strategici
-
Ottieni le principali tendenze chiave del mercato di questo rapporto.Questo campione GRATUITO includerà l'analisi dei dati, che vanno dalle tendenze di mercato alle stime e alle previsioni.
Fattori trainanti e opportunità del mercato della perforazione a pressione gestita
Crescente utilizzo di moderne attrezzature di perforazione per pozzi ad alta pressione e alta temperatura
Molti paesi stanno perforando sempre più pozzi ad alta pressione e alta temperatura (HPHT). Perdite di circolazione, inceppamenti, torsione, contraccolpi o perdite sono alcuni dei problemi associati alle attività di perforazione. Un sistema di perforazione a pressione gestita viene solitamente utilizzato nelle attività di perforazione di pozzi HPHT, poiché l'attrezzatura aiuta a risolvere questi problemi migliorando la velocità di penetrazione, evitando contraccolpi o perdite, restringendo la finestra di passaggio, gestendo i programmi di fanghi, consentendo l'identificazione precoce del rigonfiamento del foro, garantendo un'elevata efficienza e riducendo i tempi improduttivi. Pertanto, si prevede che il crescente utilizzo di tecniche di perforazione a pressione gestita per la perforazione di pozzi ad alta pressione e alta temperatura (HPHT) offrirà significative opportunità di crescita per i fornitori di attrezzature per la perforazione a pressione gestita durante il periodo di previsione.
Crescente adozione di iniziative strategiche per lo sviluppo di prodotti innovativi
Diversi importanti attori stanno adottando strategie come fusioni, acquisizioni, partnership e collaborazioni per sviluppare attrezzature avanzate per la perforazione a pressione gestita, che si prevede creeranno ampie opportunità di crescita per il mercato della perforazione a pressione gestita durante il periodo di previsione. Ad esempio, nel settembre 2024, Seadrill, un'azienda di perforazione offshore con sede alle Bermuda, ha collaborato con Oil States International, una società di perforazione offshore con sede in Texas. Questa collaborazione mira a trasformare l'efficienza della perforazione offshore adottando la perforazione a pressione gestita (MPD) nelle sue operazioni principali. Analogamente, nel luglio 2024, Archer ha firmato un accordo con Air Drilling Associates, Inc. per acquisire la sua controllata di perforazione a pressione gestita, ADA Argentina. La filiale offre servizi MPD ai clienti Archer nel bacino di Vaca Muerta in Argentina. La perforazione a pressione gestita è un processo di perforazione adattivo che aiuta a controllare con precisione il profilo di pressione anulare lungo tutto il pozzo perforato. Inoltre, ADA possiede e gestisce tre sistemi MPD.
Analisi della segmentazione del mercato della perforazione a pressione gestita
I segmenti chiave che hanno contribuito all'analisi del mercato della perforazione a pressione gestita sono la tecnologia e l'applicazione.
- In termini di tecnologia, il mercato è suddiviso in perforazione a pressione costante di fondo foro, perforazione a fango, perforazione a doppio gradiente e perforazione con controllo del flusso di ritorno. Il segmento a pressione costante di fondo foro ha dominato il mercato nel 2023.
In base all'applicazione, il mercato è suddiviso in onshore e offshore. Il segmento onshore ha dominato il mercato nel 2023.
Analisi della quota di mercato della perforazione a pressione gestita per area geografica
Il mercato della perforazione a pressione gestita è segmentato in cinque regioni principali: Nord America, Europa, Asia Pacifico (APAC), Medio Oriente e Africa (MEA) e America meridionale e centrale. Il Nord America ha dominato il mercato nel 2023, seguito da Asia Pacifico e Medio Oriente e Africa.
Si prevede che il mercato della perforazione a pressione gestita in Medio Oriente e Africa (MEA) prolifererà grazie ai crescenti investimenti nel settore petrolifero e del gas. Il settore petrolifero e del gas contribuisce a una quota sostanziale del PIL di questi paesi. Nel 2024, Abu Dhabi National Oil Company (ADNOC) ha pianificato di investire oltre 13 miliardi di dollari tra il 2024 e il 2029 per l'espansione dell'esplorazione di gas GNL. Nel 2023, gli investimenti totali di Aramco, una società petrolifera e del gas del Medio Oriente, hanno raggiunto i 49,7 miliardi di dollari, con un aumento del 28% rispetto al 2022. Nel 2024, si prevede che gli investimenti di capitale della società raggiungeranno una cifra compresa tra 48 e 58 miliardi di dollari. L'aumento del reddito pro capite, la ripresa economica e la spesa pubblica per lo sviluppo delle infrastrutture sono tra i fattori che contribuiscono alla domanda di servizi di perforazione a pressione gestita. La produzione di petrolio e gas è uno dei settori più importanti della regione. Arabia Saudita, Libia, Iran, Emirati Arabi Uniti e Qatar sono alcuni dei paesi che hanno assistito a una crescita nel settore petrolifero. Nonostante il rallentamento della crescita economica e i sostanziali squilibri macroeconomici dovuti al calo dei prezzi del petrolio negli ultimi anni, i paesi produttori di petrolio e gas della MEA si stanno concentrando sul raggiungimento di una maggiore produzione di petrolio e gas, collaborando con aziende straniere per ampliare le loro attività in enormi giacimenti di petrolio e gas offshore e onshore.
Approfondimenti regionali sul mercato della perforazione a pressione gestita
Le tendenze regionali e i fattori che influenzano il mercato della perforazione a pressione gestita durante il periodo di previsione sono stati ampiamente spiegati dagli analisti di The Insight Partners. Questa sezione illustra anche i segmenti e la geografia del mercato della perforazione a pressione gestita in Nord America, Europa, Asia-Pacifico, Medio Oriente e Africa, America meridionale e centrale.
Ambito del rapporto di mercato sulla perforazione a pressione gestita
| Attributo del rapporto | Dettagli |
|---|---|
| Dimensioni del mercato in 2023 | US$ 4.85 Billion |
| Dimensioni del mercato per 2031 | US$ 7.22 Billion |
| CAGR globale (2023 - 2031) | 5.1% |
| Dati storici | 2021-2022 |
| Periodo di previsione | 2024-2031 |
| Segmenti coperti |
By Tecnologia
|
| Regioni e paesi coperti |
Nord America
|
| Leader di mercato e profili aziendali chiave |
|
Densità degli operatori del mercato della perforazione a pressione gestita: comprendere il suo impatto sulle dinamiche aziendali
Il mercato della perforazione a pressione gestita è in rapida crescita, trainato dalla crescente domanda degli utenti finali dovuta a fattori quali l'evoluzione delle preferenze dei consumatori, i progressi tecnologici e una maggiore consapevolezza dei vantaggi del prodotto. Con l'aumento della domanda, le aziende stanno ampliando la propria offerta, innovando per soddisfare le esigenze dei consumatori e sfruttando le tendenze emergenti, alimentando ulteriormente la crescita del mercato.
- Ottieni il Mercato della perforazione a pressione gestita Panoramica dei principali attori chiave
Notizie e sviluppi recenti sul mercato della perforazione a pressione gestita
Il mercato della perforazione a pressione gestita viene valutato raccogliendo dati qualitativi e quantitativi dopo ricerche primarie e secondarie, che includono importanti pubblicazioni aziendali, dati di associazioni e database. Di seguito sono elencati alcuni degli sviluppi chiave nel mercato della perforazione a pressione gestita:
- Nabors Industries Ltd e SLB hanno annunciato una collaborazione per ampliare l'adozione di soluzioni di perforazione automatizzate per operatori di petrolio e gas e appaltatori di perforazione. L'accordo consentirà ai clienti di integrare perfettamente le soluzioni delle due aziende. Applicazioni di automazione della perforazione e sistemi operativi di perforazione per migliorare le prestazioni e l'efficienza nella costruzione di pozzi.
(Fonte: Nabors Industries Ltd, comunicato stampa, gennaio 2024)
- Halliburton Company e Oil States Industries, Inc. hanno annunciato una collaborazione strategica che combina due set di tecnologie pluripremiate per fornire ai clienti soluzioni innovative di perforazione a pressione gestita (MPD) in acque profonde.
(Fonte: Halliburton, comunicato stampa, novembre 2023)
Copertura e risultati del rapporto di mercato sulla perforazione a pressione gestita
Il rapporto "Dimensioni e previsioni del mercato sulla perforazione a pressione gestita (2021-2031)" fornisce un'analisi dettagliata del mercato che copre le aree menzionate di seguito:
- Dimensioni e previsioni del mercato della perforazione a pressione gestita a livello globale, regionale e nazionale per tutti i principali segmenti di mercato coperti dall'ambito
- Tendenze del mercato della perforazione a pressione gestita nonché dinamiche di mercato come come fattori trainanti, vincoli e opportunità chiave
- Analisi PEST e SWOT dettagliate
- Analisi del mercato della perforazione a pressione gestita che copre le principali tendenze del mercato, il quadro globale e regionale, i principali attori, le normative e i recenti sviluppi del mercato
- Analisi del panorama industriale e della concorrenza che copre la concentrazione del mercato, l'analisi della mappa termica, gli attori principali e i recenti sviluppi per il mercato della perforazione a pressione gestita
- Profili aziendali dettagliati

Nivedita è una ricercatrice affermata con oltre 9 anni di esperienza in ricerche di mercato e consulenza aziendale. Attualmente Project Manager nel settore ICT presso The Insight Partners, vanta una profonda esperienza nella gestione e nell'esecuzione di incarichi di ricerca sindacati, personalizzati, in abbonamento e di consulenza in diversi settori tecnologici.
Con una comprovata esperienza nell'analisi basata sui dati e nella fornitura di insight fruibili, Nivedita ha contribuito in modo determinante a diversi progetti critici. Il suo lavoro include l'esecuzione end-to-end dei progetti, dalla comprensione degli obiettivi del cliente all'analisi delle tendenze di mercato, fino alla formulazione di raccomandazioni strategiche. Ha collaborato ampiamente con aziende leader nel settore ICT, aiutandole a identificare opportunità di mercato e a gestire i cambiamenti del settore.
Nivedita ha conseguito un MBA in Management presso IMS, Dehradun. Prima di entrare in The Insight Partners, ha maturato una preziosa esperienza presso MarketsandMarkets e Future Market Insights a Pune, dove ha ricoperto diversi ruoli di ricerca e ha costruito solide basi nell'analisi di settore e nel coinvolgimento dei clienti.
- Analisi storica (2 anni), anno base, previsione (7 anni) con CAGR
- Analisi PEST e SWOT
- Valore/volume delle dimensioni del mercato - Globale, Regionale, Nazionale
- Industria e panorama competitivo
- Set di dati Excel
Testimonianze
Il report di mercato sui sistemi SCADA di Insight Partners è completo, con preziosi spunti sulle tendenze attuali e sulle previsioni future. Il team si è dimostrato altamente professionale, reattivo e disponibile in ogni fase del progetto. Siamo molto soddisfatti e consigliamo vivamente i loro servizi.
RAN KEDEM Partner, Reali Technologies LTDsHo richiesto un report su un mercato software molto specifico e il team lo ha prodotto in pochi giorni. Le informazioni erano molto pertinenti e ben presentate. Ho quindi richiesto alcune modifiche e aggiunte al report. Il team è stato ancora una volta molto reattivo e ho ricevuto il report finale in meno di una settimana.
JEAN-HERVE JENN Presidente, Future AnalyticaAbbiamo collaborato con The Insight Partners per un importante studio di mercato e una previsione. Ci hanno fornito informazioni chiare su opportunità e rischi, che ci hanno aiutato a definire i nostri piani. La loro ricerca è stata facile da usare e basata su dati solidi. Ci ha aiutato a prendere decisioni intelligenti e consapevoli. Li consigliamo vivamente.
PIYUSH NAGPAL Vicepresidente senior, Abbaglianti globaliInsight Partners ha fornito ricerche di mercato approfondite e ben strutturate, con una solida competenza nel settore. Il loro team si è dimostrato professionale e reattivo in ogni fase. Il sito web intuitivo ha reso l'accesso ai report di settore semplice e immediato. Li consigliamo vivamente per servizi di ricerca affidabili e di alta qualità.
YUKIHIKO ADACHI Amministratore delegato, Deep Blue, LLC.Questa è la prima volta che acquisto un report di mercato da The Insight Partners. Sebbene inizialmente fossi indeciso, ho visitato il loro sito web e mi sono sentito più a mio agio nell'acquistare un report di mercato. Sono completamente soddisfatto della qualità del report e del servizio clienti. Avevo diverse domande e commenti sul report iniziale, ma dopo un paio di conversazioni via email con il loro analista credo di avere un report che posso utilizzare come input per il nostro processo di pianificazione strategica. Grazie mille per aver dedicato del tempo extra e aver reso questa esperienza positiva. Consiglierò sicuramente il vostro servizio ad altri e sarete la mia prima persona a cui rivolgermi quando avremo bisogno di ulteriori dati di mercato.
GIOVANNI SUZUKI Presidente e Amministratore Delegato, Consigliere di Amministrazione, Tecnologie BKDesidero esprimere la mia gratitudine per il supporto e la professionalità dimostrati nel rispondere alla mia richiesta di informazioni sul mercato dei dispositivi medici in vitro per malattie infettive in Nigeria. Apprezzo la vostra pazienza, la vostra guida e la vostra disponibilità a offrirmi uno sconto, che alla fine ci ha permesso di concludere l'affare. Non vedo l'ora di collaborare con The Insight Partners in futuro, grazie anche all'impressione che mi avete lasciato dopo questo primo incontro.
Dott. Chijioke AMMINISTRATORE DELEGATO DI ONYIA, PineCrest Healthcare Ltd.Motivo dell'acquisto
- Processo decisionale informato
- Comprensione delle dinamiche di mercato
- Analisi competitiva
- Analisi dei clienti
- Previsioni di mercato
- Mitigazione del rischio
- Pianificazione strategica
- Giustificazione degli investimenti
- Identificazione dei mercati emergenti
- Miglioramento delle strategie di marketing
- Aumento dell'efficienza operativa
- Allineamento alle tendenze normative


Sblocca sconti esclusivi sui report
Richiedi ora


 Ottieni un campione gratuito per - Mercato della perforazione a pressione gestita