Mercato della produzione continua farmaceutica, dimensioni del mercato della produzione continua farmaceutica, quota di mercato della produzione continua farmaceutica, previsioni del mercato della produzione continua farmaceutica, crescita del mercato della produzione continua farmaceutica, analisi del mercato della produzione continua farmaceutica Crescita del mercato, dimensioni, quota, tendenze, analisi dei principali attori e previsioni fino al CAGR del 10,6%
Dati storici : 2021-2022 | Anno base : 2023 | Periodo di previsione : 2024-2031Rapporto di analisi sulle dimensioni e le previsioni del mercato della produzione farmaceutica continua (2021-2031), quota globale e regionale, tendenze e opportunità di crescita. Copertura: per prodotto (sistemi integrati, sistemi semi-continui e controlli), applicazione (produzione di prodotti finali e produzione di API), utente finale (aziende di produzione su vasta scala e dipartimenti di ricerca e sviluppo) e area geografica (Nord America, Europa, Asia Pacifico, Medio Oriente e Africa e Sud e Centro America).
- Stato : Dati rilasciati
- Codice del report : TIPRE00008245
- Categoria : Scienze della vita
- Numero di pagine : 150
- Formati di report disponibili :


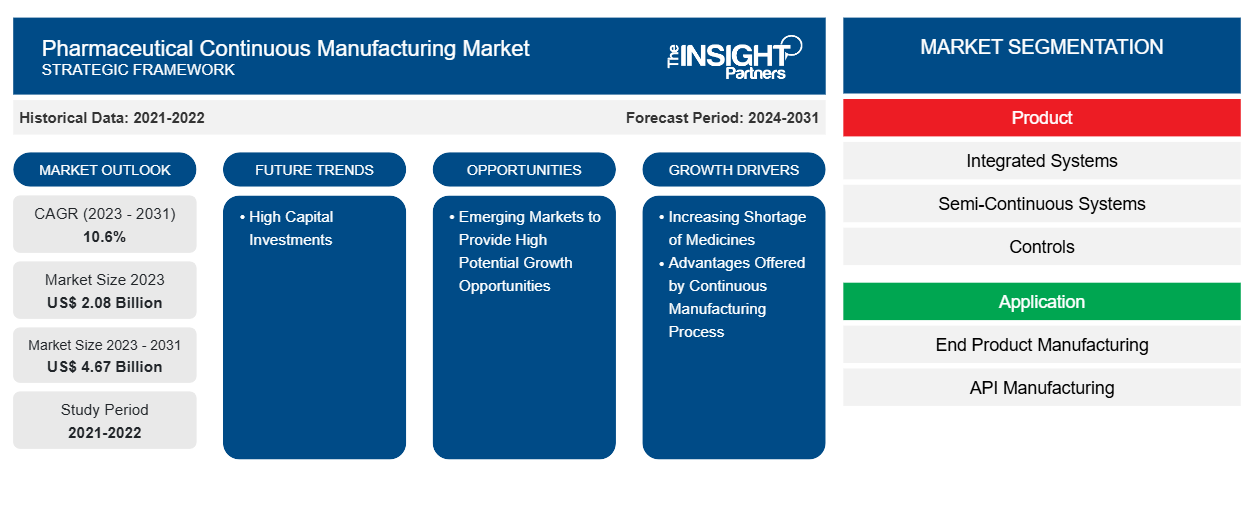
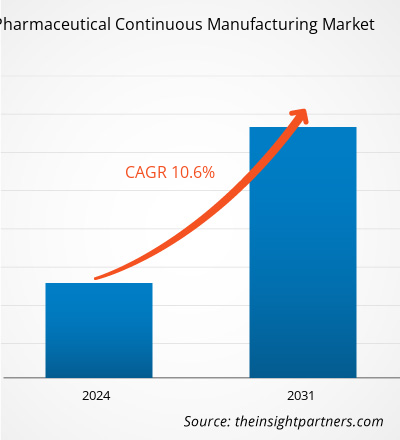
Si prevede che la dimensione del mercato della produzione farmaceutica continua raggiungerà i 4,67 miliardi di dollari entro il 2031, rispetto ai 2,08 miliardi di dollari del 2023. Si prevede che il mercato registrerà un CAGR del 10,6% nel periodo 2023-2031. Il crescente supporto da parte degli enti normativi, la crescente adozione da parte di produttori interni e a contratto per le procedure di produzione di farmaci e i vantaggi associati alla produzione continua rimarranno probabilmente tendenze chiave nel mercato.
Analisi del mercato della produzione farmaceutica continua
Le aziende farmaceutiche investono costantemente in tecnologie di produzione innovative per ottenere un vantaggio competitivo e rimanere all'avanguardia nel mercato, guidando così il mercato della produzione continua. La produzione continua consente alle aziende farmaceutiche di avere un maggiore controllo sul loro processo di produzione, il che aiuta a migliorare la qualità e la coerenza del prodotto finale, riducendo così deviazioni, sprechi e risparmiando tempo di rilavorazione e costi di richiamo. La produzione farmaceutica continua può migliorare la qualità del prodotto finale, migliorare il controllo del processo e consentire test di rilascio in tempo reale. L'Agenzia europea per i medicinali (EMA) e la Food and Drug Administration (FDA) degli Stati Uniti sono gli enti normativi che stanno sempre più favorendo l'uso della produzione continua nell'industria farmaceutica. Inoltre, la produzione continua è diventata più attraente e pratica nell'industria farmaceutica grazie al monitoraggio, al controllo e all'ottimizzazione dei processi migliorati forniti tramite i mezzi di automazione, controllo del sistema, analisi dei dati e tecnologia di analisi dei processi (PAT), che guida il mercato.
Panoramica del mercato della produzione farmaceutica continua
Come soluzione praticabile per minimizzare la pressione e ridurre i tempi e i costi di sviluppo dei farmaci, mantenendo al contempo la qualità e la fornitura del prodotto finale, la produzione continua è ampiamente utilizzata nell'industria farmaceutica. Pertanto, grazie a tali vantaggi, il mercato della produzione continua sta assistendo a una crescita sana. Inoltre, le crescenti iniziative per promuovere l'uso di sistemi di produzione farmaceutica continua da parte della Food and Drug Administration (FDA) e i numerosi vantaggi dei sistemi di produzione continua rispetto alla produzione in lotti sono alcuni dei principali fattori che stanno guidando la crescita del mercato. Tuttavia, d'altro canto, l'implementazione ad alto costo dei sistemi di produzione farmaceutica continua probabilmente ostacolerà la crescita del mercato.
Personalizza questo report in base alle tue esigenze
Riceverai la personalizzazione gratuita di qualsiasi report, comprese parti di questo report, o analisi a livello nazionale, pacchetto dati Excel, oltre a usufruire di grandi offerte e sconti per start-up e università
Mercato della produzione farmaceutica continua: approfondimenti strategici
-
Scopri le principali tendenze di mercato in questo rapporto.Questo campione GRATUITO includerà analisi di dati che spaziano dalle tendenze di mercato alle stime e alle previsioni.
Driver e opportunità del mercato della produzione farmaceutica continua
Vantaggi offerti dal processo di produzione continuo per favorire il mercato
La produzione farmaceutica continua sta prendendo piede e sta acquisendo importanza a causa della crescente domanda di prodotti biologici e alternative di produzione flessibili. Le aziende che stanno passando alle procedure di produzione continua stanno ottenendo rapidamente le approvazioni dalla FDA. Il processo di produzione continua offre molti vantaggi che includono efficienza temporale, riduzione del fabbisogno energetico e degli sprechi e aumento della produttività. Inoltre, il processo riduce il rischio di errore umano a causa del coinvolgimento di poche persone nel processo di produzione. Pertanto, a causa dei vantaggi sopra menzionati offerti dalla produzione continua, si prevede che il mercato crescerà nei prossimi anni.
I mercati emergenti offrono opportunità di crescita ad alto potenziale
Stanno emergendo interessanti sedi di outsourcing per le industrie biofarmaceutiche in regioni come Asia Pacifico e Sud e Centro. Cina e India offrono bassi costi di produzione e operativi che sono fattori significativi per guidare la crescita del mercato nella regione Asia Pacifico. Sia la Cina che l'India indicano prospettive future positive per il mercato a causa della recente crescita dell'industria biofarmaceutica in entrambi i paesi. A gennaio 2020, STA Pharmaceutical Co., Ltd., una sussidiaria di WuXi AppTec ha aperto un nuovo stabilimento di produzione di principi attivi farmaceutici (API) oligonucleotidici su larga scala in Cina. Pertanto, è probabile che i mercati emergenti adatti all'industria biofarmaceutica agiscano come generatori di crescita e fatturato ad alto potenziale nel mercato della produzione farmaceutica continua.biopharmaceutical industry in both countries. In January 2020, STA Pharmaceutical Co., Ltd., – a subsidiary of WuXi AppTec opened a new large-scale oligonucleotide active pharmaceutical ingredient (API) manufacturing facility in China. Thus, the emerging markets suitable for biopharmaceutical industry are likely to act as high potential growth and revenue generators in the pharmaceutical continuous manufacturing market.
Analisi della segmentazione del rapporto di mercato sulla produzione farmaceutica continua
I segmenti chiave che hanno contribuito alla derivazione dell'analisi del mercato della produzione farmaceutica continua sono il prodotto, l'applicazione e l'utente finale.
- In base al prodotto, il mercato della produzione farmaceutica continua è segmentato in sistemi integrati, sistemi semi-continui e controlli. Il segmento dei sistemi integrati ha detenuto la quota di mercato più grande nel 2023 e si prevede che registrerà il CAGR più elevato durante il periodo di previsione.
- Per applicazione, il mercato è diviso in produzione di prodotti finali e produzione di API . Il segmento di produzione di prodotti finali è ulteriormente suddiviso in produzione di dosaggio solido e produzione di dosaggio liquido. Il segmento di produzione di prodotti finali ha detenuto la quota maggiore del mercato nel 2023. Tuttavia, si prevede che il segmento di produzione di API registrerà il CAGR più elevato nel periodo 2021-2031.
- In base all'utente finale, il mercato della produzione farmaceutica continua è suddiviso in aziende manifatturiere su vasta scala e dipartimenti di R&S. Il segmento della produzione su vasta scala ha detenuto la quota di mercato più grande nel 2023 e si prevede che registrerà il CAGR più elevato durante il periodo di previsione.
Analisi della quota di mercato della produzione farmaceutica continua per area geografica
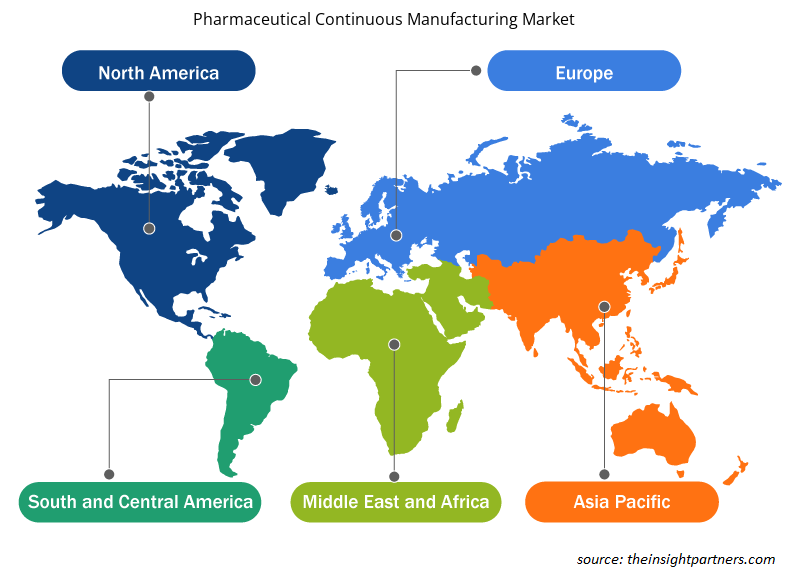
L'ambito geografico del rapporto sul mercato della produzione farmaceutica continua è suddiviso principalmente in cinque regioni: Nord America, Asia Pacifico, Europa, Medio Oriente e Africa, Sud e Centro America.
Il Nord America ha dominato il mercato della produzione farmaceutica continua. I fattori che hanno portato alla crescita del mercato della produzione farmaceutica continua in Nord America sono dovuti al crescente supporto della FDA per la promozione dell'uso della produzione continua rispetto alla produzione in lotti, alla crescente carenza di farmaci nella regione e alla presenza di giganti farmaceutici che possono permettersi i grandi investimenti iniziali per impostare processi di produzione continua. La maggior parte delle industrie negli Stati Uniti ha adottato processi di produzione continua da decenni. Gli Stati Uniti detengono una posizione dominante nel Nord America a causa di fattori come il crescente numero di attori farmaceutici che adottano procedure di produzione continua, i progressi nel campo delle tecnologie di produzione e l'efficienza offerta da queste configurazioni per aumentare i volumi di produzione. Inoltre, sono state intraprese varie iniziative dalla FDA statunitense per promuovere la produzione continua negli Stati Uniti all'interno delle industrie farmaceutiche.
Approfondimenti regionali sul mercato della produzione farmaceutica continua
Le tendenze regionali e i fattori che influenzano il Pharmaceutical Continuous Manufacturing Market durante il periodo di previsione sono stati ampiamente spiegati dagli analisti di Insight Partners. Questa sezione discute anche i segmenti e la geografia del Pharmaceutical Continuous Manufacturing Market in Nord America, Europa, Asia Pacifico, Medio Oriente e Africa e Sud e Centro America.
- Ottieni i dati specifici regionali per il mercato della produzione farmaceutica continua
Ambito del rapporto sul mercato della produzione farmaceutica continua
| Attributo del report | Dettagli |
|---|---|
| Dimensioni del mercato nel 2023 | 2,08 miliardi di dollari USA |
| Dimensioni del mercato entro il 2031 | 4,67 miliardi di dollari USA |
| CAGR globale (2023-2031) | 10,6% |
| Dati storici | 2021-2022 |
| Periodo di previsione | 2024-2031 |
| Segmenti coperti |
Per Prodotto
|
| Regioni e Paesi coperti |
America del Nord
|
| Leader di mercato e profili aziendali chiave |
|
Densità degli attori del mercato: comprendere il suo impatto sulle dinamiche aziendali
Il mercato del Pharmaceutical Continuous Manufacturing Market sta crescendo rapidamente, spinto dalla crescente domanda degli utenti finali dovuta a fattori quali l'evoluzione delle preferenze dei consumatori, i progressi tecnologici e una maggiore consapevolezza dei benefici del prodotto. Con l'aumento della domanda, le aziende stanno ampliando le loro offerte, innovando per soddisfare le esigenze dei consumatori e capitalizzando sulle tendenze emergenti, il che alimenta ulteriormente la crescita del mercato.
La densità degli operatori di mercato si riferisce alla distribuzione di aziende o società che operano in un particolare mercato o settore. Indica quanti concorrenti (operatori di mercato) sono presenti in un dato spazio di mercato in relazione alle sue dimensioni o al valore di mercato totale.
Le principali aziende che operano nel mercato della produzione farmaceutica continua sono:
- Gruppo GEA
- Coperion GmbH
- Azienda Gericke
- Azienda Glatt GmbH
- Gruppo Hosokawa Micron
- Azienda Munson Machinery Co. Inc.
Disclaimer : le aziende elencate sopra non sono classificate secondo un ordine particolare.
- Ottieni una panoramica dei principali attori del mercato della produzione farmaceutica continua
Notizie e sviluppi recenti sul mercato della produzione farmaceutica continua
Il mercato della produzione continua farmaceutica viene valutato raccogliendo dati qualitativi e quantitativi post-ricerca primaria e secondaria, che includono importanti pubblicazioni aziendali, dati di associazioni e database. Di seguito sono elencati alcuni degli sviluppi nel mercato della produzione continua farmaceutica:
- L'organizzazione di sviluppo e produzione a contratto (CDMO) con sede in Corea del Sud SK Bioscience ha avviato i lavori per l'ampliamento di circa 4.200 m2 del suo stabilimento di produzione di vaccini L House ad Andong, Gyeongsangbuk-do, Corea del Sud, che fungerà da base di produzione per il candidato vaccino coniugato antipneumococcico GBP410, sviluppato congiuntamente da SK Bioscience e Sanofi, che stanno co-investendo nell'ampliamento. (SK Bioscience, comunicato stampa, marzo 2024)
- Phlow Corp., una società di pubblica utilità per medicinali essenziali con sede negli Stati Uniti, ha annunciato alleanze strategiche con il Medicines for All Institute della Virginia Commonwealth University (VCU) e con AMPAC Fine Chemicals per fornire servizi di ricerca e sviluppo (R&S) di produzione continua a contratto per prodotti farmaceutici a piccole molecole. Oltre alle sue solide e crescenti capacità interne, la rete di partner strategici consolidati, innovativi ed esperti di Phlow fornirà soluzioni di produzione avanzata di alta qualità con sede negli Stati Uniti per principi attivi farmaceutici (API) a piccole molecole e materiali di partenza registrati (RSM) in tutte le fasi di sviluppo utilizzando tecnologie all'avanguardia e approfondimenti unici del settore. (Phlow Corp., News, marzo 2022)
Copertura e risultati del rapporto sul mercato della produzione farmaceutica continua
Il rapporto "Dimensioni e previsioni del mercato della produzione continua farmaceutica (2021-2031)" fornisce un'analisi dettagliata del mercato che copre le seguenti aree:
- Dimensioni e previsioni del mercato della produzione farmaceutica continua a livello globale, regionale e nazionale per tutti i segmenti di mercato chiave coperti dall'ambito
- Tendenze del mercato della produzione farmaceutica continua e dinamiche di mercato come fattori trainanti, limitazioni e opportunità chiave
- Analisi PEST e SWOT dettagliate
- Analisi del mercato della produzione farmaceutica continua che copre le principali tendenze del mercato, il quadro globale e regionale, i principali attori, le normative e i recenti sviluppi del mercato
- Analisi del panorama industriale e della concorrenza che copre la concentrazione del mercato, l'analisi della mappa di calore, i principali attori e gli sviluppi recenti per il mercato della produzione farmaceutica continua
- Profili aziendali dettagliati

Mrinal è un'analista di ricerca esperta con oltre 8 anni di esperienza nella consulenza e nell'intelligence di mercato nel settore delle scienze biologiche. Grazie a una mentalità strategica e a un costante impegno verso l'eccellenza, ha maturato una profonda competenza nelle previsioni farmaceutiche, nella valutazione delle opportunità di mercato e nello sviluppo di benchmark di settore. Il suo lavoro è incentrato sulla fornitura di insight fruibili che consentono ai clienti di prendere decisioni strategiche consapevoli.
Il punto di forza di Mrinal risiede nella capacità di tradurre complessi set di dati quantitativi in business intelligence significative. Il suo acume analitico è fondamentale per definire strategie di go-to-market (GTM) e individuare opportunità di crescita nei settori farmaceutico e dei dispositivi medici. In qualità di consulente di fiducia, si concentra costantemente sulla semplificazione dei processi di flusso di lavoro e sulla definizione di best practice, promuovendo così l'innovazione e l'efficienza operativa per i suoi clienti.
- Analisi storica (2 anni), anno base, previsione (7 anni) con CAGR
- Analisi PEST e SWOT
- Valore/volume delle dimensioni del mercato - Globale, Regionale, Nazionale
- Industria e panorama competitivo
- Set di dati Excel
Testimonianze
Il report di mercato sui sistemi SCADA di Insight Partners è completo, con preziosi spunti sulle tendenze attuali e sulle previsioni future. Il team si è dimostrato altamente professionale, reattivo e disponibile in ogni fase del progetto. Siamo molto soddisfatti e consigliamo vivamente i loro servizi.
RAN KEDEM Partner, Reali Technologies LTDsHo richiesto un report su un mercato software molto specifico e il team lo ha prodotto in pochi giorni. Le informazioni erano molto pertinenti e ben presentate. Ho quindi richiesto alcune modifiche e aggiunte al report. Il team è stato ancora una volta molto reattivo e ho ricevuto il report finale in meno di una settimana.
JEAN-HERVE JENN Presidente, Future AnalyticaAbbiamo collaborato con The Insight Partners per un importante studio di mercato e una previsione. Ci hanno fornito informazioni chiare su opportunità e rischi, che ci hanno aiutato a definire i nostri piani. La loro ricerca è stata facile da usare e basata su dati solidi. Ci ha aiutato a prendere decisioni intelligenti e consapevoli. Li consigliamo vivamente.
PIYUSH NAGPAL Vicepresidente senior, Abbaglianti globaliInsight Partners ha fornito ricerche di mercato approfondite e ben strutturate, con una solida competenza nel settore. Il loro team si è dimostrato professionale e reattivo in ogni fase. Il sito web intuitivo ha reso l'accesso ai report di settore semplice e immediato. Li consigliamo vivamente per servizi di ricerca affidabili e di alta qualità.
YUKIHIKO ADACHI Amministratore delegato, Deep Blue, LLC.Questa è la prima volta che acquisto un report di mercato da The Insight Partners. Sebbene inizialmente fossi indeciso, ho visitato il loro sito web e mi sono sentito più a mio agio nell'acquistare un report di mercato. Sono completamente soddisfatto della qualità del report e del servizio clienti. Avevo diverse domande e commenti sul report iniziale, ma dopo un paio di conversazioni via email con il loro analista credo di avere un report che posso utilizzare come input per il nostro processo di pianificazione strategica. Grazie mille per aver dedicato del tempo extra e aver reso questa esperienza positiva. Consiglierò sicuramente il vostro servizio ad altri e sarete la mia prima persona a cui rivolgermi quando avremo bisogno di ulteriori dati di mercato.
GIOVANNI SUZUKI Presidente e Amministratore Delegato, Consigliere di Amministrazione, Tecnologie BKDesidero esprimere la mia gratitudine per il supporto e la professionalità dimostrati nel rispondere alla mia richiesta di informazioni sul mercato dei dispositivi medici in vitro per malattie infettive in Nigeria. Apprezzo la vostra pazienza, la vostra guida e la vostra disponibilità a offrirmi uno sconto, che alla fine ci ha permesso di concludere l'affare. Non vedo l'ora di collaborare con The Insight Partners in futuro, grazie anche all'impressione che mi avete lasciato dopo questo primo incontro.
Dott. Chijioke AMMINISTRATORE DELEGATO DI ONYIA, PineCrest Healthcare Ltd.Motivo dell'acquisto
- Processo decisionale informato
- Comprensione delle dinamiche di mercato
- Analisi competitiva
- Analisi dei clienti
- Previsioni di mercato
- Mitigazione del rischio
- Pianificazione strategica
- Giustificazione degli investimenti
- Identificazione dei mercati emergenti
- Miglioramento delle strategie di marketing
- Aumento dell'efficienza operativa
- Allineamento alle tendenze normative


Sblocca sconti esclusivi sui report
Richiedi ora


 Ottieni un campione gratuito per - Mercato della produzione farmaceutica continua