
Rapporto sull'analisi delle dimensioni e delle quote del mercato del software POS | Previsioni 2031
Dimensioni e previsioni del mercato del software POS (2021-2031), quota globale e regionale, trend e opportunità di crescita. Copertura del rapporto di analisi: per componente (software e servizi); tipo di distribuzione (on-premise e cloud); applicazione (monitoraggio dell'inventario, gestione degli acquisti, report sulle vendite, coinvolgimento dei clienti e altri); utente finale (vendita al dettaglio, ospitalità, media e intrattenimento, sanità e altri) e area geografica.
- Stato : Dati rilasciati
- Codice del report : TIPRE00007898
- Categoria : Tecnologia, media e telecomunicazioni
- Numero di pagine : 150
- Formati di report disponibili :


- Data dell'ultimo aggiornamento : June 11, 2024

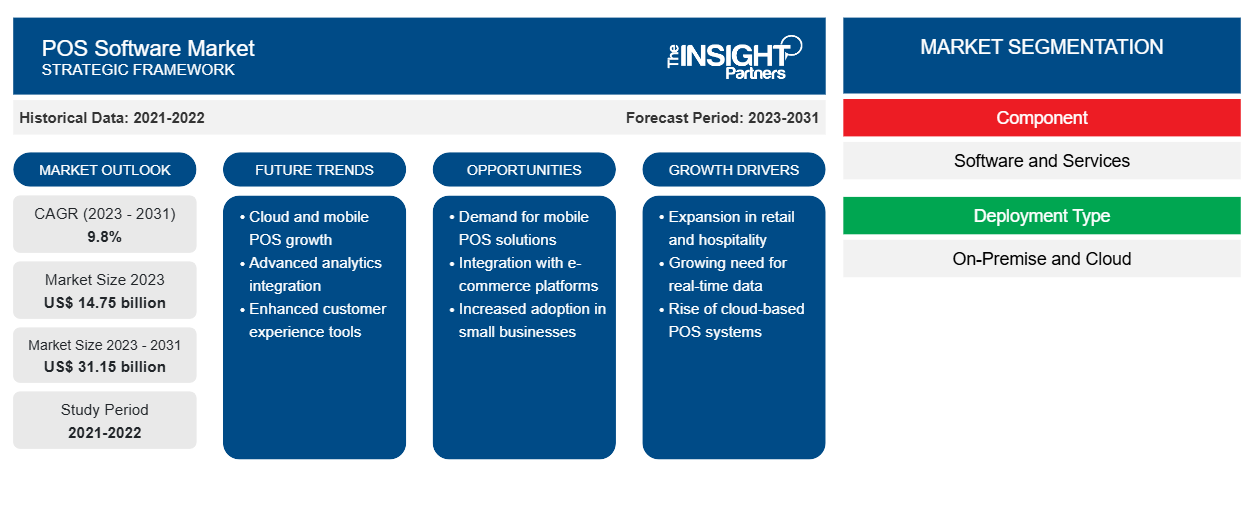
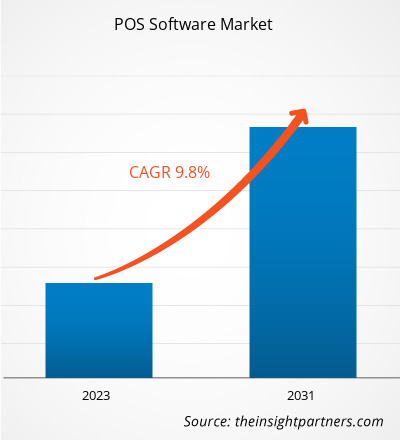
Si prevede che la dimensione del mercato del software POS raggiungerà i 31,15 miliardi di dollari entro il 2031, rispetto ai 14,75 miliardi di dollari del 2023. Si prevede che il mercato registrerà un CAGR del 9,8% dal 2023 al 2031. È probabile che l'uso crescente dei servizi di cloud computing rimanga una tendenza chiave del mercato del software POS.
Analisi di mercato del software POS
La necessità di condurre transazioni senza contanti, tracciare i dati di vendita e inventario e sfruttare l'analisi per ottimizzare la strategia di vendita in catene di vendita al dettaglio, ristoranti, hotel, farmacie, officine e altri luoghi ha spinto la domanda di software per punti vendita (POS). Si prevede che l'utilizzo di software POS aumenterà in una varietà di settori a causa della crescente domanda di funzionalità avanzate tra cui gestione dei dati dei clienti, tracciamento dell'inventario, monitoraggio delle vendite, analisi della gestione dei dipendenti e reporting. Inoltre, la crescente domanda di software per punti vendita mobili basati su cloud potrebbe essere attribuita alla crescente accettazione di soluzioni basate su cloud.
Panoramica del mercato del software POS
Il software per punti vendita (POS) è un'applicazione specializzata che le aziende utilizzano per condurre transazioni presso il punto vendita, in genere in contesti di vendita al dettaglio. Tenendo traccia delle vendite, controllando l'inventario e gestendo i pagamenti, velocizza il processo di pagamento. Per garantire l'accuratezza, il software per punti vendita si interfaccia frequentemente con hardware quali scanner per codici a barre , registratori di cassa e lettori di carte. Inoltre, dispone di strumenti per gestire le informazioni dei clienti, creare report di vendita e valutare.
Personalizza questo report in base alle tue esigenze
Riceverai la personalizzazione gratuita di qualsiasi report, comprese parti di questo report, o analisi a livello nazionale, pacchetto dati Excel, oltre a usufruire di grandi offerte e sconti per start-up e università
Mercato del software POS: approfondimenti strategici
-
Scopri le principali tendenze di mercato in questo rapporto.Questo campione GRATUITO includerà analisi di dati che spaziano dalle tendenze di mercato alle stime e alle previsioni.
Driver e opportunità del mercato del software POS
Crescita del settore dell'e-commerce
Con la crescente prevalenza dello shopping online e omnicanale, le aziende necessitano di software per punti vendita (POS) in grado di collegare senza soluzione di continuità i loro canali di vendita offline e online. Ciò determina la domanda di sistemi per punti vendita (POS) che includano funzioni come il controllo dell'inventario, l'evasione degli ordini e la gestione delle relazioni con i clienti (CRM), che sta alimentando la crescita del mercato dei software per POS.
Crescente domanda di Business Intelligence e Data Analytics
Il software Point-of-sale (POS) sta diventando uno strumento sempre più popolare utilizzato dalle aziende per raccogliere ed esaminare dati su vendite, comportamento dei clienti, inventario e performance dei dipendenti. Tecnologie di analisi e reporting sofisticate possono aiutare le aziende a prendere decisioni basate sui dati, aumentare la soddisfazione dei clienti e ridurre le procedure. Pertanto, si prevede che tali vantaggi del software POS stimoleranno la crescita del mercato nel periodo previsto.
Analisi della segmentazione del rapporto di mercato del software POS
I segmenti chiave che hanno contribuito alla derivazione dell'analisi di mercato del software POS sono i componenti (software e servizi); il tipo di distribuzione (on-premise e cloud); l'applicazione e l'utente finale
- In base ai componenti, il mercato del software POS è diviso in software e servizi. Il segmento software ha detenuto una quota di mercato maggiore nel 2023.
- In base al tipo di distribuzione, il mercato è diviso in on-premise e cloud. Il segmento on-premise ha detenuto una quota di mercato maggiore nel 2023.
- In base all'applicazione, il mercato è segmentato in monitoraggio dell'inventario, gestione degli acquisti, reporting delle vendite, coinvolgimento dei clienti e altri. Il segmento del monitoraggio dell'inventario ha detenuto una quota di mercato maggiore nel 2023.
- In base all'utente finale, il mercato è segmentato in vendita al dettaglio, ospitalità, media e intrattenimento, assistenza sanitaria e altri. Il segmento della vendita al dettaglio ha detenuto la quota maggiore del mercato nel 2023.
Analisi della quota di mercato del software POS per area geografica
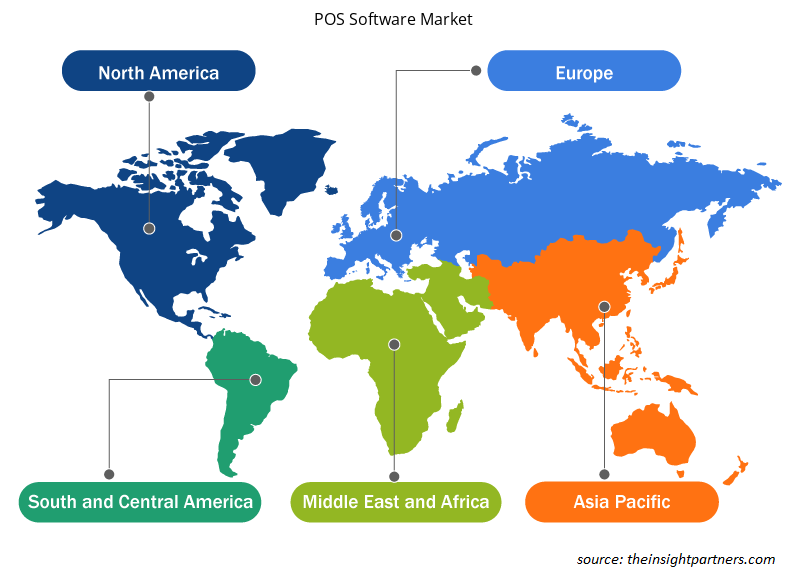
L'ambito geografico del rapporto sul mercato del software POS è principalmente suddiviso in cinque regioni:Nord America, Asia Pacifico, Europa, Medio Oriente e Africa e Sud America/Sud e Centro America.
In termini di fatturato, il Nord America ha rappresentato la quota di mercato più grande del software POS. Il mercato in questa regione è segmentato in Stati Uniti, Canada e Messico. La regione ha un certo numero di noti produttori di software POS, così come un'elevata domanda di software POS integrato complesso. Inoltre, il settore della vendita al dettaglio sta assistendo a una crescita enorme nella regione, alimentando la crescita del mercato. Inoltre, si prevede che il settore sanitario statunitense crescerà al ritmo più rapido a causa della necessità di aggiornare le strutture ospedaliere relative ad assicurazione, pagamento e gestione dei pazienti.
Notizie di mercato e sviluppi recenti del software POS
Il mercato del software POS viene valutato raccogliendo dati qualitativi e quantitativi dopo la ricerca primaria e secondaria, che include importanti pubblicazioni aziendali, dati associativi e database. Di seguito è riportato un elenco degli sviluppi nel mercato dei disturbi del linguaggio e della parola e delle strategie:
- US Bank, leader del settore nei servizi di pagamento, ha annunciato il lancio di Avvance, una soluzione di prestito integrata e multicanale per punti vendita. Avvance offre alle aziende la possibilità di offrire finanziamenti ai consumatori durante il pagamento con una rapida richiesta e una decisione immediata. (Fonte: Elavon Inc., Comunicato stampa, 2023)
- NCR Corporation ha presentato NCR Aloha Cloud, una soluzione point of sale (POS) basata su cloud che offre funzionalità sufficientemente solide da essere immesse sul mercato con il marchio leader del settore Aloha. Aloha Cloud offre un'interfaccia utente (UI) rinnovata, il dispositivo portatile più piccolo sul mercato e un'elaborazione dei pagamenti senza interruzioni con finanziamento dei depositi il giorno successivo, dando agli operatori più tempo per concentrarsi sulla gestione del loro ristorante. (Comunicato stampa, 2022)
Approfondimenti regionali sul mercato del software POS
Le tendenze regionali e i fattori che influenzano il mercato del software POS durante il periodo di previsione sono stati ampiamente spiegati dagli analisti di Insight Partners. Questa sezione discute anche i segmenti del mercato del software POS e la geografia in Nord America, Europa, Asia Pacifico, Medio Oriente e Africa e America meridionale e centrale.
- Ottieni i dati specifici regionali per il mercato del software POS
Ambito del rapporto di mercato del software POS
| Attributo del report | Dettagli |
|---|---|
| Dimensioni del mercato nel 2023 | 14,75 miliardi di dollari USA |
| Dimensioni del mercato entro il 2031 | 31,15 miliardi di dollari USA |
| CAGR globale (2023-2031) | 9,8% |
| Dati storici | 2021-2022 |
| Periodo di previsione | 2023-2031 |
| Segmenti coperti |
Per componente
|
| Regioni e Paesi coperti |
America del Nord
|
| Leader di mercato e profili aziendali chiave |
|
Densità dei player del mercato del software POS: comprendere il suo impatto sulle dinamiche aziendali
Il mercato del software POS sta crescendo rapidamente, spinto dalla crescente domanda degli utenti finali dovuta a fattori quali l'evoluzione delle preferenze dei consumatori, i progressi tecnologici e una maggiore consapevolezza dei vantaggi del prodotto. Con l'aumento della domanda, le aziende stanno ampliando le loro offerte, innovando per soddisfare le esigenze dei consumatori e capitalizzando sulle tendenze emergenti, il che alimenta ulteriormente la crescita del mercato.
La densità degli operatori di mercato si riferisce alla distribuzione di aziende o società che operano in un particolare mercato o settore. Indica quanti concorrenti (operatori di mercato) sono presenti in un dato spazio di mercato in relazione alle sue dimensioni o al valore di mercato totale.
Le principali aziende che operano nel mercato del software POS sono:
- Infor Inc
- Intuit, Inc.
- Velocità della luce
- Società Oracle
- Rete di trifoglio, LLC
- Società NCR
Disclaimer : le aziende elencate sopra non sono classificate secondo un ordine particolare.
- Ottieni una panoramica dei principali attori del mercato dei software POS
Copertura e risultati del rapporto sul mercato del software POS
Il rapporto “POS Software Market Size and Forecast (2023–2031)” fornisce un’analisi dettagliata del mercato che copre le seguenti aree:
- Dimensioni del mercato e previsioni a livello globale, regionale e nazionale per tutti i segmenti di mercato chiave coperti dall'ambito
- Dinamiche di mercato come fattori trainanti, vincoli e opportunità chiave
- Principali tendenze future
- Analisi dettagliata delle cinque forze PEST/Porter e SWOT
- Analisi di mercato globale e regionale che copre le principali tendenze di mercato, i principali attori, le normative e gli sviluppi recenti del mercato
- Analisi del panorama industriale e della concorrenza che copre la concentrazione del mercato, l'analisi della mappa di calore, i principali attori e gli sviluppi recenti
- Profili aziendali dettagliati

Ankita è una dinamica professionista della ricerca di mercato e della consulenza con oltre 8 anni di esperienza nei settori della tecnologia, dei media, dell'ICT, dell'elettronica e dei semiconduttori. Ha guidato e portato a termine con successo oltre 100 incarichi di consulenza e ricerca per clienti globali come Microsoft, Oracle, NEC Corporation, SAP, KPMG ed Expeditors International. Le sue competenze principali includono la valutazione del mercato, l'analisi dei dati, le previsioni, la formulazione di strategie, l'intelligence competitiva e la redazione di report.
Ankita è esperta nella gestione di cicli di progetto completi, dalla progettazione di proposte pre-vendita e discussioni con i clienti fino alla fornitura di insight fruibili post-vendita. È esperta nella gestione di team interfunzionali, nella strutturazione di moduli di ricerca complessi e nell'allineamento delle soluzioni agli obiettivi aziendali specifici del cliente. Le sue eccellenti capacità di comunicazione, leadership e presentazione le hanno permesso di fornire costantemente risultati orientati al valore in contesti di mercato in rapida evoluzione.
- Analisi completa delle dimensioni e delle previsioni di mercato
- Analisi dettagliata della segmentazione
- Valutazione approfondita delle dinamiche di mercato
- Approfondimenti a livello regionale e nazionale
- Analisi del panorama competitivo e benchmarking aziendale
- Business intelligence strategica
Testimonianze
Il report di mercato sui sistemi SCADA di Insight Partners è completo, con preziosi spunti sulle tendenze attuali e sulle previsioni future. Il team si è dimostrato altamente professionale, reattivo e disponibile in ogni fase del progetto. Siamo molto soddisfatti e consigliamo vivamente i loro servizi.
RAN KEDEM Partner, Reali Technologies LTDsHo richiesto un report su un mercato software molto specifico e il team lo ha prodotto in pochi giorni. Le informazioni erano molto pertinenti e ben presentate. Ho quindi richiesto alcune modifiche e aggiunte al report. Il team è stato ancora una volta molto reattivo e ho ricevuto il report finale in meno di una settimana.
JEAN-HERVE JENN Presidente, Future AnalyticaAbbiamo collaborato con The Insight Partners per un importante studio di mercato e una previsione. Ci hanno fornito informazioni chiare su opportunità e rischi, che ci hanno aiutato a definire i nostri piani. La loro ricerca è stata facile da usare e basata su dati solidi. Ci ha aiutato a prendere decisioni intelligenti e consapevoli. Li consigliamo vivamente.
PIYUSH NAGPAL Vicepresidente senior, Abbaglianti globaliInsight Partners ha fornito ricerche di mercato approfondite e ben strutturate, con una solida competenza nel settore. Il loro team si è dimostrato professionale e reattivo in ogni fase. Il sito web intuitivo ha reso l'accesso ai report di settore semplice e immediato. Li consigliamo vivamente per servizi di ricerca affidabili e di alta qualità.
YUKIHIKO ADACHI Amministratore delegato, Deep Blue, LLC.Questa è la prima volta che acquisto un report di mercato da The Insight Partners. Sebbene inizialmente fossi indeciso, ho visitato il loro sito web e mi sono sentito più a mio agio nell'acquistare un report di mercato. Sono completamente soddisfatto della qualità del report e del servizio clienti. Avevo diverse domande e commenti sul report iniziale, ma dopo un paio di conversazioni via email con il loro analista credo di avere un report che posso utilizzare come input per il nostro processo di pianificazione strategica. Grazie mille per aver dedicato del tempo extra e aver reso questa esperienza positiva. Consiglierò sicuramente il vostro servizio ad altri e sarete la mia prima persona a cui rivolgermi quando avremo bisogno di ulteriori dati di mercato.
GIOVANNI SUZUKI Presidente e Amministratore Delegato, Consigliere di Amministrazione, Tecnologie BKDesidero esprimere la mia gratitudine per il supporto e la professionalità dimostrati nel rispondere alla mia richiesta di informazioni sul mercato dei dispositivi medici in vitro per malattie infettive in Nigeria. Apprezzo la vostra pazienza, la vostra guida e la vostra disponibilità a offrirmi uno sconto, che alla fine ci ha permesso di concludere l'affare. Non vedo l'ora di collaborare con The Insight Partners in futuro, grazie anche all'impressione che mi avete lasciato dopo questo primo incontro.
Dott. Chijioke AMMINISTRATORE DELEGATO DI ONYIA, PineCrest Healthcare Ltd.Motivo dell'acquisto
- Processo decisionale informato
- Comprensione delle dinamiche di mercato
- Analisi competitiva
- Analisi dei clienti
- Previsioni di mercato
- Mitigazione del rischio
- Pianificazione strategica
- Giustificazione degli investimenti
- Identificazione dei mercati emergenti
- Miglioramento delle strategie di marketing
- Aumento dell'efficienza operativa
- Allineamento alle tendenze normative


