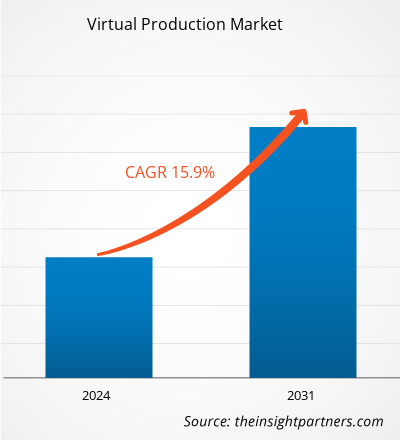
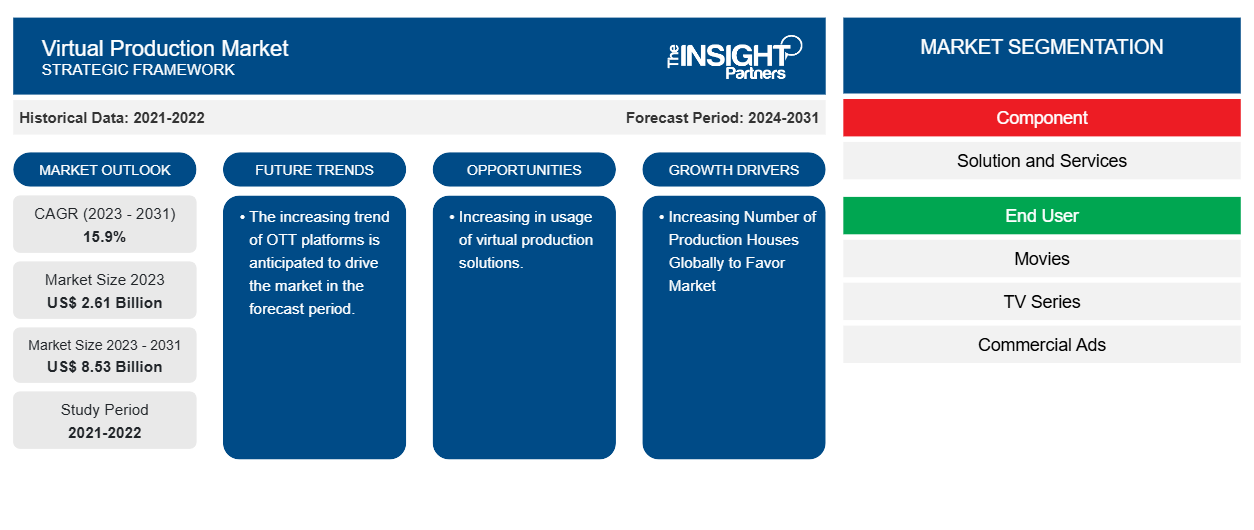
Si prevede che la dimensione del mercato della produzione virtuale raggiungerà gli 8,53 miliardi di dollari entro il 2031, rispetto ai 2,61 miliardi di dollari del 2023. Si prevede che il mercato registrerà un CAGR del 15,9% nel periodo 2023-2031. Il crescente numero di case di produzione a livello globale e i maggiori risparmi di costi e tempo per le case di produzione e i creatori di contenuti rimarranno probabilmente tendenze e driver chiave nel mercato.
Analisi del mercato della produzione virtuale
Il mercato della produzione virtuale sta vivendo una crescita significativa a livello globale. La crescita è attribuita al crescente numero di case di produzione a livello globale e al maggiore risparmio di costi e tempi per le case di produzione e i creatori di contenuti. Inoltre, si prevede che il crescente utilizzo di soluzioni di produzione virtuale e la tendenza crescente delle piattaforme OTT offriranno diverse opportunità per il mercato della produzione virtuale.
Panoramica del mercato della produzione virtuale
La produzione virtuale è una tecnologia di produzione multimediale in cui un set virtuale viene visualizzato su grandi pareti LED dietro un set fisico. I team utilizzano motori 3D in tempo reale (motori di gioco) per creare un set virtuale, visualizzarlo sulla parete LED e quindi sincronizzare i motori con le telecamere sul set per un maggiore realismo e profondità di prospettiva.
Personalizza questo report in base alle tue esigenze
Riceverai la personalizzazione gratuita di qualsiasi report, comprese parti di questo report, o analisi a livello nazionale, pacchetto dati Excel, oltre a usufruire di grandi offerte e sconti per start-up e università
-
Scopri le principali tendenze di mercato in questo rapporto.Questo campione GRATUITO includerà analisi di dati che spaziano dalle tendenze di mercato alle stime e alle previsioni.
Driver e opportunità del mercato della produzione virtuale
Aumento del numero di case di produzione a livello globale per favorire il mercato
Il crescente numero di case di produzione può guidare la produzione virtuale in vari modi. Man mano che vengono costruite più case di produzione, aumenta la domanda di metodi di produzione efficienti e convenienti. La produzione virtuale consente alle case di produzione di costruire più grandi, innovare di più e fornire risultati di alta qualità in una fase iniziale del processo di produzione. Inoltre, la produzione virtuale consente anche di risparmiare tempo e costi a molte case di produzione. Lo scouting virtuale che crea versioni virtuali dei set proposti può ridurre i tempi di viaggio e le spese aggiuntive. Prendere decisioni innovative in una fase iniziale del processo garantisce che vengano prese le decisioni giuste. Pertanto, considerando i parametri di cui sopra, il crescente numero di case di produzione a livello globale sta guidando la crescita del mercato della produzione virtuale.
Aumento dell'utilizzo di soluzioni di produzione virtuale.
Si prevede che l'uso crescente di soluzioni di produzione virtuale offra diverse opportunità per il mercato della produzione virtuale. Vari settori stanno implementando la produzione virtuale, il che aumenta la domanda di soluzioni di produzione virtuale. Ciò può invitare nuovi attori e investimenti, innovazioni ed espansioni in aumento. Inoltre, la produzione virtuale viene utilizzata non solo nei media e nell'intrattenimento, ma anche nella pubblicità , negli eventi dal vivo, nei giochi e in altri settori. Questa varietà di produzione virtuale può aprire nuove entrate e basi di clienti.
Analisi della segmentazione del rapporto sul mercato della produzione virtuale
I segmenti chiave che hanno contribuito alla derivazione dell'analisi del mercato della produzione virtuale sono i componenti e gli utenti finali.
- In base al componente, il mercato della produzione virtuale è suddiviso in soluzioni e servizi. Si prevede che il segmento delle soluzioni manterrà una quota di mercato significativa nel periodo di previsione.
- In base all'utente finale, il mercato della produzione virtuale è suddiviso in film, serie TV, pubblicità commerciali e video online. Si prevede che il film detenga una quota di mercato significativa nel periodo di previsione.
Analisi della quota di mercato della produzione virtuale per area geografica
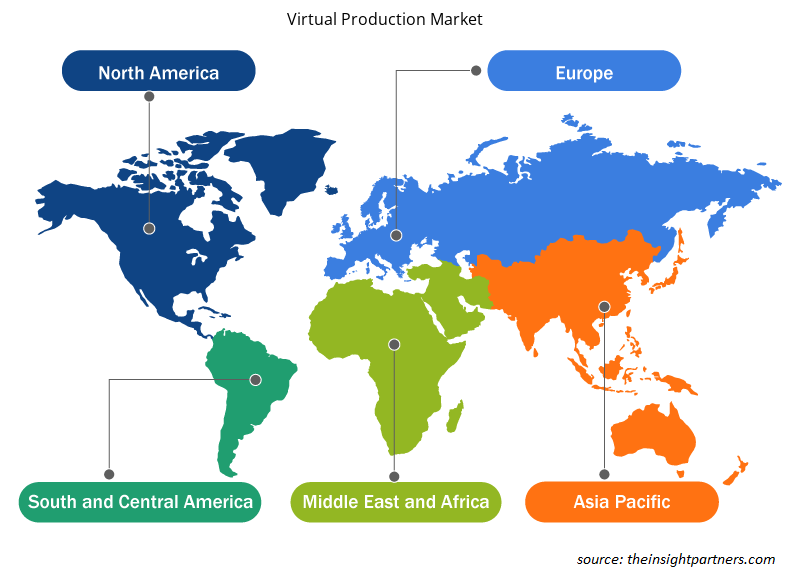
L'ambito geografico del rapporto sul mercato della produzione virtuale è suddiviso principalmente in cinque regioni: Nord America, Asia Pacifico, Europa, Medio Oriente e Africa, Sud e Centro America.
Il Nord America ha dominato il mercato della produzione virtuale. Il mercato della produzione virtuale del Nord America è segmentato in Stati Uniti, Canada e Messico. Inoltre, il mercato sta vivendo una crescita significativa, questa crescita è attribuita al crescente numero di case di produzione a livello globale e al maggiore risparmio di costi e tempi per le case di produzione e i creatori di contenuti nella regione. Inoltre, si prevede che il crescente utilizzo di soluzioni di produzione virtuale e la tendenza crescente delle piattaforme OTT offriranno diverse opportunità per il mercato della produzione virtuale del Nord America. Inoltre, una forte enfasi sulla ricerca e sviluppo nelle economie sviluppate di Stati Uniti e Canada sta costringendo gli attori nordamericani a portare sul mercato soluzioni tecnologicamente avanzate. Inoltre, gli Stati Uniti hanno un gran numero di attori del mercato della produzione virtuale che si sono sempre più concentrati sullo sviluppo di soluzioni innovative. Tutti questi fattori contribuiscono alla crescita del mercato della produzione virtuale nella regione.
Produzione virtuale
Approfondimenti regionali sul mercato della produzione virtuale
Le tendenze regionali e i fattori che influenzano il Virtual Production Market durante il periodo di previsione sono stati ampiamente spiegati dagli analisti di Insight Partners. Questa sezione discute anche i segmenti e la geografia del Virtual Production Market in Nord America, Europa, Asia Pacifico, Medio Oriente e Africa e Sud e Centro America.

- Ottieni i dati specifici regionali per il mercato della produzione virtuale
Ambito del rapporto sul mercato della produzione virtuale
| Attributo del report | Dettagli |
|---|---|
| Dimensioni del mercato nel 2023 | 2,61 miliardi di dollari USA |
| Dimensioni del mercato entro il 2031 | 8,53 miliardi di dollari USA |
| CAGR globale (2023-2031) | 15,9% |
| Dati storici | 2021-2022 |
| Periodo di previsione | 2024-2031 |
| Segmenti coperti |
Per componente
|
| Regioni e Paesi coperti |
America del Nord
|
| Leader di mercato e profili aziendali chiave |
|
Densità degli attori del mercato della produzione virtuale: comprendere il suo impatto sulle dinamiche aziendali
Il mercato del Virtual Production Market sta crescendo rapidamente, spinto dalla crescente domanda degli utenti finali dovuta a fattori quali l'evoluzione delle preferenze dei consumatori, i progressi tecnologici e una maggiore consapevolezza dei vantaggi del prodotto. Con l'aumento della domanda, le aziende stanno ampliando le loro offerte, innovando per soddisfare le esigenze dei consumatori e capitalizzando sulle tendenze emergenti, il che alimenta ulteriormente la crescita del mercato.
La densità degli operatori di mercato si riferisce alla distribuzione di aziende o società che operano in un particolare mercato o settore. Indica quanti concorrenti (operatori di mercato) sono presenti in un dato spazio di mercato in relazione alle sue dimensioni o al valore di mercato totale.
Le principali aziende che operano nel mercato della produzione virtuale sono:
- 360Ridimensiona
- INSTA 360
- Effetti speciali di Boris
- Epic Games; Inc
- Brompton Tecnologia Ltd
- Adobe Inc.
Disclaimer : le aziende elencate sopra non sono classificate secondo un ordine particolare.

- Ottieni una panoramica dei principali attori del mercato della produzione virtuale
Notizie e sviluppi recenti sul mercato della produzione virtuale
Il mercato della produzione virtuale viene valutato raccogliendo dati qualitativi e quantitativi dopo la ricerca primaria e secondaria, che include importanti pubblicazioni aziendali, dati associativi e database. Di seguito sono elencati alcuni degli sviluppi nel mercato della produzione virtuale:
- Dimension ha annunciato il lancio di DNEG 360, che unisce l'esperienza di Dimension nella produzione in tempo reale con i servizi di intrattenimento visivo leader a livello mondiale di DNEG. Insieme al lancio di DNEG 360, l'azienda ha rilasciato un'esclusiva funzionalità dietro le quinte: "The Evolution of Virtual Production", per mostrare le sue tecniche avanzate di produzione virtuale e i suoi progressi. (Fonte: sito Web aziendale Dimension, aprile 2024)
- La Vancouver Film School ha stretto una partnership con Pixomondo (PXO) per offrire una nuova offerta agli studenti VFS. Virtual Art Department Content Creation è un programma di certificazione di 12 settimane sviluppato da Pixomondo per insegnare ai creativi i fondamenti della creazione di contenuti per la produzione virtuale in VFX. (Fonte: sito Web aziendale Pixomondo (PXO), aprile 2024)
Copertura e risultati del rapporto sul mercato della produzione virtuale
Il rapporto “Dimensioni e previsioni del mercato della produzione virtuale (2021-2031)” fornisce un’analisi dettagliata del mercato che copre le seguenti aree:
- Dimensioni e previsioni del mercato della produzione virtuale a livello globale, regionale e nazionale per tutti i principali segmenti di mercato interessati dall'ambito di applicazione.
- Tendenze del mercato della produzione virtuale e dinamiche di mercato quali fattori trainanti, vincoli e opportunità chiave.
- Analisi dettagliata delle cinque forze PEST/Porter e SWOT.
- Analisi del mercato della produzione virtuale che copre le principali tendenze del mercato, il quadro globale e regionale, i principali attori, le normative e i recenti sviluppi del mercato.
- Analisi del panorama industriale e della concorrenza che comprende la concentrazione del mercato, l'analisi delle mappe di calore, i principali attori e gli sviluppi recenti per il mercato della produzione virtuale.
- Profili aziendali dettagliati.
- Analisi storica (2 anni), anno base, previsione (7 anni) con CAGR
- Analisi PEST e SWOT
- Valore/volume delle dimensioni del mercato - Globale, Regionale, Nazionale
- Industria e panorama competitivo
- Set di dati Excel
Report recenti
Testimonianze
Motivo dell'acquisto
- Processo decisionale informato
- Comprensione delle dinamiche di mercato
- Analisi competitiva
- Analisi dei clienti
- Previsioni di mercato
- Mitigazione del rischio
- Pianificazione strategica
- Giustificazione degli investimenti
- Identificazione dei mercati emergenti
- Miglioramento delle strategie di marketing
- Aumento dell'efficienza operativa
- Allineamento alle tendenze normative


 Ottieni un campione gratuito per - Mercato di produzione virtuale