Panoramica del mercato dei cavi sottomarini, crescita, tendenze, analisi, rapporto di ricerca (2022-2030)
Dati storici : 2020-2022 | Anno base : 2022 | Periodo di previsione : 2022-2030Dimensioni e previsioni del mercato dei cavi sottomarini (2020-2030), quota globale e regionale, tendenze e opportunità di crescita. Copertura del rapporto di analisi: per tipo (singolo nucleo e multi nucleo), tensione (media e alta), offerta (servizi di installazione e servizi di manutenzione e aggiornamento) e applicazione (comunicazione e alimentazione).
- Stato : Dati rilasciati
- Codice del report : TIPRE00033411
- Categoria : Elettronica e semiconduttori
- Numero di pagine : 150
- Formati di report disponibili :


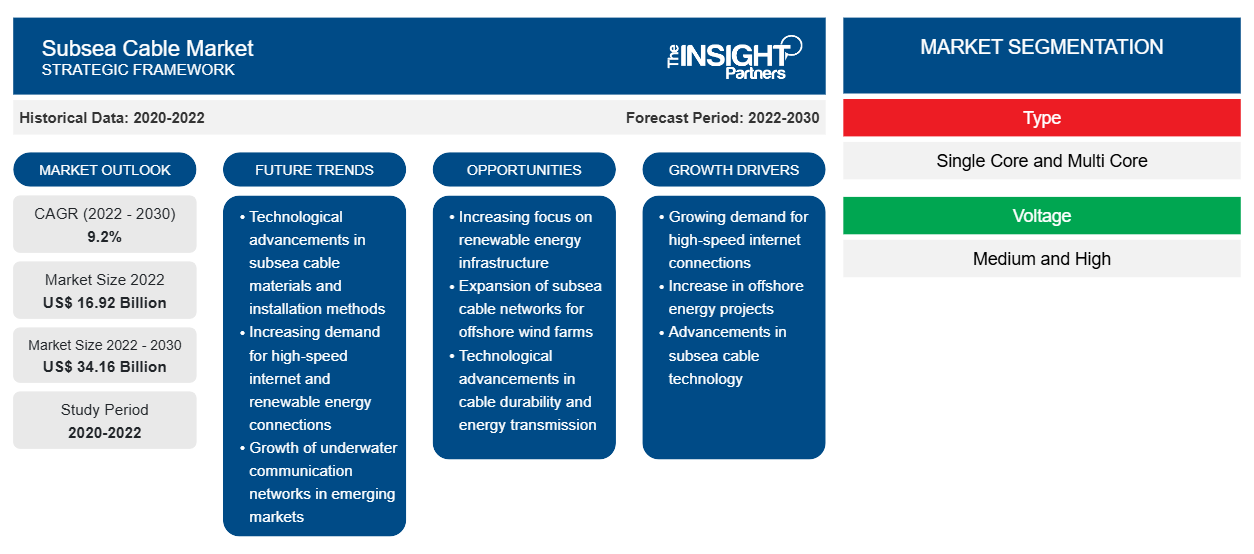
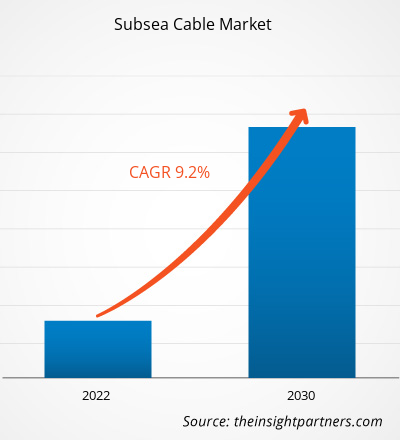
[Rapporto di ricerca] Il mercato dei cavi sottomarini è stato valutato a 16,92 miliardi di dollari nel 2022 e si prevede che raggiungerà i 34,16 miliardi di dollari entro il 2030; si stima che registrerà un CAGR del 9,2% dal 2022 al 2030.
Prospettiva dell'analista:
La crescente domanda di Internet e smartphone tra i consumatori, i crescenti investimenti in nuovi sistemi via cavo e la crescente adozione della tecnologia cloud sono alcuni fattori che guidano la crescita del mercato dei cavi sottomarini . I cavi sottomarini vengono utilizzati per trasmettere rapidamente enormi quantità di dati e collegare vari paesi in tutto il mondo. Tuttavia, i crescenti attacchi alla sicurezza informatica e gli elevati costi associati all'installazione di cavi sottomarini ostacolano la crescita del mercato. Inoltre, la crescente necessità di dati e flussi di comunicazione sta stimolando la crescita del mercato in tutto il mondo. Inoltre, si prevede che il crescente numero di nuovi progetti correlati all'installazione di cavi sottomarini creerà diverse nuove opportunità di crescita per il mercato durante il periodo di previsione.
Panoramica del mercato:
I cavi sottomarini, noti anche come cavi sottomarini, sono lunghi cavi in fibra ottica posati sui fondali marini che collegano due o più punti di atterraggio. Questi cavi sono lunghi migliaia di miglia e sono utilizzati per trasportare segnali di telecomunicazione da un punto all'altro. I cavi sottomarini sono componenti essenziali per l'infrastruttura globale delle telecomunicazioni, come la connessione di continenti, cavi Internet e la facilitazione delle comunicazioni in tutto il mondo. Questi cavi sono utilizzati principalmente per il trasporto di dati e comunicazioni a distanza, consentendo un rapido trasferimento di dati a livello globale.
Personalizza questo report in base alle tue esigenze
Riceverai la personalizzazione gratuita di qualsiasi report, comprese parti di questo report, o analisi a livello nazionale, pacchetto dati Excel, oltre a usufruire di grandi offerte e sconti per start-up e università
Mercato dei cavi sottomarini: approfondimenti strategici
-
Scopri le principali tendenze di mercato in questo rapporto.Questo campione GRATUITO includerà analisi di dati che spaziano dalle tendenze di mercato alle stime e alle previsioni.
Fattore trainante del mercato:
La crescita del traffico Internet guida il mercato dei cavi sottomarini
L'uso crescente di Internet in tutto il mondo sta guidando il mercato globale. Secondo l'Atlantic Council, oltre il 97% del traffico Internet globale dipende da cavi sottomarini, che sta aumentando rapidamente. Il mondo è connesso tramite Internet e quasi tutti vi fanno molto affidamento per gestire le proprie attività quotidiane, il che aumenta la necessità di servizi Internet tra i consumatori. Secondo l'International Telecommunication Union (ITU), il mondo avrà 5,4 miliardi di utenti Internet entro la fine del 2023, che copre il 67% della popolazione mondiale che utilizza Internet. C'è una rapida crescita nella domanda di velocità di banda elevata tra i consumatori. Inoltre, la penetrazione degli smartphone in tutto il mondo sta aumentando a causa dell'aumento del numero di utenti Internet. Ad esempio, secondo la GSM Association, ci saranno 5 miliardi di utenti di Internet mobile in tutto il mondo entro il 2025, 8 miliardi di connessioni smartphone entro il 2027 e 9,5 miliardi di connessioni mobili entro il 2030. Pertanto, la crescente adozione di smartphone aumenta il traffico Internet, che guida la crescita del mercato globale dei cavi sottomarini.
Segmentazione e ambito del report:
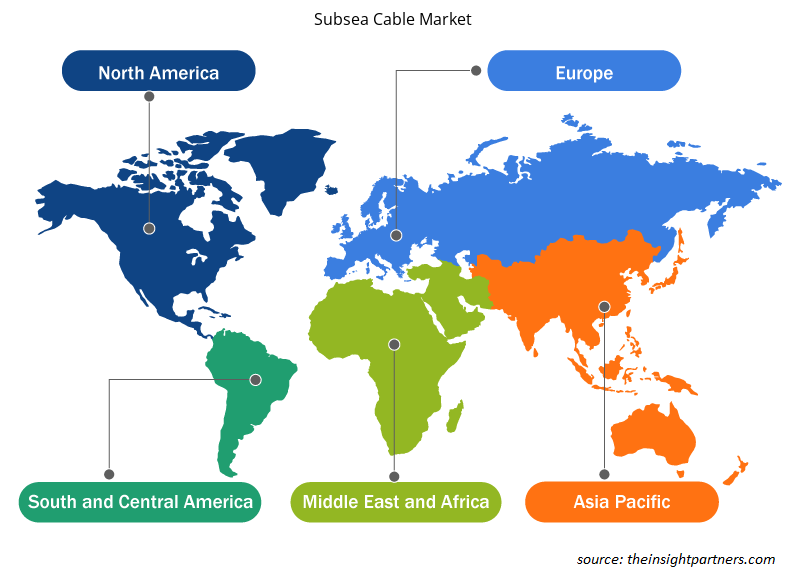
Il mercato dei cavi sottomarini è segmentato in base a tipo, tensione, offerta e applicazione. In base al tipo, il mercato è segmentato in single core e multi core. In termini di tensione, il mercato è categorizzato in medio e alto. In base all'offerta, il mercato dei cavi sottomarini è suddiviso inservizi di installazione e servizi di manutenzione e aggiornamento. In base all'applicazione, il mercato è suddiviso in comunicazione ed energia. Per regione, il mercato dei cavi sottomarini è segmentato in Nord America, Europa, Asia Pacifico (APAC), Medio Oriente e Africa (MEA) e Sud America (SAM).
Analisi segmentale:
In base all'offerta, il mercato è diviso inservizi di installazione e servizi di manutenzione e aggiornamento. Si prevede che il segmento dei servizi di manutenzione e aggiornamento si svilupperà a un ritmo significativo durante il periodo previsto a causa dell'elevato costo dell'installazione dei cavi. La manutenzione e l'aggiornamento dei cavi sottomarini solitamente richiedono meno tempo (fino a otto mesi) e sono più economici delle nuove installazioni. Inoltre, i cavi installati sono una risorsa preziosa per una nazione e l'implementazione di nuove tecnologie consente all'utente di utilizzare il cavo originale, sia in termini di progettazione che di capacità.
Analisi regionale:
L'Asia Pacifico ha detenuto la quota di mercato più grande dei cavi sottomarini nel 2022. Il mercato dell'Asia Pacifico è segmentato in Australia, Cina, Giappone, India, Corea del Sud e resto dell'Asia Pacifico. La regione contribuisce in modo notevole al mercato globale grazie all'elevata adozione e agli investimenti nei cavi sottomarini nella regione. La popolazione in crescita in paesi come Cina e India aumenta il numero di utenti Internet nella regione, il che sta guidando il mercato. Circa la metà del traffico Internet globale è generato dai consumatori, principalmente dall'Asia Pacifico, il che sta alimentando la domanda di cavi sottomarini. La crescente necessità di servizi Internet più veloci nella regione Transpacifica, dovuta ai cavi di comunicazione sottomarini limitati nella regione, incoraggia i governi a sviluppare nuovi sistemi di cavi nella regione. Ad esempio, nel luglio 2023, il Giappone ha firmato un Memorandum of Cooperation (MoC) con l'Unione Europea per sviluppare cavi sottomarini nell'Artico. Questi cavi migliorano la connettività velocizzando il traffico Internet in tutto il mondo e si prevede che saranno operativi entro il 2026.
Inoltre, l'Asia Pacifica sta diventando sempre più un hub per investimenti diretti nell'infrastruttura dei cavi sottomarini. Ad esempio, il sistema di cavi in fibra ottica 4/6/8 da 3.200 km Chennai-Singapore ha ricevuto un investimento di 100 miliardi di dollari dai governi di entrambi i paesi per rendere il cavo operativo nel 2021. Inoltre, molti giganti della tecnologia come Google, Microsoft e Facebook stanno collaborando con aziende di cavi sottomarini per lo sviluppo di nuovi progetti. Ad esempio, a gennaio 2022, Google, in qualità di investitore, ha collaborato con AARNet, Singtel, Indosat Ooredoo, SubPartners e Telstra per un nuovo progetto di cavi sottomarini che collega il Giappone all'Australia tramite Guam.
Approfondimenti regionali sul mercato dei cavi sottomarini
Le tendenze regionali e i fattori che influenzano il mercato dei cavi sottomarini durante il periodo di previsione sono stati ampiamente spiegati dagli analisti di Insight Partners. Questa sezione discute anche i segmenti e la geografia del mercato dei cavi sottomarini in Nord America, Europa, Asia Pacifico, Medio Oriente e Africa e America meridionale e centrale.
- Ottieni i dati specifici regionali per il mercato dei cavi sottomarini
Ambito del rapporto sul mercato dei cavi sottomarini
| Attributo del report | Dettagli |
|---|---|
| Dimensioni del mercato nel 2022 | 16,92 miliardi di dollari USA |
| Dimensioni del mercato entro il 2030 | 34,16 miliardi di dollari USA |
| CAGR globale (2022-2030) | 9,2% |
| Dati storici | 2020-2022 |
| Periodo di previsione | 2022-2030 |
| Segmenti coperti |
Per tipo
|
| Regioni e Paesi coperti |
America del Nord
|
| Leader di mercato e profili aziendali chiave |
|
Densità degli attori del mercato: comprendere il suo impatto sulle dinamiche aziendali
Il mercato dei cavi sottomarini sta crescendo rapidamente, spinto dalla crescente domanda degli utenti finali dovuta a fattori quali l'evoluzione delle preferenze dei consumatori, i progressi tecnologici e una maggiore consapevolezza dei vantaggi del prodotto. Con l'aumento della domanda, le aziende stanno ampliando le loro offerte, innovando per soddisfare le esigenze dei consumatori e capitalizzando sulle tendenze emergenti, il che alimenta ulteriormente la crescita del mercato.
La densità degli operatori di mercato si riferisce alla distribuzione di aziende o società che operano in un particolare mercato o settore. Indica quanti concorrenti (operatori di mercato) sono presenti in un dato spazio di mercato in relazione alle sue dimensioni o al valore di mercato totale.
Le principali aziende che operano nel mercato dei cavi sottomarini sono:
- La Nokia
- Sottocomunicazione, LLC
- Società NEC
- Prysmian SpA
- NKT A/S
Disclaimer : le aziende elencate sopra non sono classificate secondo un ordine particolare.
- Ottieni una panoramica dei principali attori del mercato dei cavi sottomarini
Analisi dei giocatori chiave:
Nokia; SubCom, LLC; NEC Corporation; Prysmian SpA; NKT A/S; Furukawa Electric Co., Ltd.; Hengtong Group Co., Ltd.; Ciena Corporation; ZTT Cable; e JDR Cable Systems Ltd. sono tra i principali attori del mercato dei cavi sottomarini descritti nel rapporto.
Sviluppi recenti:
Gli operatori di mercato stanno ampiamente adottando strategie inorganiche e organiche. Di seguito sono elencati alcuni recenti sviluppi chiave del mercato:
- A novembre 2022, Reliance Industries Limited ha ricevuto l'approvazione per implementare il più grande cavo sottomarino al mondo che collega Singapore e l'Europa. I due cavi sottomarini, India-Europe-Xpress (IEX) e India-Asia-Xpress (IAX), dovrebbero entrare in funzione tra il 2023 e il 2024.
- A dicembre 2022, Empresa de Telecomunicaciones de Cuba SA ha firmato un accordo con Orange per integrare il progetto Arimao con il sistema via cavo ARCOS-1 a Cojimar, Cuba. Le aziende stanno inoltre pianificando di rendere il progetto pronto per il servizio entro la fine del 2023.
- Nell'ottobre 2021, NEC Corporation ha annunciato che la sua sussidiaria OCC Corporation ha collaborato con Sumitomo Electric Industries Ltd. per sviluppare un cavo sottomarino in fibra ottica da quattro crore per Facebook. Questo sistema di cavi aumenta il numero di canali dati indipendenti abilitando la tecnologia di multiplexing a divisione spaziale (SDM) sottomarina di nuova generazione.

Naveen è un professionista esperto in ricerche di mercato e consulenza con oltre 9 anni di esperienza in progetti personalizzati, sindacati e di consulenza. Attualmente Vicepresidente Associato, ha gestito con successo gli stakeholder lungo l'intera catena del valore del progetto e ha redatto oltre 100 report di ricerca e oltre 30 incarichi di consulenza. Il suo lavoro spazia tra progetti industriali e governativi, contribuendo in modo significativo al successo dei clienti e al processo decisionale basato sui dati.
Naveen ha conseguito una laurea in Ingegneria Elettronica e delle Comunicazioni presso la VTU, Karnataka, e un MBA in Marketing e Operations presso la Manipal University. È membro attivo dell'IEEE da 9 anni, partecipando a conferenze, simposi tecnici e svolgendo attività di volontariato sia a livello di sezione che regionale. Prima del suo attuale ruolo, ha lavorato come Consulente Strategico Associato presso IndustryARC e come Consulente Server Industriali presso Hewlett Packard (HP Global).
- Analisi storica (2 anni), anno base, previsione (7 anni) con CAGR
- Analisi PEST e SWOT
- Valore/volume delle dimensioni del mercato - Globale, Regionale, Nazionale
- Industria e panorama competitivo
- Set di dati Excel
Testimonianze
Il report di mercato sui sistemi SCADA di Insight Partners è completo, con preziosi spunti sulle tendenze attuali e sulle previsioni future. Il team si è dimostrato altamente professionale, reattivo e disponibile in ogni fase del progetto. Siamo molto soddisfatti e consigliamo vivamente i loro servizi.
RAN KEDEM Partner, Reali Technologies LTDsHo richiesto un report su un mercato software molto specifico e il team lo ha prodotto in pochi giorni. Le informazioni erano molto pertinenti e ben presentate. Ho quindi richiesto alcune modifiche e aggiunte al report. Il team è stato ancora una volta molto reattivo e ho ricevuto il report finale in meno di una settimana.
JEAN-HERVE JENN Presidente, Future AnalyticaAbbiamo collaborato con The Insight Partners per un importante studio di mercato e una previsione. Ci hanno fornito informazioni chiare su opportunità e rischi, che ci hanno aiutato a definire i nostri piani. La loro ricerca è stata facile da usare e basata su dati solidi. Ci ha aiutato a prendere decisioni intelligenti e consapevoli. Li consigliamo vivamente.
PIYUSH NAGPAL Vicepresidente senior, Abbaglianti globaliInsight Partners ha fornito ricerche di mercato approfondite e ben strutturate, con una solida competenza nel settore. Il loro team si è dimostrato professionale e reattivo in ogni fase. Il sito web intuitivo ha reso l'accesso ai report di settore semplice e immediato. Li consigliamo vivamente per servizi di ricerca affidabili e di alta qualità.
YUKIHIKO ADACHI Amministratore delegato, Deep Blue, LLC.Questa è la prima volta che acquisto un report di mercato da The Insight Partners. Sebbene inizialmente fossi indeciso, ho visitato il loro sito web e mi sono sentito più a mio agio nell'acquistare un report di mercato. Sono completamente soddisfatto della qualità del report e del servizio clienti. Avevo diverse domande e commenti sul report iniziale, ma dopo un paio di conversazioni via email con il loro analista credo di avere un report che posso utilizzare come input per il nostro processo di pianificazione strategica. Grazie mille per aver dedicato del tempo extra e aver reso questa esperienza positiva. Consiglierò sicuramente il vostro servizio ad altri e sarete la mia prima persona a cui rivolgermi quando avremo bisogno di ulteriori dati di mercato.
GIOVANNI SUZUKI Presidente e Amministratore Delegato, Consigliere di Amministrazione, Tecnologie BKDesidero esprimere la mia gratitudine per il supporto e la professionalità dimostrati nel rispondere alla mia richiesta di informazioni sul mercato dei dispositivi medici in vitro per malattie infettive in Nigeria. Apprezzo la vostra pazienza, la vostra guida e la vostra disponibilità a offrirmi uno sconto, che alla fine ci ha permesso di concludere l'affare. Non vedo l'ora di collaborare con The Insight Partners in futuro, grazie anche all'impressione che mi avete lasciato dopo questo primo incontro.
Dott. Chijioke AMMINISTRATORE DELEGATO DI ONYIA, PineCrest Healthcare Ltd.Motivo dell'acquisto
- Processo decisionale informato
- Comprensione delle dinamiche di mercato
- Analisi competitiva
- Analisi dei clienti
- Previsioni di mercato
- Mitigazione del rischio
- Pianificazione strategica
- Giustificazione degli investimenti
- Identificazione dei mercati emergenti
- Miglioramento delle strategie di marketing
- Aumento dell'efficienza operativa
- Allineamento alle tendenze normative


Sblocca sconti esclusivi sui report
Richiedi ora


 Ottieni un campione gratuito per - Mercato dei cavi sottomarini