Realtà virtuale e realtà aumentata nel rapporto sul mercato al dettaglio 2031 per segmenti, geografia, dinamiche, sviluppi recenti e approfondimenti strategici
Rapporto di analisi sulle dimensioni e le previsioni del mercato della realtà virtuale e aumentata nel commercio al dettaglio (2021-2031), quota globale e regionale, tendenze e opportunità di crescita. Copertura: per componente (hardware, software, servizi), applicazione (pubblicità e marketing, soluzioni di prova, pianificazione e progettazione, altri), tipo di vendita al dettaglio (gioielli, abbigliamento, bellezza e cosmetici, arredamento, altri) e area geografica.
- Stato : Dati rilasciati
- Codice del report : TIPRE00006606
- Categoria : Tecnologia, media e telecomunicazioni
- Numero di pagine : 150
- Formati di report disponibili :


- Data dell'ultimo aggiornamento : August 21, 2024


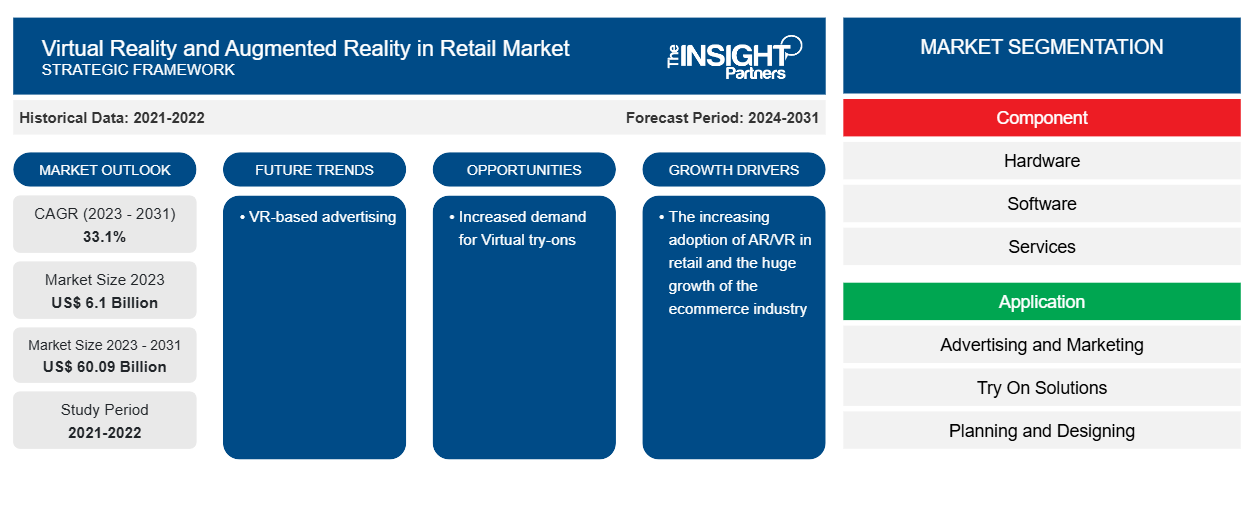
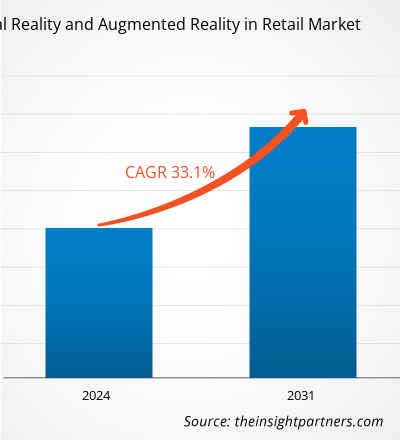
Si prevede che la realtà virtuale e la realtà aumentata nel commercio al dettaglio raggiungeranno i 60,09 miliardi di dollari entro il 2031, rispetto ai 6,1 miliardi di dollari del 2023. Si prevede che la realtà virtuale e la realtà aumentata nel mercato al dettaglio registreranno un CAGR del 33,1% nel periodo 2023-2031. È probabile che la pubblicità basata sulla realtà virtuale rimanga una tendenza chiave nel mercato.
Realtà virtuale e realtà aumentata nell'analisi del mercato al dettaglio
La realtà virtuale e la realtà aumentata nel commercio al dettaglio includono prospettive di crescita dovute alle attuali tendenze di mercato e al loro impatto prevedibile durante il periodo di previsione. La realtà virtuale e la realtà aumentata nel commercio al dettaglio stanno crescendo a causa di fattori quali la crescente adozione di AR/VR nel commercio al dettaglio e l'enorme crescita del settore dell'e-commerce. Maggiore domanda di Virtual try-on per fornire opportunità redditizie per la realtà virtuale e la realtà aumentata nel commercio al dettaglio.
Panoramica del mercato della realtà virtuale e aumentata nel commercio al dettaglio
La realtà virtuale (VR) e la realtà aumentata (AR) stanno trasformando il panorama del commercio al dettaglio offrendo esperienze di acquisto immersive e interattive. La VR crea un ambiente completamente digitale in cui i clienti possono esplorare negozi virtuali, visualizzare prodotti in 3D e persino provare virtualmente i vestiti. La AR, d'altro canto, sovrappone informazioni digitali al mondo reale, consentendo agli acquirenti di vedere come potrebbero apparire i mobili nelle loro case o come apparirebbe il trucco sui loro volti utilizzando app per smartphone o specchi intelligenti. Entrambe queste tecnologie consentono ai rivenditori di colmare il divario tra acquisti online e in negozio, migliorare la visualizzazione dei prodotti, ridurre i resi e creare esperienze di marca coinvolgenti che possono guidare il coinvolgimento dei clienti e le vendite.
Personalizza questo report in base alle tue esigenze
Riceverai la personalizzazione gratuita di qualsiasi report, comprese parti di questo report, o analisi a livello nazionale, pacchetto dati Excel, oltre a usufruire di grandi offerte e sconti per start-up e università
Realtà virtuale e realtà aumentata nel mercato retail: approfondimenti strategici
-
Scopri le principali tendenze di mercato in questo rapporto.Questo campione GRATUITO includerà analisi di dati che spaziano dalle tendenze di mercato alle stime e alle previsioni.
Realtà virtuale e realtà aumentata nel mercato al dettaglio: driver e opportunità
Aumentare l'adozione di AR/VR nel commercio al dettaglio per favorire il mercato
Uno dei principali settori che l'era digitale ha avuto un impatto è il settore della vendita al dettaglio. I più grandi rivenditori, tra cui Walmart, Alibaba e Amazon, investono attivamente in tecnologie di vendita al dettaglio all'avanguardia per fornire ai propri clienti servizi più personalizzati e interattivi. Tre componenti fondamentali della vendita al dettaglio intelligente sono maggiore praticità, personalizzazione e customizzazione. Soluzioni innovative come applicazioni basate su AR e VR stanno diventando sempre più popolari. Molte attività di vendita al dettaglio hanno iniziato ad adottare la tecnologia AR/VR dopo giganti della vendita al dettaglio come Wayfair, Lowe's e Ikea. Ad esempio, si prevede che più di 1 miliardo di persone utilizzerà prodotti di realtà aumentata. Il numero è sbalorditivo. La realtà virtuale e aumentata semplifica l'identificazione e la prova delle cose da parte dei clienti prima di acquistarle. La navigazione nei grandi centri commerciali sarà semplificata con l'uso della realtà aumentata.Alibaba, and Amazon, actively invest in cutting-edge retail technologies in order to provide more individualized and interactive services to their customers. Three fundamental components of smart retail are increased convenience, personalization, and customization. Innovative solutions like applications powered by AR and VR are growing in popularity. Many retail businesses have started to adopt AR/VR technology after retail giants like Wayfair, Lowe's, and Ikea. For instance, more than 1 billion people are expected to use augmented reality products. The number is staggering. Virtual and augmented reality makes it easier for customers to identify and try things before buying. Huge shopping mall navigation will be made easier with the use of augmented reality.
Aumento della domanda di prove virtualiTry-Ons
La crescente domanda di prove virtuali offre opportunità significative per la VR e la AR nella crescita del mercato al dettaglio. Consentendo ai clienti di visualizzare i prodotti in modo più accurato prima dell'acquisto, le prove virtuali possono ridurre significativamente i tassi di reso. Ciò consente ai rivenditori di risparmiare denaro su spedizione e riassortimento, migliorando la redditività. Inoltre, man mano che i clienti acquisiscono fiducia nei loro acquisti online tramite prove virtuali, è più probabile che acquistino articoli senza prima vederli di persona. Ciò può aumentare le vendite di e-commerce, soprattutto in categorie come abbigliamento e cosmetici . Le prove virtuali offrono un'esperienza di acquisto innovativa e interattiva che può aumentare il coinvolgimento e la soddisfazione del cliente. Ciò può portare a una migliore fedeltà al marchio e ad acquisti ripetuti.try-ons presents significant opportunities for VR and AR in retail market growth. By allowing customers to visualize products more accurately before purchase, virtual try-ons can significantly reduce return rates. This saves retailers money on shipping and restocking, improving profitability. Moreover, as customers gain confidence in their online purchases through virtual try-ons, they're more likely to buy items without seeing them in person first. This can boost e-commerce sales, especially in categories like clothing and try-ons offer a novel, interactive shopping experience that can increase customer engagement and satisfaction. This can lead to improved brand loyalty and repeat purchases.
Analisi della segmentazione del rapporto sul mercato della realtà virtuale e aumentata nel commercio al dettaglio
I segmenti chiave che hanno contribuito alla derivazione della realtà virtuale e della realtà aumentata nell'analisi del mercato al dettaglio sono i componenti, l'applicazione e il tipo di vendita al dettaglio
- In base ai componenti, la realtà virtuale e la realtà aumentata nel mercato al dettaglio sono divise in hardware, software e servizi. Il segmento hardware deterrà una quota di mercato significativa nel 2023.
- Per applicazione, il mercato è segmentato in pubblicità e marketing, soluzioni di prova, pianificazione e progettazione e altri. Il segmento di pubblicità e marketing ha detenuto la quota di mercato più grande nel 2023.
- In termini di tipologia di vendita al dettaglio, il mercato è segmentato in gioielli, abbigliamento, bellezza e cosmetici, arredamento, altri). Il segmento dell'abbigliamento ha detenuto la quota di mercato maggiore nel 2023.
Analisi della quota di mercato della realtà virtuale e aumentata nel commercio al dettaglio per area geografica
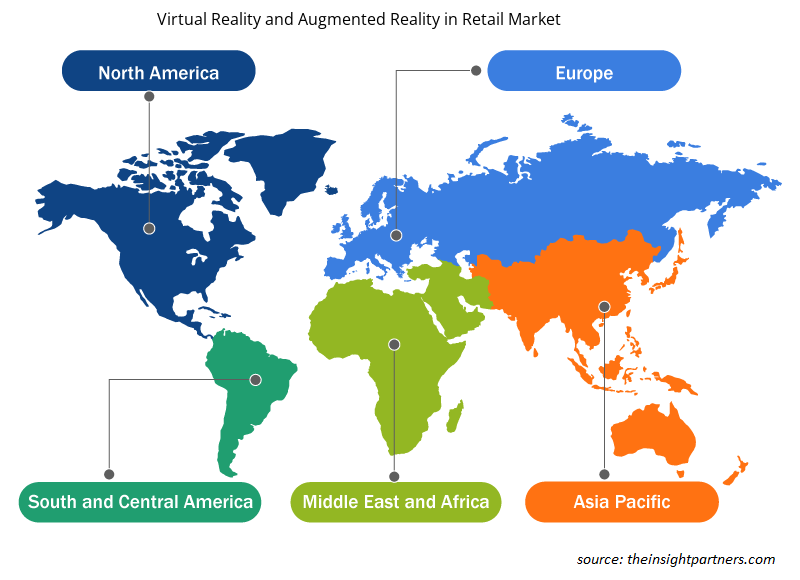
L'ambito geografico del rapporto sul mercato della realtà virtuale e della realtà aumentata nel commercio al dettaglio è suddiviso principalmente in cinque regioni: Nord America, Asia Pacifico, Europa, Medio Oriente e Africa, e Sud e Centro America.
L'uso della realtà aumentata (AR) e della realtà virtuale (VR) nel commercio al dettaglio nell'area Asia-Pacifico sta guadagnando terreno. Queste tecnologie vengono sempre più utilizzate in vari modi per migliorare l'esperienza di vendita al dettaglio e guidare il coinvolgimento dei clienti. Queste tecnologie hanno il potenziale per migliorare l'esperienza di vendita al dettaglio, guidare il coinvolgimento dei clienti e fornire nuove opportunità di marketing, formazione e istruzione nel settore.VR) in retail in the Asia Pacific is gaining traction. These technologies are being increasingly utilized in various ways to enhance the retail experience and drive customer engagement. These technologies have the potential to enhance the retail experience, drive customer engagement, and provide new opportunities for marketing, training, and education in the industry.
Realtà virtuale e realtà aumentata nel mercato al dettaglio: approfondimenti regionali
Le tendenze e i fattori regionali che influenzano la realtà virtuale e la realtà aumentata nel mercato al dettaglio durante il periodo di previsione sono stati ampiamente spiegati dagli analisti di Insight Partners. Questa sezione discute anche i segmenti e la geografia della realtà virtuale e della realtà aumentata nel mercato al dettaglio in Nord America, Europa, Asia Pacifico, Medio Oriente e Africa e America meridionale e centrale.
- Ottieni i dati specifici regionali per la realtà virtuale e la realtà aumentata nel mercato al dettaglio
Ambito del rapporto sul mercato della realtà virtuale e aumentata nel commercio al dettaglio
| Attributo del report | Dettagli |
|---|---|
| Dimensioni del mercato nel 2023 | 6,1 miliardi di dollari USA |
| Dimensioni del mercato entro il 2031 | 60,09 miliardi di dollari USA |
| CAGR globale (2023-2031) | 33,1% |
| Dati storici | 2021-2022 |
| Periodo di previsione | 2024-2031 |
| Segmenti coperti |
Per componente
|
| Regioni e Paesi coperti |
America del Nord
|
| Leader di mercato e profili aziendali chiave |
|
Realtà virtuale e realtà aumentata nel mercato al dettaglio Densità degli attori: comprendere il suo impatto sulle dinamiche aziendali
Il mercato della realtà virtuale e della realtà aumentata nel mercato al dettaglio sta crescendo rapidamente, spinto dalla crescente domanda degli utenti finali dovuta a fattori quali l'evoluzione delle preferenze dei consumatori, i progressi tecnologici e una maggiore consapevolezza dei vantaggi del prodotto. Con l'aumento della domanda, le aziende stanno ampliando le loro offerte, innovando per soddisfare le esigenze dei consumatori e capitalizzando sulle tendenze emergenti, il che alimenta ulteriormente la crescita del mercato.
La densità degli operatori di mercato si riferisce alla distribuzione di aziende o società che operano in un particolare mercato o settore. Indica quanti concorrenti (operatori di mercato) sono presenti in un dato spazio di mercato in relazione alle sue dimensioni o al valore di mercato totale.
Le principali aziende che operano nel mercato della Realtà Virtuale e della Realtà Aumentata nel Retail sono:
- Epson America, Inc.
- Marxista
- Google LLC
- Informazioni su Infosys
- Società Intel
- Società Microsoft
Disclaimer : le aziende elencate sopra non sono classificate secondo un ordine particolare.
- Ottieni una panoramica dei principali attori chiave del mercato della realtà virtuale e della realtà aumentata al dettaglio
Realtà virtuale e realtà aumentata nel mercato al dettaglio: notizie e sviluppi recenti
La realtà virtuale e la realtà aumentata nel mercato al dettaglio vengono valutate raccogliendo dati qualitativi e quantitativi dopo la ricerca primaria e secondaria, che include importanti pubblicazioni aziendali, dati associativi e database. Di seguito sono elencati alcuni degli sviluppi nella realtà virtuale e nella realtà aumentata nel mercato al dettaglio:
- Apple ha rilasciato il suo primo visore mixed-reality, Vision Pro, con 600 nuove app e giochi. Tra queste, vi erano incursioni nella realtà aumentata (AR) e nella realtà virtuale (VR) da parte dei principali rivenditori, sfruttando la capacità di offrire ai consumatori percorsi di eCommerce più interattivi. L'app Vision Pro offre agli utenti del visore un'esperienza di acquisto in 3D, consentendo loro di esaminare i prodotti e assemblare gli outfit. Inoltre, l'integrazione della funzionalità Apple SharePlay per le videochiamate FaceTime consente al rivenditore di fornire consigli in tempo reale dagli stilisti in questo ambiente realistico. (Fonte: Apple, comunicato stampa, febbraio 2024)
- Zero10 offre soluzioni digitali tramite specchi AR sfruttati in-store e in-window display per marchi come Tommy Hilfiger e Coach. Tommy Hilfiger utilizza anche gli specchi AR dell'azienda tecnologica Zero10 in Europa come parte della sua campagna Shawn Mendes e per promuovere il suo recente lancio di piumini. Nel frattempo, Coach utilizza gli specchi AR di Zero10 e la vetrina AR per pubblicizzare le sue campagne Tabby bag e Holiday Season (Fonte: Zero10, comunicato stampa, aprile 2024)
Copertura e risultati del rapporto sulla realtà virtuale e aumentata nel mercato al dettaglio
Il rapporto "Dimensioni e previsioni del mercato della realtà virtuale e della realtà aumentata al dettaglio (2021-2031)" fornisce un'analisi dettagliata del mercato che copre le seguenti aree:
- Realtà virtuale e realtà aumentata nel mercato al dettaglio: dimensioni e previsioni a livello globale, regionale e nazionale per tutti i segmenti di mercato chiave coperti dall'ambito
- Realtà virtuale e realtà aumentata nelle tendenze del mercato al dettaglio, nonché dinamiche di mercato come driver, restrizioni e opportunità chiave
- Analisi dettagliata delle cinque forze PEST/Porter e SWOT
- Analisi della realtà virtuale e della realtà aumentata nel mercato al dettaglio che copre le principali tendenze del mercato, il quadro globale e regionale, i principali attori, le normative e i recenti sviluppi del mercato
- Analisi del panorama industriale e della concorrenza che copre la concentrazione del mercato, l'analisi della mappa di calore, i principali attori e gli sviluppi recenti per la realtà virtuale e la realtà aumentata nel mercato al dettaglio
- Profili aziendali dettagliati

Ankita è una dinamica professionista della ricerca di mercato e della consulenza con oltre 8 anni di esperienza nei settori della tecnologia, dei media, dell'ICT, dell'elettronica e dei semiconduttori. Ha guidato e portato a termine con successo oltre 100 incarichi di consulenza e ricerca per clienti globali come Microsoft, Oracle, NEC Corporation, SAP, KPMG ed Expeditors International. Le sue competenze principali includono la valutazione del mercato, l'analisi dei dati, le previsioni, la formulazione di strategie, l'intelligence competitiva e la redazione di report.
Ankita è esperta nella gestione di cicli di progetto completi, dalla progettazione di proposte pre-vendita e discussioni con i clienti fino alla fornitura di insight fruibili post-vendita. È esperta nella gestione di team interfunzionali, nella strutturazione di moduli di ricerca complessi e nell'allineamento delle soluzioni agli obiettivi aziendali specifici del cliente. Le sue eccellenti capacità di comunicazione, leadership e presentazione le hanno permesso di fornire costantemente risultati orientati al valore in contesti di mercato in rapida evoluzione.
- Analisi completa delle dimensioni e delle previsioni di mercato
- Analisi dettagliata della segmentazione
- Valutazione approfondita delle dinamiche di mercato
- Approfondimenti a livello regionale e nazionale
- Analisi del panorama competitivo e benchmarking aziendale
- Business intelligence strategica
Testimonianze
Il report di mercato sui sistemi SCADA di Insight Partners è completo, con preziosi spunti sulle tendenze attuali e sulle previsioni future. Il team si è dimostrato altamente professionale, reattivo e disponibile in ogni fase del progetto. Siamo molto soddisfatti e consigliamo vivamente i loro servizi.
RAN KEDEM Partner, Reali Technologies LTDsHo richiesto un report su un mercato software molto specifico e il team lo ha prodotto in pochi giorni. Le informazioni erano molto pertinenti e ben presentate. Ho quindi richiesto alcune modifiche e aggiunte al report. Il team è stato ancora una volta molto reattivo e ho ricevuto il report finale in meno di una settimana.
JEAN-HERVE JENN Presidente, Future AnalyticaAbbiamo collaborato con The Insight Partners per un importante studio di mercato e una previsione. Ci hanno fornito informazioni chiare su opportunità e rischi, che ci hanno aiutato a definire i nostri piani. La loro ricerca è stata facile da usare e basata su dati solidi. Ci ha aiutato a prendere decisioni intelligenti e consapevoli. Li consigliamo vivamente.
PIYUSH NAGPAL Vicepresidente senior, Abbaglianti globaliInsight Partners ha fornito ricerche di mercato approfondite e ben strutturate, con una solida competenza nel settore. Il loro team si è dimostrato professionale e reattivo in ogni fase. Il sito web intuitivo ha reso l'accesso ai report di settore semplice e immediato. Li consigliamo vivamente per servizi di ricerca affidabili e di alta qualità.
YUKIHIKO ADACHI Amministratore delegato, Deep Blue, LLC.Questa è la prima volta che acquisto un report di mercato da The Insight Partners. Sebbene inizialmente fossi indeciso, ho visitato il loro sito web e mi sono sentito più a mio agio nell'acquistare un report di mercato. Sono completamente soddisfatto della qualità del report e del servizio clienti. Avevo diverse domande e commenti sul report iniziale, ma dopo un paio di conversazioni via email con il loro analista credo di avere un report che posso utilizzare come input per il nostro processo di pianificazione strategica. Grazie mille per aver dedicato del tempo extra e aver reso questa esperienza positiva. Consiglierò sicuramente il vostro servizio ad altri e sarete la mia prima persona a cui rivolgermi quando avremo bisogno di ulteriori dati di mercato.
GIOVANNI SUZUKI Presidente e Amministratore Delegato, Consigliere di Amministrazione, Tecnologie BKDesidero esprimere la mia gratitudine per il supporto e la professionalità dimostrati nel rispondere alla mia richiesta di informazioni sul mercato dei dispositivi medici in vitro per malattie infettive in Nigeria. Apprezzo la vostra pazienza, la vostra guida e la vostra disponibilità a offrirmi uno sconto, che alla fine ci ha permesso di concludere l'affare. Non vedo l'ora di collaborare con The Insight Partners in futuro, grazie anche all'impressione che mi avete lasciato dopo questo primo incontro.
Dott. Chijioke AMMINISTRATORE DELEGATO DI ONYIA, PineCrest Healthcare Ltd.Motivo dell'acquisto
- Processo decisionale informato
- Comprensione delle dinamiche di mercato
- Analisi competitiva
- Analisi dei clienti
- Previsioni di mercato
- Mitigazione del rischio
- Pianificazione strategica
- Giustificazione degli investimenti
- Identificazione dei mercati emergenti
- Miglioramento delle strategie di marketing
- Aumento dell'efficienza operativa
- Allineamento alle tendenze normative


