Panoramica del mercato della spettroscopia fotoelettronica a raggi X, crescita, tendenze, analisi, rapporto di ricerca (2020-2027)
Dati storici : | Anno base : | Periodo di previsione :Mercato della spettroscopia fotoelettronica a raggi X fino al 2027 - Analisi e previsioni globali per tipo di prodotto (spettroscopia fotoelettronica a raggi X monocromatica, spettroscopia fotoelettronica a raggi X non monocromatica); utilizzo (rilevamento di elementi, rilevamento di contaminazione, stima della densità, determinazione della formula empirica, altri); applicazione (sanità, aerospaziale, automobilistico, altri) e geografia
- Stato : Dati rilasciati
- Codice del report : TIPHE100001237
- Categoria : Scienze della vita
- Numero di pagine : 150
- Formati di report disponibili :


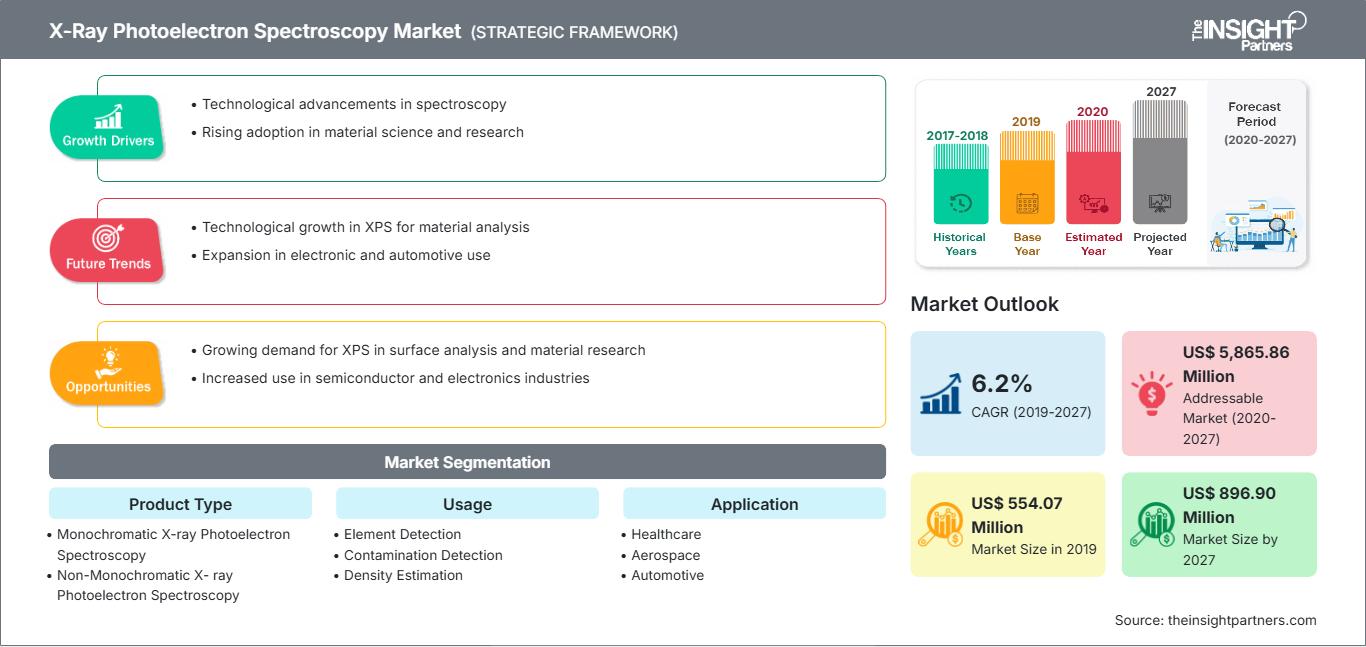
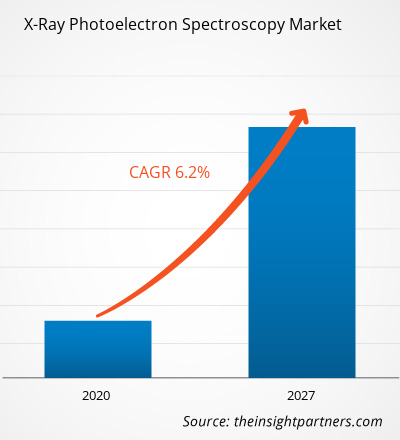
Il mercato della spettroscopia fotoelettronica a raggi X è stato valutato a 554,07 milioni di dollari nel 2019 e si prevede che crescerà a un CAGR del 6,2% dal 2020 al 2027, raggiungendo gli 896,90 milioni di dollari entro il 2027.
La spettroscopia fotoelettronica a raggi X (XPS) è una tecnica spettroscopica quantitativa utilizzata per misurare la composizione elementare, la formula empirica, lo stato chimico e lo stato elettronico degli elementi presenti in un dato campione. Il mercato globale della spettroscopia fotoelettronica a raggi X è trainato da fattori quali la crescente domanda di materiali ad alte prestazioni e l'aumento dei finanziamenti da parte di enti privati in ricerca e sviluppo, ma si prevede che la carenza di professionisti qualificati frenerà la crescita del mercato durante il periodo di previsione. Tuttavia, le opportunità di sviluppo nei paesi emergenti potrebbero offrire notevoli opportunità di crescita per migliorare la quota di mercato degli operatori del settore nel prossimo futuro.
Approfondimenti di mercato: crescente domanda di materiali ad alte prestazioni
La spettroscopia fotoelettronica a raggi X (XPS) è una tecnica utilizzata per analizzare la chimica superficiale di un materiale. La tecnica XPS è anche nota come spettroscopia elettronica per analisi chimica (ESCA), un metodo consolidato per la caratterizzazione chimica delle superfici dei materiali. I fornitori e i produttori di tessuti tecnici e commerciali si stanno concentrando sullo sviluppo dell'XPS come strumento ideale per supportare l'ottimizzazione e lo sviluppo dei tipi di rivestimento o trattamento superficiale richiesti dai consumatori. Le reti polimeriche, come poliestere e polipropilene, vengono utilizzate per la riparazione chirurgica di ernie e altri difetti dei tessuti molli.
Personalizza questo rapporto in base alle tue esigenze
Potrai personalizzare gratuitamente qualsiasi rapporto, comprese parti di questo rapporto, o analisi a livello di paese, pacchetto dati Excel, oltre a usufruire di grandi offerte e sconti per start-up e università
Mercato della spettroscopia fotoelettronica a raggi X: Approfondimenti strategici
-
Ottieni le principali tendenze chiave del mercato di questo rapporto.Questo campione GRATUITO includerà l'analisi dei dati, che vanno dalle tendenze di mercato alle stime e alle previsioni.
Sebbene i materiali a rete siano utilizzati in chirurgia, il loro impianto può essere associato a gravi tassi di infezione. Per ridurre i tassi di infezione di tali reti, è necessario migliorarne le proprietà superficiali. Inoltre, molti problemi associati ai materiali moderni possono essere risolti comprendendo le interazioni chimiche e fisiche che si verificano alle interfacce tra gli strati o la superficie di un materiale. La superficie influenzerà fattori quali l'attività catalitica, i tassi di corrosione, la bagnabilità, le proprietà adesive, il potenziale di contatto e i meccanismi di guasto. Pertanto, la crescente domanda di materiali ad alte prestazioni aumenterà proporzionalmente il mercato della spettroscopia fotoelettronica a raggi X nel periodo di previsione.
Approfondimenti sulle tipologie di prodotto
I segmenti di mercato della spettroscopia fotoelettronica a raggi X per tipologia di prodotto includono la spettroscopia fotoelettronica a raggi X monocromatica e la spettroscopia fotoelettronica a raggi X non monocromatica. Il segmento della spettroscopia fotoelettronica a raggi X monocromatica ha conquistato la quota maggiore del mercato globale della spettroscopia fotoelettronica a raggi X. La spettroscopia fotoelettronica a raggi X monocromatica utilizza una sorgente di raggi X monocromatica in alluminio in grado di analizzare un'ampia gamma di campioni. Quando si utilizza un monocromatore, la distanza tra la sorgente di raggi X e il campione è maggiore rispetto a quando si utilizza una sorgente non monocromatica, riducendo quindi il rischio di danneggiamento del campione. Pertanto, la spettroscopia fotoelettronica a raggi X monocromatica offre numerosi vantaggi rispetto alla spettroscopia fotoelettronica a raggi X non monocromatica.
Approfondimenti sull'utilizzo
I segmenti di utilizzo del mercato della spettroscopia fotoelettronica a raggi X includono il rilevamento di elementi, la stima della densità, il rilevamento della contaminazione, la determinazione di formule empiriche e altri. Il mercato della rilevazione di elementi ha registrato la quota più elevata nel 2019 e si prevede una crescita significativa durante il periodo di previsione grazie alle diverse applicazioni in diversi settori.
In termini di quota di mercato, la rilevazione di contaminanti si colloca al secondo posto nel segmento di utilizzo. Contaminanti organici e inorganici possono essere rilevati utilizzando l'XPS. L'analisi superficiale di metalli compositi, vetri, gas e liquidi fortemente assorbiti può essere eseguita utilizzando l'applicazione XPS.
Approfondimenti sulle applicazioni
Il segmento di applicazione in questo studio include sanità, aerospaziale, automobilistico e altri. Le applicazioni del mercato sanitario includono l'analisi di cellule/batteri/tessuti, la caratterizzazione di sostanze chimiche, l'immobilizzazione di anticorpi e lo studio di proteine e peptidi. Nel mercato dell'elettronica, l'XPS viene applicato per l'analisi e la caratterizzazione della composizione. L'XPS viene utilizzato per eseguire l'analisi di film superficiali nei mercati aerospaziale, automobilistico e del packaging.
Il segmento sanitario detiene la quota di mercato maggiore nel segmento delle applicazioni e si prevede che dominerà il mercato durante il periodo di previsione. L'elevata quota è dovuta alle rigide normative che limitano al minimo gli errori di medicazione e al livello consentito di contaminanti negli impianti medici.
La strategia di fusione e acquisizione è comunemente adottata dalle aziende per espandere la propria presenza a livello mondiale e soddisfare la crescente domanda. Questa strategia è più comunemente adottata dagli operatori del mercato per ampliare il proprio portafoglio prodotti.
Gli operatori del mercato che operano nel mercato della spettroscopia fotoelettronica a raggi X adottano la strategia di espansione e investimento in ricerca e sviluppo per ampliare la base clienti in tutto il mondo, il che consente loro anche di mantenere il proprio marchio a livello globale.
Approfondimenti regionali sul mercato della spettroscopia fotoelettronica a raggi X
Le tendenze regionali e i fattori che influenzano il mercato della spettroscopia fotoelettronica a raggi X durante il periodo di previsione sono stati ampiamente spiegati dagli analisti di The Insight Partners. Questa sezione illustra anche i segmenti e la geografia del mercato della spettroscopia fotoelettronica a raggi X in Nord America, Europa, Asia-Pacifico, Medio Oriente e Africa, America meridionale e centrale.
Ambito del rapporto di mercato sulla spettroscopia fotoelettronica a raggi X
Densità degli operatori del mercato della spettroscopia fotoelettronica a raggi X: comprendere il suo impatto sulle dinamiche aziendali
Il mercato della spettroscopia fotoelettronica a raggi X è in rapida crescita, trainato dalla crescente domanda degli utenti finali, dovuta a fattori quali l'evoluzione delle preferenze dei consumatori, i progressi tecnologici e una maggiore consapevolezza dei vantaggi del prodotto. Con l'aumento della domanda, le aziende stanno ampliando la propria offerta, innovando per soddisfare le esigenze dei consumatori e sfruttando le tendenze emergenti, alimentando ulteriormente la crescita del mercato.
- Ottieni il Mercato della spettroscopia fotoelettronica a raggi X Panoramica dei principali attori chiave
Mercato globale della spettroscopia fotoelettronica a raggi X - Per tipo di prodotto
- Spettroscopia fotoelettronica a raggi X monocromatica
- Spettroscopia fotoelettronica a raggi X non monocromatica
Mercato globale della spettroscopia fotoelettronica a raggi X - Per utilizzo
- Rilevamento di elementi
- Rilevamento di contaminazione
- Determinazione della formula empirica
- Stima della densità
- Altro
Mercato globale della spettroscopia fotoelettronica a raggi X - Per applicazione
- Sanità
- Aerospaziale
- Automotive
- Altro
Mercato della spettroscopia fotoelettronica a raggi X - Per area geografica
-
Nord America
- Stati Uniti
- Canada
- Messico
-
Europa
- Francia
- Germania
- Italia
- Regno Unito
- Russia
- Resto d'Europa
-
Asia Pacifico
- Cina
- India
- Corea del Sud
- Giappone
- Australia
- Resto dell'Asia Pacifico
-
Medio Oriente e Africa
- Sudafrica
- Arabia Saudita
- Emirati Arabi Uniti
- Resto del Medio Oriente e Africa
-
Sud America
- Brasile
- Argentina
- Resto del Sud America
Profili aziendali
- Shimadzu Corporation
- Physical Electronics, Inc.
- Thermo Fisher Scientific Inc
- Japan Electron Optics Laboratory Company, Limited
- Revera Inc.
- SPECS GmbH
- PREVAC
- Scienta Omicron
- Staib Instruments
- OCI Vacuum Microengineering Inc.

Mrinal è un'analista di ricerca esperta con oltre 8 anni di esperienza nella consulenza e nell'intelligence di mercato nel settore delle scienze biologiche. Grazie a una mentalità strategica e a un costante impegno verso l'eccellenza, ha maturato una profonda competenza nelle previsioni farmaceutiche, nella valutazione delle opportunità di mercato e nello sviluppo di benchmark di settore. Il suo lavoro è incentrato sulla fornitura di insight fruibili che consentono ai clienti di prendere decisioni strategiche consapevoli.
Il punto di forza di Mrinal risiede nella capacità di tradurre complessi set di dati quantitativi in business intelligence significative. Il suo acume analitico è fondamentale per definire strategie di go-to-market (GTM) e individuare opportunità di crescita nei settori farmaceutico e dei dispositivi medici. In qualità di consulente di fiducia, si concentra costantemente sulla semplificazione dei processi di flusso di lavoro e sulla definizione di best practice, promuovendo così l'innovazione e l'efficienza operativa per i suoi clienti.
- Analisi storica (2 anni), anno base, previsione (7 anni) con CAGR
- Analisi PEST e SWOT
- Valore/volume delle dimensioni del mercato - Globale, Regionale, Nazionale
- Industria e panorama competitivo
- Set di dati Excel
Testimonianze
Il report di mercato sui sistemi SCADA di Insight Partners è completo, con preziosi spunti sulle tendenze attuali e sulle previsioni future. Il team si è dimostrato altamente professionale, reattivo e disponibile in ogni fase del progetto. Siamo molto soddisfatti e consigliamo vivamente i loro servizi.
RAN KEDEM Partner, Reali Technologies LTDsHo richiesto un report su un mercato software molto specifico e il team lo ha prodotto in pochi giorni. Le informazioni erano molto pertinenti e ben presentate. Ho quindi richiesto alcune modifiche e aggiunte al report. Il team è stato ancora una volta molto reattivo e ho ricevuto il report finale in meno di una settimana.
JEAN-HERVE JENN Presidente, Future AnalyticaAbbiamo collaborato con The Insight Partners per un importante studio di mercato e una previsione. Ci hanno fornito informazioni chiare su opportunità e rischi, che ci hanno aiutato a definire i nostri piani. La loro ricerca è stata facile da usare e basata su dati solidi. Ci ha aiutato a prendere decisioni intelligenti e consapevoli. Li consigliamo vivamente.
PIYUSH NAGPAL Vicepresidente senior, Abbaglianti globaliInsight Partners ha fornito ricerche di mercato approfondite e ben strutturate, con una solida competenza nel settore. Il loro team si è dimostrato professionale e reattivo in ogni fase. Il sito web intuitivo ha reso l'accesso ai report di settore semplice e immediato. Li consigliamo vivamente per servizi di ricerca affidabili e di alta qualità.
YUKIHIKO ADACHI Amministratore delegato, Deep Blue, LLC.Questa è la prima volta che acquisto un report di mercato da The Insight Partners. Sebbene inizialmente fossi indeciso, ho visitato il loro sito web e mi sono sentito più a mio agio nell'acquistare un report di mercato. Sono completamente soddisfatto della qualità del report e del servizio clienti. Avevo diverse domande e commenti sul report iniziale, ma dopo un paio di conversazioni via email con il loro analista credo di avere un report che posso utilizzare come input per il nostro processo di pianificazione strategica. Grazie mille per aver dedicato del tempo extra e aver reso questa esperienza positiva. Consiglierò sicuramente il vostro servizio ad altri e sarete la mia prima persona a cui rivolgermi quando avremo bisogno di ulteriori dati di mercato.
GIOVANNI SUZUKI Presidente e Amministratore Delegato, Consigliere di Amministrazione, Tecnologie BKDesidero esprimere la mia gratitudine per il supporto e la professionalità dimostrati nel rispondere alla mia richiesta di informazioni sul mercato dei dispositivi medici in vitro per malattie infettive in Nigeria. Apprezzo la vostra pazienza, la vostra guida e la vostra disponibilità a offrirmi uno sconto, che alla fine ci ha permesso di concludere l'affare. Non vedo l'ora di collaborare con The Insight Partners in futuro, grazie anche all'impressione che mi avete lasciato dopo questo primo incontro.
Dott. Chijioke AMMINISTRATORE DELEGATO DI ONYIA, PineCrest Healthcare Ltd.Motivo dell'acquisto
- Processo decisionale informato
- Comprensione delle dinamiche di mercato
- Analisi competitiva
- Analisi dei clienti
- Previsioni di mercato
- Mitigazione del rischio
- Pianificazione strategica
- Giustificazione degli investimenti
- Identificazione dei mercati emergenti
- Miglioramento delle strategie di marketing
- Aumento dell'efficienza operativa
- Allineamento alle tendenze normative


Sblocca sconti esclusivi sui report
Richiedi ora


 Ottieni un campione gratuito per - Mercato della spettroscopia fotoelettronica a raggi X