3D計測市場レポート2031:セグメント、地域、動向、最近の動向、戦略的洞察
過去データ : 2021-2022 | 基準年 : 2023 | 予測期間 : 2024-20313D計測市場の規模と予測(2021年 - 2031年)、世界および地域別のシェア、トレンド、成長機会分析レポートの対象範囲:製品別[ハードウェア(座標測定機、光学デジタイザーおよびスキャナー、ビデオ測定機、3D自動光学検査など)、サービス、ソフトウェア]、アプリケーション(品質管理および検査、リバースエンジニアリング、仮想シミュレーションなど)、エンドユーザー(自動車、電子機器、航空宇宙および防衛、医療、エネルギーおよび電力、重機など)、および地域
- レポート日 : Apr 2024
- レポートコード : TIPEL00002719
- カテゴリー : エレクトロニクスおよび半導体
- ステータス : 出版
- 利用可能なレポート形式 :


- ページ数 : 209
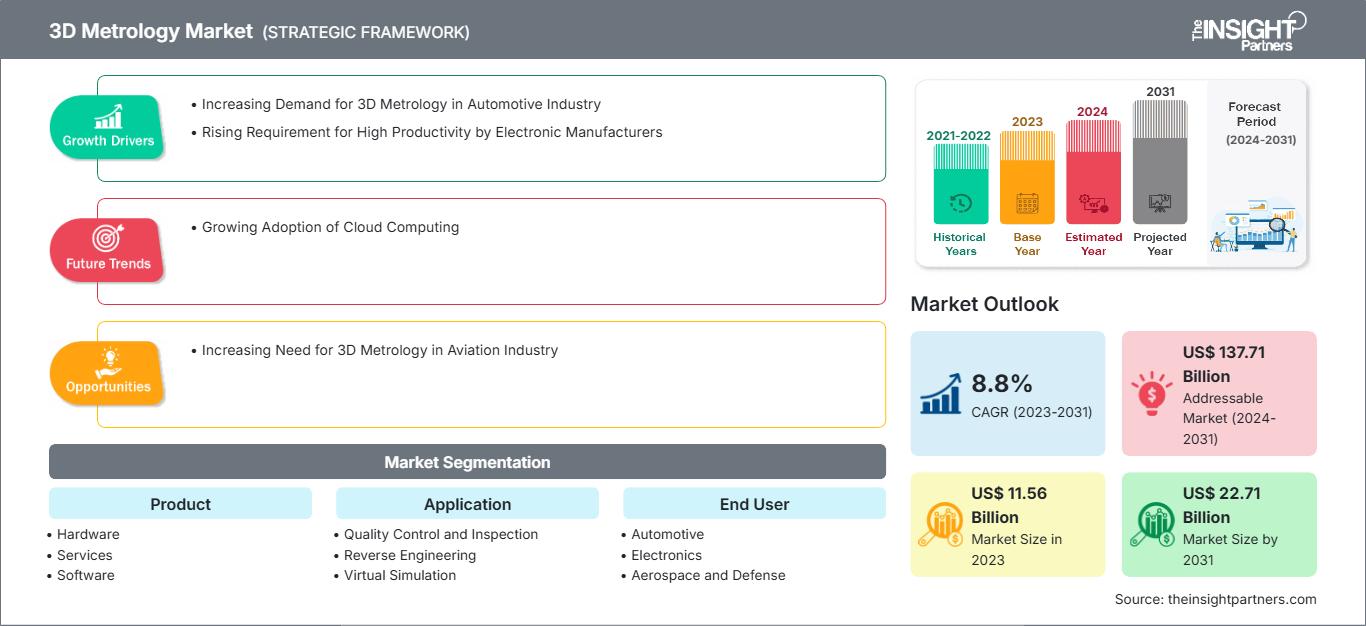
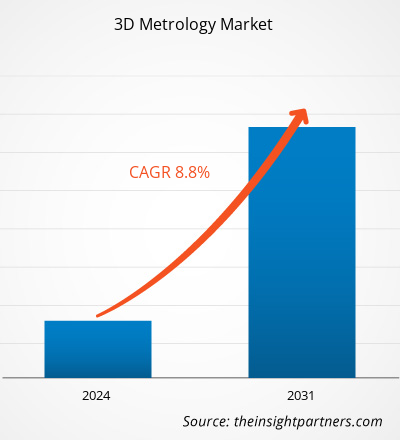
3D計測市場の規模は、2023年の115億6,000万米ドルから、2031年には227億1,000万米ドルに達すると予測されています。市場は2023年から2031年にかけて8.8%のCAGRを記録すると予想されています。クラウドコンピューティングの採用拡大は、3D計測市場の主要トレンドの1つであり続けると思われます。
3D計測市場分析
3D計測市場の予測は、主要企業の出版物、協会データ、データベースなど、さまざまな二次および一次調査結果に基づいて推定されています。3D計測は、物体の幾何学的形状の完全な3D表現を作成できる技術を採用した物理的測定の科学的研究です。3D計測では、非接触構造化青色光3Dスキャナー、触覚座標測定機(CMM)、コンピューター断層撮影(CT)など、さまざまな技術が使用されます。この3D計測装置は、物理的な部品から実際のデータを収集し、そのデータは3D計測ソフトウェアで品質管理、精度評価、そして様々な部品分析に使用されます。
3D計測市場の概要
3D計測は、品質管理やその他の製造・生産目的で使用される技術です。最も一般的で効率的なタイプの3D計測では、立体カメラを使用して部品を正確にスキャン・測定し、構造化された青色光を使用して不要な周囲光を除去します。これらのカメラは、部品に投影された干渉縞と三角測量技術を使用して、スキャン対象の部品の寸法を計算します。この技術は、試作、金型製作、機械加工、組み立てなど、さまざまな産業プロセスやエンジニアリングプロセスを可能にします。さらに、3D計測はコスト削減、生産性向上、そしてプロセスと製品の品質向上に役立ちます。
自動車業界では、高品質・高性能な製品とプロセスの提供に役立つため、3D計測の需要が高まっています。また、電子機器メーカーによる高生産性への需要の高まりとビッグデータ分析のニーズも、3D計測市場の成長に貢献しています。さらに、航空機部品の設計における高精度化を目的とした航空業界における3D計測の需要の高まりと、インダストリー4.0への需要の高まりが、予測期間中の市場成長を牽引すると予想されます。
要件に合わせてレポートをカスタマイズ
レポートの一部、国レベルの分析、Excelデータパックなどを含め、スタートアップ&大学向けに特別オファーや割引もご利用いただけます(無償)
3D計測市場: 戦略的洞察
-
このレポートの主要な市場動向を入手してください。この無料サンプルには、市場動向から見積もりや予測に至るまでのデータ分析が含まれます。
3D計測市場の推進要因と機会
電子機器メーカーによる高生産性要求の高まりが市場を後押し
スマートフォン、タブレット、ノートパソコン、ウェアラブルデバイス、家電製品などの電子機器は、日常生活に欠かせないものとなっています。電子機器の需要は世界中で継続的に増加しています。企業は、この高まる需要に対応するため、生産設備の自動化に取り組んでいます。自動化は厳格な安全規制に準拠し、優れたエネルギー効率と設計を提供し、工場の生産性を大幅に向上させるため、世界中で導入が進んでいます。さらに、自動化はプロセスコストの削減や、悪環境下における作業員の安全確保にも役立ちます。これらのメリットから、各国政府は工場の自動化に向けて様々な取り組みを行っています。例えば、2021年7月、英国政府はデジタル製造技術の開発を促進するため、5,930万米ドル(5,300万ポンド)の投資を発表しました。電子機器製造業界における自動化の進展に伴い、3D計測技術の需要が高まっています。この技術は、プロセス制御、製造全体の卓越性、製品品質にとって不可欠なものとなっているためです。3D計測は、スマート電子機器製造プロセスに統合されています。これは、出力を最大化し、全体的な効率を向上させるために、正確で実用的なリアルタイムデータが必要であるためです。この技術は、品質管理や検査にとどまらず、スマート電子機器製造における生産ライフサイクル全体に不可欠な要素となっています。設計、試作から製造、製造後の分析まで、あらゆるレベルでプロセスを監視および強化するための包括的なソリューションを提供します。このように、電子機器メーカーによる高生産性への需要の高まりが、世界中の3D計測市場の成長を後押ししています。
航空業界における3D計測のニーズの高まり - 3D計測の機会
航空機部品が直面する過酷な条件下では、小さな欠陥でさえも性能の大幅な低下につながる可能性があります。航空宇宙技術の進歩に伴い、精度に対するニーズが高まっています。わずかな変形でも航空機の全体的な性能に悪影響を与える可能性があるため、現代の技術はますます重要になっています。エンジニアは、部品の性能を最大限に保証できる高度な3D計測技術の助けを借りて、ナノスケールまでの表面欠陥の監視に定期的に取り組んでいます。航空機の翼型は3D計測技術を使用して測定できます。この場合、エンジニアは青色光スキャンやニコンのレーザーベースAPDISなどの他の光学計測技術を使用して、最小の翼型であっても厚さとキャンバーを正確に測定できます。また、部品本体全体にわたって厚さとキャンバーがどのように変動するかを調べることもできます。これにより、製造者は翼型の前縁の摩耗を特定できます。これらの欠陥は部品の性能に悪影響を与える可能性があるため、これらの欠陥を減らすことは部品の挙動を改善します。さらに、計測技術は航空機のエンジン性能を向上させるために利用できます。エンジンのファンとタービンブレードを解析することは、翼型を測定するのと同様に、推力生成を最大化するのに役立ちます。さらに、エンジンハウジングの構造には改善の余地があります。エンジンの形状への小さな変更は重要ではないように見えるかもしれませんが、気流に直接影響を与え、ひいてはエンジン効率に影響を与えます。したがって、航空業界における3D計測の需要の高まりは、予測期間中に3D計測市場の成長機会を生み出すと予想されます。
3D計測市場レポートのセグメンテーション分析
3D計測市場分析の導出に貢献した主要なセグメントは、製品、アプリケーション、およびエンドユーザーです。
- 製品に基づいて、3D計測市場はハードウェア、ソフトウェア、およびサービスに分類されます。座標測定機、光学デジタイザーおよびスキャナー、ビデオ測定機、3D自動光学検査などは、ハードウェアの主要なサブセグメントです。 2023年には、ハードウェアセグメントが最大の市場シェアを占めました。
- アプリケーション別に見ると、市場はリバースエンジニアリング、品質管理と検査、仮想シミュレーションなどに細分化されています。2023年には、品質管理と検査セグメントが最大の市場シェアを占めました。
- エンドユーザー別に見ると、市場は自動車、エレクトロニクス、航空宇宙と防衛、医療、エネルギーと電力、重機などに分かれています。2023年には、自動車セグメントが市場を支配しました。
地域別の3D計測市場シェア分析
3D計測市場レポートの地理的範囲は、主に北米、アジア太平洋、ヨーロッパ、中東およびアフリカ、南米および中米の5つの地域に分かれています。
3D計測市場シェアはアジア太平洋地域が独占しています。中国は世界最大の製造拠点です。中国は、スマートフォン、コンピューター、クラウドサーバー、通信インフラなど、世界の電子機器の約36%を生産しています。さらに、中国は米国に次ぐ電子機器の最終消費市場でもあります。また、タブレット、スマートフォン、ドローン、その他の電子製品の輸出増加により、電子部品の検査と分析、および欠陥の発見に役立つ3D計測のニーズが高まっています。さらに、中国は世界最大級のEV製造国の一つで、EVの強固な製造基盤を有しています。国際クリーン交通評議会(ICCT)の報告書によると、中国の電気バスの車両数は40万台を超えています。また、中国の工業都市である深センでは、車両が完全に電動化されています。さらに、中国にあるBYDの主要製造工場では、90秒ごとに電気自動車が組み立てられています。また、2022年2月、フォルクスワーゲンは2023年から中国で毎年100万台のEVを製造する計画を発表しました。したがって、EVの採用と生産の増加は、予測期間中に中国の3D計測市場の成長を促進すると予想されます。
3D計測市場のニュースと最近の開発
3D計測市場は、重要な企業の出版物、協会データ、データベースを含む一次および二次調査後の定性的および定量的データを収集することによって評価されます。以下は、3D計測市場の動向のリストです。
- 中国杭州市のShining 3D Tech. Co., Ltd.は、小型で複雑な部品のスキャンの効率を向上させるように設計された、高精度3Dスキャンと3D検査を統合できる自動デスクトップ3D検査システム、AutoScan-Inspecを発売しました。 (出典:Shining 3D Tech Co Ltd、プレスリリース、2020年)
- キーエンス株式会社は、3D光学式表面形状測定機「VR-6000」の発売を発表しました。この高精度測定システムは、電動回転ユニットを内蔵しており、死角を気にすることなく、部品の円周を3D測定できます。(出典:キーエンス株式会社、プレスリリース/企業ウェブサイト/ニュースレター、2022年)
3D計測市場の地域別分析
予測期間を通じて3D計測市場に影響を与える地域的な傾向と要因については、The Insight Partnersのアナリストが詳細に解説しています。このセクションでは、北米、ヨーロッパ、アジア太平洋、中東・アフリカ、中南米における3D計測市場のセグメントと地域についても解説しています。
3D計測市場レポートの範囲
| レポート属性 | 詳細 |
|---|---|
| の市場規模 2023 | US$ 11.56 Billion |
| 市場規模別 2031 | US$ 22.71 Billion |
| 世界的なCAGR (2023 - 2031) | 8.8% |
| 過去データ | 2021-2022 |
| 予測期間 | 2024-2031 |
| 対象セグメント |
By 製品
|
| 対象地域と国 |
北米
|
| 市場リーダーと主要企業の概要 |
|
3D計測市場のプレーヤー密度:ビジネスダイナミクスへの影響を理解する
3D計測市場は、消費者の嗜好の変化、技術の進歩、製品メリットへの認知度の高まりといった要因によるエンドユーザーの需要増加に牽引され、急速に成長しています。需要の増加に伴い、企業は製品ラインナップの拡充、消費者ニーズへの対応のためのイノベーション、そして新たなトレンドの活用を進めており、これが市場の成長をさらに加速させています。
- 入手 3D計測市場 主要プレーヤーの概要
3D計測市場レポートの対象範囲と成果物
「3D計測市場の規模と予測(2023~2031年)」レポートは、以下の分野を網羅した詳細な市場分析を提供します。
- 調査対象となるすべての主要市場セグメントの世界、地域、国レベルでの市場規模と予測
- 市場の動向(推進要因、制約要因、主要な機会など)
- 主要な将来の傾向
- 詳細なPEST/ポーターの5つの力とSWOT分析
- 主要な市場動向、主要プレーヤー、規制、最近の市場動向を網羅した世界および地域の市場分析
- 市場集中度、ヒートマップ分析、主要プレーヤー、最近の動向を網羅した業界展望と競争分析
- 詳細な企業プロファイル

Naveenは、カスタム、シンジケート、コンサルティングの各プロジェクトにおいて9年以上の実績を持つ、経験豊富な市場調査およびコンサルティングのプロフェッショナルです。現在はアソシエイトバイスプレジデントを務め、プロジェクトバリューチェーン全体にわたるステークホルダー管理を成功させ、100件以上の調査レポートと30件以上のコンサルティング案件を執筆しています。産業および政府機関のプロジェクトに幅広く携わり、クライアントの成功とデータに基づく意思決定に大きく貢献しています。
Naveenは、カルナータカ州VTUで電子通信工学の学位を取得し、マニパル大学でマーケティング&オペレーションズのMBAを取得しています。IEEEの会員として9年間活動し、会議や技術シンポジウムへの参加、セクションレベルおよび地域レベルでのボランティア活動に積極的に取り組んでいます。現職以前は、IndustryARCでアソシエイト戦略コンサルタント、Hewlett Packard(HP Global)で産業用サーバーコンサルタントを務めていました。
- 過去2年間の分析、基準年、CAGRによる予測(7年間)
- PEST分析とSWOT分析
- 市場規模価値/数量 - 世界、地域、国
- 業界と競争環境
- Excel データセット
最新レポート
関連レポート
お客様の声
Insight PartnersのSCADAシステム市場レポートは包括的で、現在のトレンドと将来の予測に関する貴重な洞察が含まれています。チームは終始、非常にプロフェッショナルで、対応が早く、サポートも充実していました。私たちは彼らのサービスに非常に満足しており、強くお勧めします。
ラン・ケデム パートナー, レアリテクノロジーズ株式会社非常に特殊なソフトウェア市場に関するレポートを依頼したところ、チームは数日でレポートを作成してくれました。情報は非常に関連性が高く、分かりやすくまとめられていました。その後、レポートにいくつか修正と追加を依頼しましたが、チームは非常に迅速に対応し、1週間も経たないうちに最終レポートを受け取ることができました。
ジャン=エルヴェ・ジェン 会長, フューチャー・アナリティカ重要な市場調査と予測のために、The Insight Partnersと協力しました。彼らは機会とリスクに関する明確な洞察を提供し、私たちの計画策定に役立ちました。彼らの調査は使いやすく、確かなデータに基づいており、賢明で自信に満ちた意思決定に役立ちました。彼らを強くお勧めします。
ピユーシュ・ナグパル 上級副社長, ハイビームグローバルInsight Partnersは、深い専門知識に基づき、洞察力に富み、構造化された市場調査を提供しました。チームは終始プロフェッショナルで、対応力も抜群でした。ユーザーフレンドリーなウェブサイトにより、業界レポートへのアクセスもスムーズでした。信頼性の高い高品質な調査サービスをお探しなら、Insight Partnersを強くお勧めします。
安達幸彦 最高経営責任者(CEO), ディープブルーLLC。The Insight Partnersから市場レポートを購入するのは今回が初めてです。最初は不安でしたが、ウェブサイトを見て、リスクを負ってでも購入してみようという気持ちになりました。レポートの品質とカスタマーサービスには大変満足しています。最初のレポートにはいくつか質問やコメントがありましたが、アナリストとメールで何度かやり取りした結果、戦略策定プロセスへのインプットとして活用できるレポートが完成しました。貴重なお時間を割いていただき、貴重な体験をさせていただき、誠にありがとうございました。他の方にもぜひお勧めしたいですし、今後さらに市場データが必要になった際には、まずThe Insight Partnersにご連絡させていただきます。
ジョン・スズキ 社長兼最高経営責任者、取締役, BKテクノロジーズナイジェリアの感染症IVD市場に関する情報提供依頼に対し、ご対応いただいた際、ご尽力とプロフェッショナルな姿勢に深く感謝申し上げます。忍耐強く、的確なアドバイスをいただき、また、最終的に取引成立に至った割引のご提供にも深く感謝申し上げます。今回の最初の出会いで得た強い印象のおかげで、今後もThe Insight Partnersとの連携を心待ちにしております。
チジオケ博士 オニア マネージングディレクター, パインクレストヘルスケア株式会社購入理由
- 情報に基づいた意思決定
- 市場動向の理解
- 競合分析
- 顧客インサイト
- 市場予測
- リスク軽減
- 戦略計画
- 投資の正当性
- 新興市場の特定
- マーケティング戦略の強化
- 業務効率の向上
- 規制動向への対応


 無料サンプルを入手 - 3D計測市場