3D-Messtechnik-Marktbericht 2031 nach Segmenten, Geografie, Dynamik, jüngsten Entwicklungen und strategischen Erkenntnissen
Historische Daten : 2021-2022 | Basisjahr : 2023 | Prognosezeitraum : 2024-2031Marktgröße und Prognose für 3D-Messtechnik (2021 – 2031), Berichtsabdeckung für globale und regionale Anteils-, Trend- und Wachstumschancenanalyse: Nach Produkt [Hardware (Koordinatenmessgerät, optischer Digitalisierer und Scanner, Videomessgerät, automatisierte optische 3D-Inspektion und andere), Dienstleistungen und Software], Anwendung (Qualitätskontrolle und -inspektion, Reverse Engineering, virtuelle Simulation und andere), Endbenutzer (Automobilindustrie, Elektronik, Luft- und Raumfahrt und Verteidigung, Medizin, Energie und Strom, Schwermaschinen und andere) und Geografie
- Status : Veröffentlicht
- Berichtscode : TIPEL00002719
- Kategorie : Elektronik und Halbleiter
- Anzahl der Seiten : 209
- Verfügbare Berichtsformate :


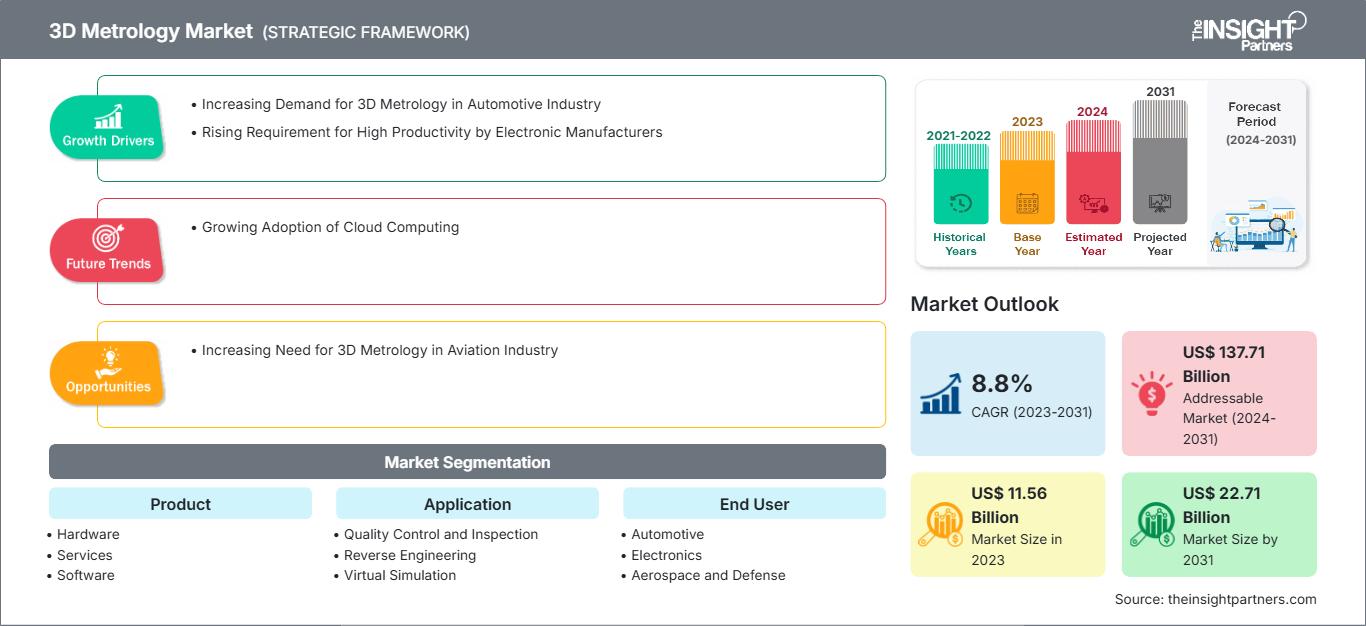
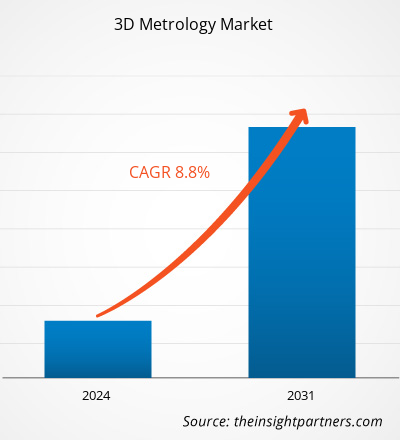
Der Markt für 3D-Messtechnik soll von 11,56 Milliarden US-Dollar im Jahr 2023 auf 22,71 Milliarden US-Dollar im Jahr 2031 anwachsen. Für den Markt wird von 2023 bis 2031 eine durchschnittliche jährliche Wachstumsrate (CAGR) von 8,8 % erwartet. Die zunehmende Nutzung von Cloud Computing wird voraussichtlich einer der wichtigsten Trends auf dem Markt für 3D-Messtechnik bleiben.
Marktanalyse für 3D-Messtechnik
Die Marktprognose für 3D-Messtechnik basiert auf verschiedenen sekundären und primären Forschungsergebnissen, wie z. B. wichtigen Unternehmensveröffentlichungen, Verbandsdaten und Datenbanken. 3D-Messtechnik ist die wissenschaftliche Untersuchung physikalischer Messungen mithilfe von Technologien, die eine vollständige 3D-Darstellung der geometrischen Form eines Objekts ermöglichen. Die 3D-Messtechnik verwendet verschiedene Technologien, darunter berührungslose strukturierte 3D-Scanner mit blauem Licht, taktile Koordinatenmessgeräte (KMGs) und Computertomographie (CT). Diese 3D-Messtechnik sammelt tatsächliche Daten von physischen Komponenten, die dann in 3D-Messtechnik-Software zur Qualitätskontrolle, Genauigkeitsbewertung und zahlreichen Teileanalysen verwendet werden.
Marktübersicht 3D-Messtechnik
3D-Messtechnik ist eine Technologie, die zur Qualitätskontrolle und anderen Herstellungs- oder Produktionszwecken eingesetzt wird. Bei der gängigsten und effizientesten Art der 3D-Messtechnik werden stereoskopische Kameras zum präzisen Scannen und Vermessen des Teils sowie strukturiertes blaues Licht zum Herausfiltern unerwünschter Umgebungsbeleuchtung verwendet. Diese Kameras verwenden auf das Teil projizierte Streifenmuster zusammen mit der Triangulationstechnik, um die Abmessungen des gescannten Teils zu berechnen. Die Technologie ermöglicht eine Vielzahl von industriellen und technischen Prozessen, darunter Prototyping, Werkzeugbau, Bearbeitung und Montage. Darüber hinaus kann 3D-Messtechnik dazu beitragen, Kosten zu senken, die Produktivität zu steigern und die Qualität von Prozessen und Produkten zu verbessern.
In der Automobilindustrie steigt die Nachfrage nach 3D-Messtechnik, da sie zur Bereitstellung hochwertiger und leistungsstarker Produkte und Prozesse beiträgt. Auch die steigende Nachfrage nach hoher Produktivität seitens der Elektronikhersteller und der Bedarf an Big-Data-Analysen tragen zum Wachstum des 3D-Messtechnikmarktes bei. Darüber hinaus dürften der zunehmende Bedarf an 3D-Messtechnik in der Luftfahrtindustrie für die hochpräzise Konstruktion von Flugzeugkomponenten und die steigende Nachfrage nach Industrie 4.0 das Marktwachstum im Prognosezeitraum vorantreiben.
Passen Sie diesen Bericht Ihren Anforderungen an
Sie erhalten kostenlos Anpassungen an jedem Bericht, einschließlich Teilen dieses Berichts oder einer Analyse auf Länderebene, eines Excel-Datenpakets sowie tolle Angebote und Rabatte für Start-ups und Universitäten.
Markt für 3D-Messtechnik: Strategische Einblicke
-
Holen Sie sich die wichtigsten Markttrends aus diesem Bericht.Dieses KOSTENLOSE Beispiel umfasst Datenanalysen, die von Markttrends bis hin zu Schätzungen und Prognosen reichen.
Markttreiber und -chancen für 3D-Messtechnik
Steigende Anforderungen der Elektronikhersteller an hohe Produktivität begünstigen den Markt
Elektronische Geräte – darunter Smartphones, Tablets, Laptops, Wearables und Haushaltsgeräte – sind aus dem täglichen Leben nicht mehr wegzudenken. Die Nachfrage nach elektronischen Geräten steigt weltweit kontinuierlich an. Unternehmen arbeiten an der Automatisierung ihrer Produktionsanlagen, um dieser steigenden Nachfrage gerecht zu werden. Da die Automatisierung strengen Sicherheitsvorschriften folgt und eine höhere Energieeffizienz und ein besseres Design bietet, was zu herausragenden Produktionsniveaus in Fabriken führt, wird sie weltweit zunehmend eingesetzt. Darüber hinaus trägt die Automatisierung dazu bei, die Prozesskosten zu senken und die Sicherheit der Arbeiter in widrigen Umgebungen zu gewährleisten. Aufgrund dieser Vorteile ergreifen Regierungen verschiedener Länder Initiativen zur Automatisierung von Fabriken. So kündigte die britische Regierung im Juli 2021 eine Investition von 59,3 Millionen US-Dollar (53 Millionen GBP) an, um die Entwicklung digitaler Fertigungstechnologien voranzutreiben. Diese zunehmende Automatisierung in der Elektronikfertigungsbranche erhöht die Nachfrage nach 3D-Messtechnik, da diese Technologie für die Prozesssteuerung, die allgemeine Fertigungsqualität und die Produktqualität unverzichtbar geworden ist. 3D-Messtechnik wurde in intelligente Elektronikfertigungsprozesse integriert, da präzise, umsetzbare Echtzeitdaten erforderlich sind, um den Output zu maximieren und die Gesamteffizienz zu verbessern. Die Technologie ist zu einem wesentlichen Bestandteil des gesamten Produktionslebenszyklus in der intelligenten Elektronikfertigung geworden und geht über Qualitätskontrolle und -prüfung hinaus. Sie bietet eine Komplettlösung zur Überwachung und Verbesserung von Prozessen auf jeder Ebene, von Design und Prototyp bis hin zur Produktion und Analyse nach der Fertigung. Somit fördert die steigende Nachfrage der Elektronikhersteller nach hoher Produktivität das Wachstum des 3D-Messtechnikmarktes weltweit.
Steigender Bedarf an 3D-Messtechnik in der Luftfahrtindustrie – Chance in der 3D-Messtechnik
Unter den rauen Bedingungen, denen Flugzeugkomponenten ausgesetzt sind, können selbst kleine Fehler zu erheblichen Leistungseinbußen führen. Der Bedarf an Präzision wächst mit dem Fortschritt der Luft- und Raumfahrttechnologie. Moderne Technologie wird immer wichtiger, da selbst geringe Verformungen die Gesamtleistung eines Flugzeugs negativ beeinflussen können. Ingenieure arbeiten regelmäßig daran, Oberflächendefekte bis in den Nanobereich mithilfe fortschrittlicher 3D-Messtechnik zu überwachen, um die maximale Leistung ihrer Komponenten zu gewährleisten. Das Tragflächenprofil eines Flugzeugs kann mithilfe von 3D-Messtechnik vermessen werden. Dabei können Ingenieure die Dicke und Wölbung selbst kleinster Tragflächenprofile mithilfe von Blaulichtscans oder anderen optischen Messtechniken wie Nikons laserbasiertem APDIS präzise messen. Sie können auch untersuchen, wie Dicke und Wölbung über den gesamten Bauteilkörper schwanken. Auf diese Weise können die Hersteller Verschleiß an der Vorderkante des Tragflächenprofils erkennen. Die Reduzierung dieser Fehler verbessert das Verhalten des Bauteils, da sie dessen Leistung beeinträchtigen können. Darüber hinaus kann die Messtechnik zur Leistungssteigerung von Flugzeugtriebwerken eingesetzt werden. Die Analyse der Fan- und Turbinenschaufeln des Triebwerks trägt ähnlich wie die Vermessung des Tragflächenprofils zur Maximierung der Schuberzeugung bei. Darüber hinaus besteht Verbesserungsbedarf bei der Struktur des Triebwerksgehäuses. Auch wenn winzige Änderungen an der Geometrie des Triebwerks unbedeutend erscheinen mögen, haben sie einen direkten Einfluss auf den Luftstrom, der wiederum die Effizienz des Triebwerks beeinflusst. Daher wird erwartet, dass der wachsende Bedarf an 3D-Messtechnik in der Luftfahrtindustrie im Prognosezeitraum eine Chance für das Wachstum des 3D-Messtechnikmarktes schafft.
Segmentierungsanalyse des 3D-Messtechnikmarktberichts
Wichtige Segmente, die zur Ableitung der 3D-Messtechnikmarktanalyse beigetragen haben, sind Produkt, Anwendung und Endbenutzer.
- Basierend auf dem Produkt ist der 3D-Messtechnikmarkt in Hardware, Software und Dienstleistungen unterteilt. Koordinatenmessgeräte, optische Digitalisierer und Scanner, Videomessgeräte, automatisierte optische 3D-Inspektion und andere sind wichtige Untersegmente der Hardware. Das Hardwaresegment hielt 2023 den größten Marktanteil.
- Nach Anwendung ist der Markt in Reverse Engineering, Qualitätskontrolle und -inspektion, virtuelle Simulation und andere segmentiert. Das Segment Qualitätskontrolle und Inspektion hatte 2023 den größten Marktanteil.
- In Bezug auf die Endverbraucher ist der Markt in die Bereiche Automobil, Elektronik, Luft- und Raumfahrt und Verteidigung, Medizin, Energie und Strom, Schwermaschinen und Sonstige unterteilt. Das Automobilsegment dominierte den Markt im Jahr 2023.
3D-Messtechnik-Marktanteilsanalyse nach Geografie
Der geografische Umfang des 3D-Messtechnik-Marktberichts ist hauptsächlich in fünf Regionen unterteilt: Nordamerika, Asien-Pazifik, Europa, Naher Osten und Afrika sowie Süd- und Mittelamerika.
Der Asien-Pazifik-Raum hat den Marktanteil der 3D-Messtechnik dominiert. China ist das weltweit größte Produktionszentrum; es produziert ca. 36 % der weltweiten Elektronik, darunter Smartphones, Computer, Cloud-Server und Telekommunikationsinfrastruktur. Darüber hinaus ist China nach den USA auch der zweitgrößte Endverbrauchermarkt für elektronische Geräte. Der wachsende Export von Tablets, Smartphones, Drohnen und anderen elektronischen Produkten erhöht den Bedarf an 3D-Messtechnik, da diese bei der Prüfung und Analyse elektronischer Komponenten sowie der Erkennung etwaiger Defekte hilft. China ist außerdem einer der größten Elektrofahrzeughersteller der Welt und verfügt über eine solide Produktionsbasis für Elektrofahrzeuge. Laut einem Bericht des International Council on Clean Transportation (ICCT) umfasst die Flotte der Elektrobusse des Landes über 400.000 Fahrzeuge. Auch Shenzhen, die Industriestadt Chinas, hat seine Flotte vollständig elektrifiziert. Im Hauptwerk von BYD in China wird zudem alle 90 Sekunden ein Elektroauto montiert. Außerdem kündigte Volkswagen im Februar 2022 seinen Plan an, ab 2023 jährlich eine Million Elektrofahrzeuge in China zu bauen. Daher wird erwartet, dass die zunehmende Verbreitung und Produktion von Elektrofahrzeugen das Wachstum des Marktes für 3D-Messtechnik in China im Prognosezeitraum ankurbeln wird.
Neuigkeiten und aktuelle Entwicklungen auf dem Markt für 3D-Messtechnik
Der Markt für 3D-Messtechnik wird durch die Erhebung qualitativer und quantitativer Daten aus Primär- und Sekundärforschung bewertet, die wichtige Unternehmenspublikationen, Verbandsdaten und Datenbanken umfassen. Im Folgenden finden Sie eine Liste der Entwicklungen auf dem Markt für 3D-Messtechnik:
- Shining 3D Tech. Co., Ltd., Hangzhou, China, hat AutoScan-Inspec auf den Markt gebracht, ein automatisches Desktop-3D-Inspektionssystem, das hochpräzises 3D-Scannen und 3D-Inspektion integrieren kann und die Effizienz des Scannens kleiner und komplexer Teile verbessern soll. (Quelle: Shining 3D Tech Co Ltd, Pressemitteilung, 2020)
- Keyence Corporation hat die Veröffentlichung des optischen 3D-Profilometers VR-6000 angekündigt. Dieses hochpräzise Messsystem verfügt über eine integrierte motorisierte Rotationseinheit, die es Anwendern ermöglicht, 3D-Messungen rund um ihr Werkstück durchzuführen, ohne sich um tote Winkel sorgen zu müssen. (Quelle: Keyence Corporation, Pressemitteilung/Unternehmenswebsite/Newsletter, 2022)
3D-Messtechnik
Regionale Einblicke in den 3D-MesstechnikmarktDie Analysten von The Insight Partners haben die regionalen Trends und Faktoren, die den Markt für 3D-Messtechnik im Prognosezeitraum beeinflussen, ausführlich erläutert. In diesem Abschnitt werden auch die Marktsegmente und die geografische Verteilung der 3D-Messtechnik in Nordamerika, Europa, dem asiatisch-pazifischen Raum, dem Nahen Osten und Afrika sowie Süd- und Mittelamerika erläutert.
Umfang des Marktberichts zur 3D-Messtechnik
| Berichtsattribut | Einzelheiten |
|---|---|
| Marktgröße in 2023 | US$ 11.56 Billion |
| Marktgröße nach 2031 | US$ 22.71 Billion |
| Globale CAGR (2023 - 2031) | 8.8% |
| Historische Daten | 2021-2022 |
| Prognosezeitraum | 2024-2031 |
| Abgedeckte Segmente |
By Produkt
|
| Abgedeckte Regionen und Länder |
Nordamerika
|
| Marktführer und wichtige Unternehmensprofile |
|
Dichte der Marktteilnehmer im Bereich 3D-Messtechnik: Verständnis ihrer Auswirkungen auf die Geschäftsdynamik
Der Markt für 3D-Messtechnik wächst rasant. Die steigende Nachfrage der Endnutzer ist auf Faktoren wie veränderte Verbraucherpräferenzen, technologische Fortschritte und ein stärkeres Bewusstsein für die Produktvorteile zurückzuführen. Mit der steigenden Nachfrage erweitern Unternehmen ihr Angebot, entwickeln Innovationen, um den Bedürfnissen der Verbraucher gerecht zu werden, und nutzen neue Trends, was das Marktwachstum weiter ankurbelt.
- Holen Sie sich die Markt für 3D-Messtechnik Übersicht der wichtigsten Akteure
Abdeckung und Ergebnisse des 3D-Messtechnik-Marktberichts
Der Bericht „3D-Messtechnik-Marktgröße und -prognose (2023–2031)“ bietet eine detaillierte Analyse des Marktes und deckt die unten aufgeführten Bereiche ab:
- Marktgröße und -prognose auf globaler, regionaler und Länderebene für alle abgedeckten wichtigen Marktsegmente
- Marktdynamik wie Treiber, Einschränkungen und wichtige Chancen
- Wichtige zukünftige Trends
- Detaillierte PEST/Porters Five Forces- und SWOT-Analyse
- Globale und regionale Marktanalyse mit wichtigen Markttrends, wichtigen Akteuren, Vorschriften und aktuellen Marktentwicklungen
- Branchenlandschaft und Wettbewerbsanalyse mit Marktkonzentration, Heatmap-Analyse, prominenten Akteuren und aktuellen Entwicklungen
- Detaillierte Unternehmensprofile

Naveen ist ein erfahrener Marktforschungs- und Beratungsexperte mit über 9 Jahren Erfahrung in kundenspezifischen, syndizierten und Beratungsprojekten. In seiner aktuellen Funktion als Associate Vice President hat er erfolgreich Stakeholder entlang der gesamten Projektwertschöpfungskette gemanagt und ist Autor von über 100 Forschungsberichten und über 30 Beratungsaufträgen. Seine Arbeit erstreckt sich auf Industrie- und Regierungsprojekte und trägt maßgeblich zum Kundenerfolg und zur datengesteuerten Entscheidungsfindung bei.
Naveen hat einen Ingenieursabschluss in Elektronik und Kommunikation von der VTU, Karnataka, und einen MBA in Marketing und Operations von der Manipal University. Er ist seit 9 Jahren aktives IEEE-Mitglied und nimmt an Konferenzen und technischen Symposien teil und engagiert sich ehrenamtlich auf Sektions- und regionaler Ebene. Vor seiner aktuellen Position arbeitete er als Associate Strategic Consultant bei IndustryARC und als Industrial Server Consultant bei Hewlett Packard (HP Global).
- Historische Analyse (2 Jahre), Basisjahr, Prognose (7 Jahre) mit CAGR
- PEST- und SWOT-Analyse
- Marktgröße Wert/Volumen – Global, Regional, Land
- Branchen- und Wettbewerbslandschaft
- Excel-Datensatz
Erfahrungsberichte
Der SCADA-Systemmarktbericht von Insight Partners ist umfassend und bietet wertvolle Einblicke in aktuelle Trends und Zukunftsprognosen. Das Team war durchweg hochprofessionell, reaktionsschnell und hilfsbereit. Wir sind sehr zufrieden und können die Dienstleistungen wärmstens empfehlen.
RAN KEDEM Partner, Reali Technologies LTDsIch habe einen Bericht über einen sehr spezifischen Softwaremarkt angefordert, und das Team hat ihn innerhalb weniger Tage erstellt. Die Informationen waren sehr relevant und gut präsentiert. Anschließend habe ich einige Änderungen und Ergänzungen zum Bericht angefordert. Das Team reagierte erneut sehr schnell, und ich erhielt den Abschlussbericht in weniger als einer Woche.
JEAN-HERVE JENN Vorsitzende, Future AnalyticaWir haben mit The Insight Partners für eine wichtige Marktstudie und Prognose zusammengearbeitet. Sie gaben uns klare Einblicke in Chancen und Risiken, die uns bei der Gestaltung unserer Pläne halfen. Ihre Recherchen waren benutzerfreundlich und basierten auf soliden Daten. Sie halfen uns, kluge und sichere Entscheidungen zu treffen. Wir können sie wärmstens empfehlen.
PIYUSH NAGPAL Sr. Vizepräsident, Fernlicht GlobalDie Insight Partners lieferten aufschlussreiche, gut strukturierte Marktforschung mit fundierter Fachkompetenz. Ihr Team war durchweg professionell und reaktionsschnell. Die benutzerfreundliche Website ermöglichte den Zugriff auf Branchenberichte. Wir empfehlen sie wärmstens für zuverlässige und hochwertige Forschungsdienstleistungen.
YUKIHIKO ADACHI Geschäftsführer, Deep Blue, LLC.Dies ist das erste Mal, dass ich einen Marktbericht von The Insight Partners erworben habe. Obwohl ich zunächst unsicher war, besuchte ich die Website und fühlte mich dann sicherer, das Risiko einzugehen und einen Marktbericht zu kaufen. Ich bin mit der Qualität des Berichts und dem Kundenservice rundum zufrieden. Ich hatte einige Fragen und Anmerkungen zum ersten Bericht, aber nach einigen E-Mail-Gesprächen mit dem Analysten bin ich überzeugt, dass ich einen Bericht habe, den ich als Input für unseren strategischen Planungsprozess verwenden kann. Vielen Dank, dass Sie sich die Zeit genommen und dies zu einer positiven Erfahrung gemacht haben. Ich werde Ihren Service auf jeden Fall weiterempfehlen und Sie werden meine erste Anlaufstelle sein, wenn wir weitere Marktdaten benötigen.
JOHN SUZUKI Präsident und Chief Executive Officer, Vorstandsmitglied, BK TechnologiesIch möchte mich für Ihre Unterstützung und die Professionalität bedanken, die Sie bei der Bearbeitung meiner Informationsanfrage zum IVD-Markt für Infektionskrankheiten in Nigeria gezeigt haben. Ich schätze Ihre Geduld, Ihre Beratung und die Tatsache, dass Sie bereit waren, einen Rabatt anzubieten, der uns schließlich den Abschluss eines Geschäfts ermöglichte. Ich freue mich darauf, The Insight Partners in Zukunft wieder zu beauftragen, dank des Eindrucks, den Sie bei dieser ersten Begegnung bei mir hinterlassen haben.
DR. CHIJIOKE ONYIA GESCHÄFTSFÜHRERIN, PineCrest Healthcare Ltd.Grund zum Kauf
- Fundierte Entscheidungsfindung
- Marktdynamik verstehen
- Wettbewerbsanalyse
- Kundeneinblicke
- Marktprognosen
- Risikominimierung
- Strategische Planung
- Investitionsbegründung
- Identifizierung neuer Märkte
- Verbesserung von Marketingstrategien
- Steigerung der Betriebseffizienz
- Anpassung an regulatorische Trends


Exklusive Berichtsrabatte freischalten
Jetzt anfragen


 Kostenlose Probe anfordern für - Markt für 3D-Messtechnik