エアフローセンサー市場戦略、トッププレーヤー、成長機会、分析、2030年までの予測
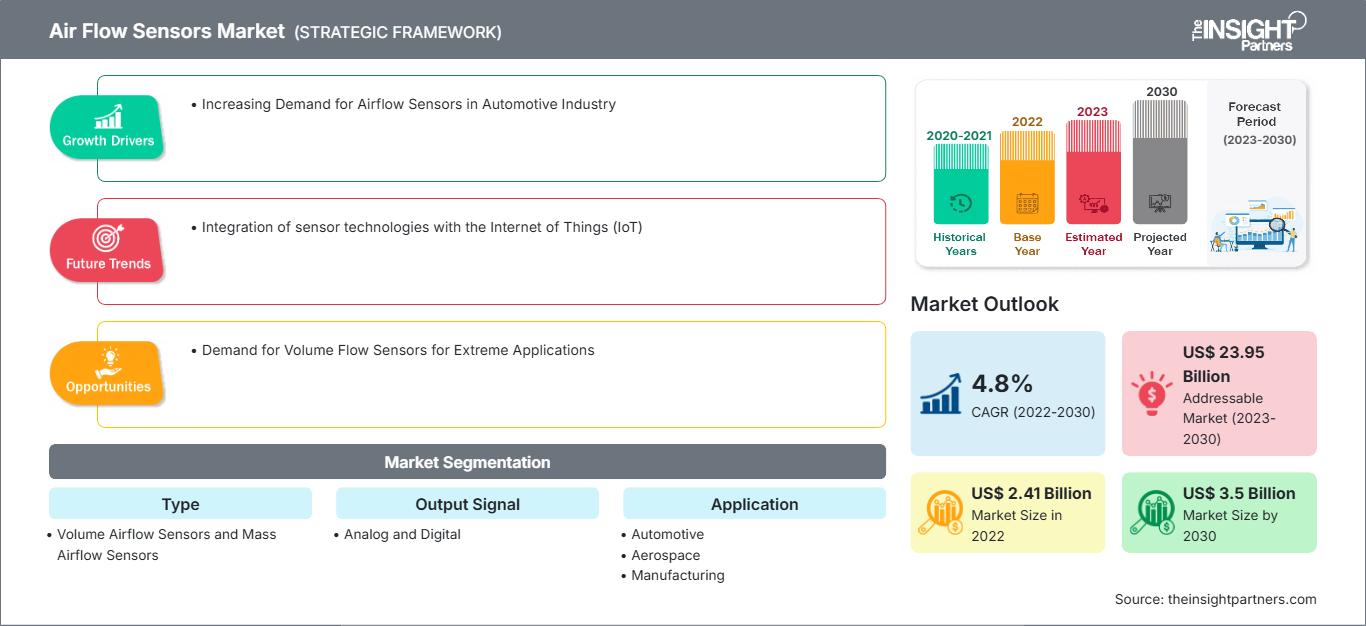
過去データ : 2020-2021 | 基準年 : 2022 | 予測期間 : 2023-2030エアフローセンサー市場規模と予測(2020年 - 2030年)、世界および地域別シェア、トレンド、成長機会分析レポートの対象範囲:タイプ別(体積エアフローセンサーおよび質量エアフローセンサー)、出力信号別(アナログおよびデジタル)、アプリケーション別(自動車、航空宇宙、製造、電力およびユーティリティ、その他)、および地域別
- ステータス : 出版
- レポートコード : TIPRE00002807
- カテゴリー : エレクトロニクスおよび半導体
- ページ数 : 158
- 利用可能なレポート形式 :


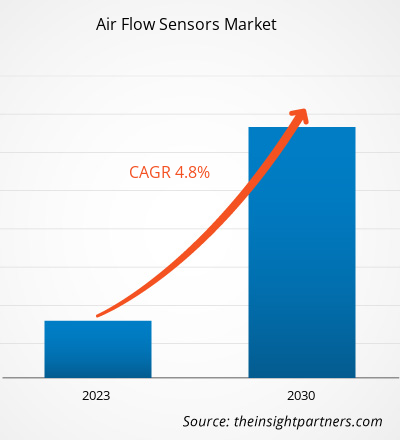
エアフローセンサー市場規模は、2022年の24億1,000万米ドルから、2030年には35億米ドルに達すると予測されています。市場は2022年から2030年にかけて4.8%のCAGRで成長すると見込まれています。センサー技術とモノのインターネット(IoT)の統合は、引き続き市場の主要トレンドとなるでしょう。
エアフローセンサー市場分析
HVACシステムは、効率的な運用とエネルギー消費の削減を実現するためにエアフローセンサーを使用しています。HVACシステムには、エリアの実際の温度と目標温度を比較し、適切な措置を講じることができるエアフローセンサーが搭載されています。HVAC制御は、ホテル、企業、小売、住宅など、さまざまなビジネス分野で広く採用されています。
エアフローセンサー市場概要
エアフローセンサーは、チャネル内の空気の流量または質量を測定するために使用されます。エアフローセンサーは設置が簡単で、全圧、気流の静圧、そして風速を計測できます。エアフローセンサーは幅広い産業システムに応用されています。自動車においては、最適な燃費と排出ガスレベルを維持するためにエアフローセンサーが不可欠であり、エンジン制御ユニットが燃料噴射を調整して効率的な燃焼を実現するのにも役立ちます。
要件に合わせてレポートをカスタマイズ
レポートの一部、国レベルの分析、Excelデータパックなどを含め、スタートアップ&大学向けに特別オファーや割引もご利用いただけます(無償)
エアフローセンサー市場: 戦略的洞察
-
このレポートの主要な市場動向を入手してください。この無料サンプルには、市場動向から見積もりや予測に至るまでのデータ分析が含まれます。
エアフローセンサー市場の推進要因と機会
自動車業界におけるエアフローセンサーの需要増加が市場を後押し
自動車業界は、エアフローセンサーの主要なエンドユーザーです。自動車の需要増加は、同時にエアフローセンサーの需要も促進します。これらのセンサーは、エンジンや排気システムで空気の流れを監視・制御するために使用されるためです。自動車業界は世界中で急速に成長しています。また、世界中でEVの普及率が大幅に増加しています。欧州委員会によると、自動車業界は1,380万人のヨーロッパ人に直接的および間接的な雇用を提供し、これはヨーロッパ全体の雇用の15.1%に相当します。欧州運輸環境連盟が引用した統計によると、英国政府は2050年までにネットゼロ排出目標を掲げ、2035年までにすべての汚染車両の販売を禁止することを提案しました。したがって、ネットゼロ排出イニシアチブと消費者の間での環境に優しい車両の需要が、エアフローセンサー市場を牽引しています。
過酷な用途向けの体積流量センサーの需要
自動車、航空宇宙、製造、電力および公益事業などの多くの業界では、過酷な条件に耐える体積流量センサーの需要が高くなっています。これにより、市場プレーヤーは過酷な用途向けの体積流量センサーの開発を促しています。たとえば、2023年9月、ENVEAは過酷な用途向けの体積流量センサーの高温バージョンであるAirFlow Pを発表しました。 AirFlow P は、800 度までの高温用途に適したダスト負荷センサーの体積流量測定用センサーです。
エアフローセンサー市場レポートのセグメンテーション分析
エアフローセンサー市場分析の導出に貢献した主要なセグメントは、タイプとアプリケーションです。
- タイプに基づいて、エアフローセンサー市場は、体積エアフローセンサーと質量エアフローセンサーに分かれています。体積エアフローセグメントは、2022 年に大きな市場シェアを占めました。
- アプリケーションに基づいて、市場は自動車、航空宇宙、製造、電力およびユーティリティ、その他に分かれています。自動車セグメントは、2022 年に大きな市場シェアを占めました。
地域別のエアフローセンサー市場シェア分析
エアフローセンサー市場レポートの地理的範囲は、主に北米、アジア太平洋、ヨーロッパ、中東およびアフリカ、南アフリカの 5 つの地域に分かれています。中央アメリカ。
日本、インド、中国、オーストラリア、シンガポール、台湾、インドネシアといった国々には、電子機器、食品・飲料、化学、繊維、自動車、ヘルスケアなど、多様な製造業が存在します。さらに、「中国製造2025」や「インド製造」といった政府の政策は、アジア太平洋諸国におけるこれらの産業を後押ししており、エアフローセンサーの需要を押し上げています。さらに、中国は航空宇宙産業が急速に成長しています。北京の技術に精通した人材や若手科学者のチームは、過去に嫦娥月探査機や天問火星探査などのミッションにおいて重要な役割を果たしてきました。航空宇宙産業におけるこうした発展は、中国のエアフローセンサー市場の成長を牽引しています。さらに、空気質モニタリングの重要性に対する意識の高まりは、アジア太平洋地域におけるHVACシステムの需要を押し上げ、ひいては同地域のエアフローセンサー市場に利益をもたらしています。
エアフローセンサー市場の地域別分析
予測期間を通じてエアフローセンサー市場に影響を与える地域的なトレンドと要因は、The Insight Partnersのアナリストによって徹底的に解説されています。このセクションでは、北米、ヨーロッパ、アジア太平洋、中東・アフリカ、中南米におけるエアフローセンサー市場のセグメントと地域についても解説しています。
エアフローセンサー市場レポートの範囲
| レポート属性 | 詳細 |
|---|---|
| の市場規模 2022 | US$ 2.41 Billion |
| 市場規模別 2030 | US$ 3.5 Billion |
| 世界的なCAGR (2022 - 2030) | 4.8% |
| 過去データ | 2020-2021 |
| 予測期間 | 2023-2030 |
| 対象セグメント |
By タイプ
|
| 対象地域と国 |
北米
|
| 市場リーダーと主要企業の概要 |
|
エアフローセンサー市場のプレーヤー密度:ビジネスダイナミクスへの影響を理解する
エアフローセンサー市場は、消費者の嗜好の変化、技術の進歩、製品メリットへの認知度の高まりといった要因によるエンドユーザー需要の増加に牽引され、急速に成長しています。需要の増加に伴い、企業は製品ラインナップの拡充、消費者ニーズへの対応のためのイノベーション、そして新たなトレンドの活用を進めており、これが市場の成長をさらに加速させています。
- 入手 エアフローセンサー市場 主要プレーヤーの概要
エアフローセンサー市場のニュースと最近の開発
エアフローセンサー市場は、主要な企業出版物、協会データ、データベースなどの一次調査と二次調査後の定性的および定量的データを収集することで評価されます。エアフローセンサー市場のいくつかの開発を以下に示します。
- 環境モニタリングソリューションの大手プロバイダーであるENVEAは、800℃までの温度に耐えることができる高温バージョンの導入により、AirFlow Pセンサーシリーズを拡張しました。この追加によりAirFlow Pセンサーの機能が拡張され、さらに厳しい産業用途に最適なソリューションになります。(出典:ENVEA、企業ウェブサイト、2023年9月)
- Posifa Technologiesは、呼吸ケアやその他のヘルスケアおよび計測目的で使用される質量空気流量センサーの最新バージョンを発表しました。 PMF83000およびPMF86000シリーズセンサーは、湿度が高く、腐食性ガスのレベルが低い過酷な環境での使用を目的としています。(出典:Posifa Technologies、企業ウェブサイト、2021年4月)
エアフローセンサー市場レポートの対象範囲と成果物
「エアフローセンサー市場規模と予測(2020~2030年)」このレポートでは、以下の分野を網羅した市場の詳細な分析を提供しています。
- エアフローセンサー市場の規模と予測(世界、地域、国レベルで)(調査対象となっているすべての主要市場セグメント)
- エアフローセンサー市場の動向、および推進要因、制約、主要な機会などの市場動向
- 詳細なPEST/ポーターの5つの力とSWOT分析
- 主要な市場動向、世界および地域の枠組み、主要プレーヤー、規制、最近の市場動向を網羅したエアフローセンサー市場分析
- 市場集中、ヒートマップ分析、主要プレーヤー、エアフローセンサー市場の最近の動向を網羅した業界状況と競争分析
- 詳細な企業プロファイル

Naveenは、カスタム、シンジケート、コンサルティングの各プロジェクトにおいて9年以上の実績を持つ、経験豊富な市場調査およびコンサルティングのプロフェッショナルです。現在はアソシエイトバイスプレジデントを務め、プロジェクトバリューチェーン全体にわたるステークホルダー管理を成功させ、100件以上の調査レポートと30件以上のコンサルティング案件を執筆しています。産業および政府機関のプロジェクトに幅広く携わり、クライアントの成功とデータに基づく意思決定に大きく貢献しています。
Naveenは、カルナータカ州VTUで電子通信工学の学位を取得し、マニパル大学でマーケティング&オペレーションズのMBAを取得しています。IEEEの会員として9年間活動し、会議や技術シンポジウムへの参加、セクションレベルおよび地域レベルでのボランティア活動に積極的に取り組んでいます。現職以前は、IndustryARCでアソシエイト戦略コンサルタント、Hewlett Packard(HP Global)で産業用サーバーコンサルタントを務めていました。
- 過去2年間の分析、基準年、CAGRによる予測(7年間)
- PEST分析とSWOT分析
- 市場規模価値/数量 - 世界、地域、国
- 業界と競争環境
- Excel データセット
お客様の声
Insight PartnersのSCADAシステム市場レポートは包括的で、現在のトレンドと将来の予測に関する貴重な洞察が含まれています。チームは終始、非常にプロフェッショナルで、対応が早く、サポートも充実していました。私たちは彼らのサービスに非常に満足しており、強くお勧めします。
ラン・ケデム パートナー, レアリテクノロジーズ株式会社非常に特殊なソフトウェア市場に関するレポートを依頼したところ、チームは数日でレポートを作成してくれました。情報は非常に関連性が高く、分かりやすくまとめられていました。その後、レポートにいくつか修正と追加を依頼しましたが、チームは非常に迅速に対応し、1週間も経たないうちに最終レポートを受け取ることができました。
ジャン=エルヴェ・ジェン 会長, フューチャー・アナリティカ重要な市場調査と予測のために、The Insight Partnersと協力しました。彼らは機会とリスクに関する明確な洞察を提供し、私たちの計画策定に役立ちました。彼らの調査は使いやすく、確かなデータに基づいており、賢明で自信に満ちた意思決定に役立ちました。彼らを強くお勧めします。
ピユーシュ・ナグパル 上級副社長, ハイビームグローバルInsight Partnersは、深い専門知識に基づき、洞察力に富み、構造化された市場調査を提供しました。チームは終始プロフェッショナルで、対応力も抜群でした。ユーザーフレンドリーなウェブサイトにより、業界レポートへのアクセスもスムーズでした。信頼性の高い高品質な調査サービスをお探しなら、Insight Partnersを強くお勧めします。
安達幸彦 最高経営責任者(CEO), ディープブルーLLC。The Insight Partnersから市場レポートを購入するのは今回が初めてです。最初は不安でしたが、ウェブサイトを見て、リスクを負ってでも購入してみようという気持ちになりました。レポートの品質とカスタマーサービスには大変満足しています。最初のレポートにはいくつか質問やコメントがありましたが、アナリストとメールで何度かやり取りした結果、戦略策定プロセスへのインプットとして活用できるレポートが完成しました。貴重なお時間を割いていただき、貴重な体験をさせていただき、誠にありがとうございました。他の方にもぜひお勧めしたいですし、今後さらに市場データが必要になった際には、まずThe Insight Partnersにご連絡させていただきます。
ジョン・スズキ 社長兼最高経営責任者、取締役, BKテクノロジーズナイジェリアの感染症IVD市場に関する情報提供依頼に対し、ご対応いただいた際、ご尽力とプロフェッショナルな姿勢に深く感謝申し上げます。忍耐強く、的確なアドバイスをいただき、また、最終的に取引成立に至った割引のご提供にも深く感謝申し上げます。今回の最初の出会いで得た強い印象のおかげで、今後もThe Insight Partnersとの連携を心待ちにしております。
チジオケ博士 オニア マネージングディレクター, パインクレストヘルスケア株式会社購入理由
- 情報に基づいた意思決定
- 市場動向の理解
- 競合分析
- 顧客インサイト
- 市場予測
- リスク軽減
- 戦略計画
- 投資の正当性
- 新興市場の特定
- マーケティング戦略の強化
- 業務効率の向上
- 規制動向への対応


 無料サンプルを入手 - エアフローセンサー市場