臨床試験イメージング市場の分析と予測 - 規模、シェア、成長、トレンド 2028 年
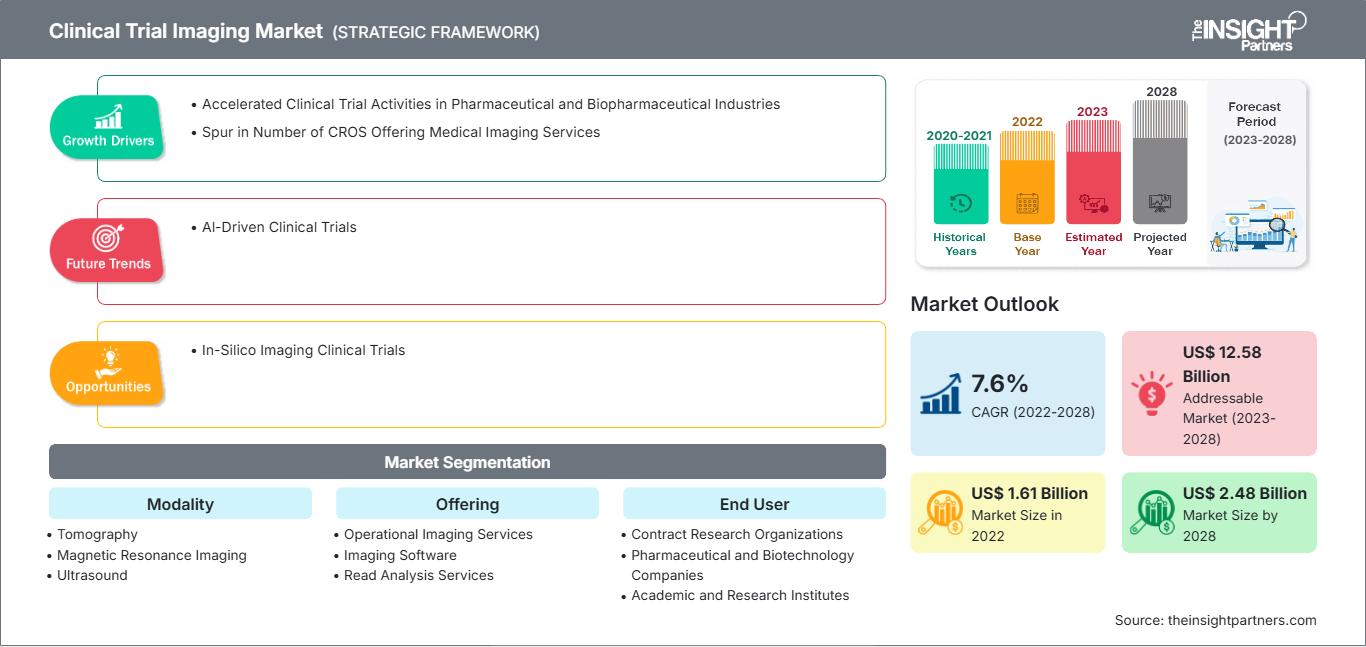
過去データ : 2020-2021 | 基準年 : 2022 | 予測期間 : 2023-20282028年までの臨床試験イメージング市場予測 - モダリティ別(断層撮影、磁気共鳴画像(MRI)、超音波、陽電子放出断層撮影(PET)、X線、心エコー検査など)、提供サービス別(オペレーショナルイメージングサービス、イメージングソフトウェア、読影分析サービス、試験設計・コンサルティングサービスなど)、エンドユーザー別(開発業務受託機関(CRO)、製薬企業・バイオテクノロジー企業、学術研究機関など)のグローバル分析
- ステータス : 出版
- レポートコード : TIPHE100001201
- カテゴリー : ライフサイエンス
- ページ数 : 186
- 利用可能なレポート形式 :


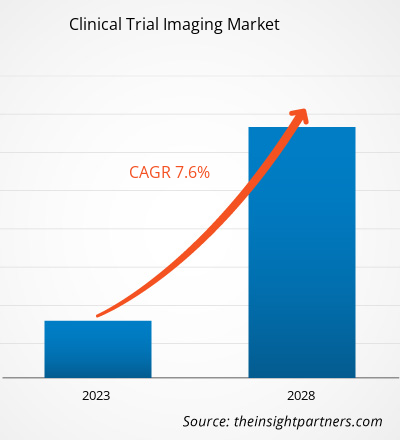
[調査レポート]臨床試験イメージング市場規模は、2022年の16億1,070万米ドルから2028年には24億8,032万米ドルに達すると予想され、2023年から2028年にかけて7.6%のCAGRを記録すると予測されています。
市場洞察とアナリストの見解:
臨床試験イメージングは、ボランティアで参加する人々を対象に実施される調査研究です。この研究の主な目的は、病気の検出、診断、治療の指導またはモニタリングのためのイメージング手順の価値を判断することです。一部の画像判読プロセスでは、臨床試験画像にテスト画像を混在させて使用し、読影者の読影における熟練度や一貫性を断続的にテストする場合があります。熟練度を維持できない場合は、別の訓練を受けた資格のある読影者と読影者を交換する必要があります。多施設臨床試験での画像エンドポイントの利用が急増するとともに、データ量とワークフローの複雑さも増大しています。臨床試験での画像プロセスを包括的にサポートし、シームレスなワークフローに従い、患者の転帰を改善するには、臨床試験画像管理システム(CTIMS)が必要です。CTIMSの主な規制要件は、国際医薬品規制調和会議-GCP E6、FDA 21連邦規則集パート11および820、適正自動製造基準、臨床データ交換標準コンソーシアムなど、多くの関連規制とガイドラインを徹底的に検討して抽出されました。
成長の原動力と課題:
臨床研究組織(CRO)は、高品質の施設と深い専門知識を使用して提供されるサービスを通じて、臨床試験の成功を支援します。CROは、試験スポンサーに利益をもたらす効率的で費用対効果の高い運用を通じて、臨床試験業界のバックボーンとしての役割を果たし始めています。例えば、CROは、臨床試験の実施と完了に要する時間を、社内業務に比べて平均30%短縮しています。
CRO数の増加と競争の激化に伴い、一部のCROは専門的な画像診断サービスを提供し、画像診断CRO(iCRO)として台頭しています。Keosys Medical ImagingとMedica Group PLCはiCROの好例です。臨床試験の総数は2010年以降倍増し、これらの試験における画像診断装置の使用はほぼ500%増加しています。KEOSYS MEDICAL IMAGING社のレポートによると、iCROは予算の7.5~10%を画像診断に割り当てており、これによりワークフローを最適化し、画像取得から解釈までのプロセスのすべてのステップを管理しています。これらのCROは、画像診断のための施設の適格性評価、標準化された画像の取得、読影デザインと基準の決定といった分野において重要な知見を提供することで、世界の臨床試験画像診断市場の成長に貢献しています。
要件に合わせてレポートをカスタマイズ
レポートの一部、国レベルの分析、Excelデータパックなどを含め、スタートアップ&大学向けに特別オファーや割引もご利用いただけます(無償)
臨床試験イメージング市場: 戦略的洞察
-
このレポートの主要な市場動向を入手してください。この無料サンプルには、市場動向から見積もりや予測に至るまでのデータ分析が含まれます。
臨床試験は、新薬、食事療法、医療機器など、新しい治療法や予防法が安全で効果的かどうかを判断するのに役立ちます。試験は主に医薬品開発中に実施されます。国立医学図書館(NLM)のデータによると、2020年には約52,000件の新しい研究がNLM(ClinicalTrials.gov)に登録され、2023年に約58,000件に増加しました。2023年1月、NLMは米国で38,837件の臨床試験が、世界中で105,172件の臨床試験が実施中であると報告しました。欧州医薬品庁によると、欧州連合(EU)では年間約4,000件の臨床試験が承認されており、そのうち約60%の臨床試験は製薬業界に関連しています。慢性疾患の世界的な蔓延に伴い、様々な効果的な治療法を開発するための臨床試験が増加しており、臨床試験イメージング市場の成長を牽引しています。
さらに、臨床試験はますます複雑な手順になりつつあり、研究機関における適切な実施と監視が不可欠になっています。不適切な実施によるエラーを回避するため、研究機関は自社製品の開発において臨床試験をアウトソーシングしています。臨床研究機関(CRO)は、高品質な設備と深い専門知識を活用したサービスを通じて、臨床試験の成功を支援します。CROは、試験スポンサーに利益をもたらす効率的で費用対効果の高い運用を通じて、臨床試験業界のバックボーンとしての役割を果たし始めています。サーモフィッシャーサイエンティフィックのブログによると、2022年には4件中約3件の臨床試験がCROによって実施され、医薬品開発者の臨床プログラムの信頼性確保、豊富な専門知識の提供、時間とコストの効率化、カスタマイズされた高品質データの提供を目的としていました。したがって、費用対効果の高いソリューションの開発と、医薬品開発プロセス中のCROにおけるエラーの減少は、臨床試験市場の成長を牽引し、ひいては臨床試験イメージング市場の拡大につながっています。
製薬業界は、世界的に最も研究開発集約型の産業の1つです。製薬会社は研究開発が意図した目標を達成することに熱心であるため、医薬品の価値はますます重要になっています。過去10年間で、年間承認される新薬の数も増加しています。米国食品医薬品局(FDA)によると、2022年には年間37の新薬が承認されました。患者のニーズを満たすための有効性と効率性を高めるための取り組みが進められています。研究主導型の業界では、収益の約15~20%を研究開発活動に割り当てており、年間500億ドル以上を研究開発に投資しています。世界的に、米国は研究開発投資の主要国であり、過去10年間で世界の新しい分子の半分以上を生み出しています。欧州製薬団体連合会(EFPIA)によると、2019年の世界医薬品売上高の48.7%は北米が占めました。2014年から2019年の間に発売された新薬の売上高では、米国が62.3%を占めました。製薬会社の事業において、R&D は重要かつ不可欠な部分です。R&D によって、医療上および商業上の大きな可能性を秘めたさまざまな治療用途の新しい分子を発見することができるからです。
主要製薬会社の R&D 投資
会社 |
2021 年の R&D 投資 (10 億米ドル) |
2022 年の R&D 投資 (10 億米ドル) |
|
武田薬品工業株式会社 |
4.2 |
4.6 |
|
ファイザーInc |
10.3 |
11.4 |
|
Grifols SA |
404.57 |
427.05 |
注: 通貨の表示には現在の変換レートが考慮されます。
出典: 年次報告書および The Insight Partners の分析
R&D 支出は、新製品の発見、調査、製造、前払い金、既存の結果の改善、発売前の製品有効性と規制遵守の実証のために行われます。R&D 投資は、臨床試験の必要性と需要によって異なります。コストには、使用する材料、消耗品、給与に加えて、品質管理の開発コストが含まれます。
上記の企業や病院は、免疫疾患などのさまざまな疾患や障害を治療するための製品の開発に投資しています。2021年6月、武田薬品工業は、慢性炎症性脱髄性多発根神経炎(CIDP)の治療継続を目的としたHYQVIA(組換えヒトヒアルロニダーゼ含有免疫グロブリン輸液10%(ヒト))を評価するランダム化プラセボ対照二重盲検第3相臨床試験であるADVANCE-1を発表しました。この試験は主要評価項目を達成する見込みです。このように、企業による研究開発投資の増加と先進的な製薬業界が相まって、臨床試験イメージング市場の成長を牽引しています。
製薬企業やバイオ医薬品企業にとって、臨床研究への積極的な参加はやりがいがある一方で要求も厳しく、医用イメージングは研究の不可欠な部分になりつつあります。しかし、臨床試験や画像診断装置に特有の技術仕様や管理面は、標準的な画像診断とは大きく異なるため、治験実施施設の既存の臨床インフラに負担をかけています。こうした臨床要件を遵守できない場合、信頼性の低いデータが生成され、繰り返し画像診断が必要となり、治験への患者登録が取り消されるといった事態に陥ります。さらに、治験実施施設における適切なインフラの不足は、CROによるこうした課題への取り組みを阻害する可能性があります。臨床試験用画像診断機器は、関係者から多額のリソース投資を必要とします。例えば、医薬品や医療機器の治験実施施設は、臨床試験の要件とインフラを満たし、患者ケアにおける優位性を維持し、治験の完全性を保証する必要があります。さらに、治験依頼者は、上記の要件を満たすために必要な現地インフラの開発を支援することで、臨床試験用画像診断の負担を認識しなければなりません。北米放射線学会(Radiological Society of North America)のQuantitative Imaging Biomarkers Allianceは、標準的な画像診断プロトコルとワークフローを定義し、定量的な臨床試験結果を得るための画像検査の一貫性を確保することを目指しています。したがって、高額な投資と標準化されたインフラストラクチャ要件は、世界の臨床試験イメージング市場の成長を妨げています。
レポートのセグメンテーションと範囲:
「世界の臨床試験イメージング市場」は、モダリティ、提供、エンドユーザー、および地域に基づいてセグメント化されています。 モダリティに基づいて、臨床試験イメージング市場は、断層撮影、超音波、陽電子放出断層撮影、X線、心エコー検査、磁気共鳴イメージング、その他に分類されています。 提供に基づいて、臨床試験イメージング市場は、試験設計コンサルティングサービス、読み取り分析サービス、運用イメージングサービス、イメージングソフトウェア、その他に分類されています。 エンドユーザーに基づいて、臨床試験イメージング市場は、製薬およびバイオ医薬品会社、契約研究機関、学術および政府の研究機関、その他に分類されています。臨床試験イメージング市場は、地理に基づいて、北米(米国、カナダ、メキシコ)、ヨーロッパ(ドイツ、フランス、イタリア、英国、ロシア、その他のヨーロッパ)、アジア太平洋(オーストラリア、中国、日本、インド、韓国、その他のアジア太平洋)、中東およびアフリカ(南アフリカ、サウジアラビア、UAE、その他の中東およびアフリカ)、南米および中米(ブラジル、アルゼンチン、その他の南米および中米)に分類されています。
セグメント分析:
世界の臨床試験イメージング市場は、試験設計コンサルティングサービス、読み取り分析サービス、運用イメージングサービス、イメージングソフトウェア、その他に分類されています。運用イメージングサービスセグメントは2021年に最大のシェアを占め、予測期間中も同様の傾向が続くと予想されます。運用イメージングサービスには、神経学、腫瘍学、心血管疾患、消化器学、筋骨格系疾患などの治療用途向けのMRI、CT、超音波、PET、SPECTなどの画像診断装置や、臨床試験の実施に使用される医療機器が含まれます。非侵襲的な研究方法である臨床画像診断は、医学全般、特に臨床研究の進歩に多くの利点をもたらします。その結果、新しい画像診断技術を臨床試験に深く取り入れる傾向が強く、さらに拡大しており、バイオテクノロジー、医薬品、医療機器の基本要素となっています。
また、試験で画像診断を実行する際には、適切な読み取り設計を選択することが非常に重要です。読み取り設計とは、画像のキャプチャと解釈に使用されるリーダーの数と種類を指します。試験にはさまざまな画像診断装置から取得された画像が含まれる場合があり、放射線科医、病理学者、心臓専門医などの専門家によるレビューが必要になるため、変動性を低減することは、画像のキャプチャと分析において重大な課題につながります。臨床試験で医用画像を解釈する際、バイアスを減らすためには、どのような読影デザインを使用するかが最も重要です。読影デザインには、シングル リード、ダブル リード、および判定者によるダブル リードの 3 種類があります。シングル リードでは、画像は 1 人の読影者によってのみ解釈されます。ダブル リードでは、2 人以上の読影者が画像を解釈します。大規模な試験では、作業負荷が大きいため、複数の読影者が必要になる場合があります。理想的には、1 人 (ダブル リード デザインの場合は 2 人) の読影者が、試験期間全体を通して同じ患者のすべての画像をレビューします。複数の読影者が同じ患者の異なる画像撮影時点をレビューすると、さらなるばらつきが生じる可能性があります。たとえば、腫瘍学の試験には通常、治療前の病変選択と測定のための初期スクリーニング、各フォローアップ画像撮影訪問での病変の順次選択と測定、および各時点での増分放射線学的反応の評価という段階が含まれます。
Keosys Medical Imaging は、臨床試験アプリケーション向けに、読影者の主観を制限し、測定と定量化の精度を向上させる Web ベースの画像撮影および読影ソフトウェアを提供しています。全体的な運用効率、データ品質、トレーサビリティを向上させます。 Keosysが提供する読み取りソフトウェアには、高度な病変管理システムとさまざまな治療領域向けの専門アプリケーションが含まれています。 この読み取りソフトウェアは、FDA 510 (k) 承認済みで、ISO 13485 (医療機器) に準拠しています。
モダリティに基づいて、臨床試験イメージング市場は、断層撮影、超音波、陽電子放出断層撮影、X線、心エコー検査、磁気共鳴画像法などに分類されます。 断層撮影セグメントは2021年に最大のシェアを占め、予測期間中も同様の傾向が続くと予想されます。 断層撮影では、重ね合わせた構造の影が、X線画像化に使用される移動するX線管によってぼかされます。 研究や臨床試験で使用されるコンピューター断層撮影(CT)スキャンイメージングでは、さまざまな角度から撮影したX線画像を組み合わせ、コンピューター処理を行って骨、血管、軟組織の断面画像を提供します。線形断層撮影システムと非線形断層撮影システムは、同じように動作します。つまり、どちらの手法でもチューブが一方向に移動し、フィルム カセットが反対方向に移動し、支点を中心に移動します。
新しい画像診断法の導入や既存の方法の改良には、特定の疾患の治療に関連した正確なタイミングが必要です。適切な時間に画像診断をスケジュールすることは、被験者の解剖学的構造を正しく解釈するために不可欠です。病院では、患者の毒性や罹患率を監視しながら、手術、放射線療法、化学療法などの治療を効果的に実施するのに役立ちます。腫瘍学の分野における臨床研究は画像診断に大きく依存しており、特定の期間、強度、頻度で実行されるスキャン手順は、試験プロトコルの基礎となります。
CT スキャンによる高度な画像診断メトリクスは、新薬開発や癌研究で広く使用されています。これは、首、胸部、腹部、または骨盤に影響を与える進行癌の種類に関連する研究で最も使用されている画像診断法です。
地域分析:
地理に基づいて、臨床試験イメージング市場は、北米、ヨーロッパ、アジア太平洋、南米および中米、中東およびアフリカの5つの主要地域に分割されています。 2021年には、北米が臨床試験イメージング市場で最大のシェアを占め、次いでヨーロッパが続きました。米国は主要な臨床研究の目的地として浮上しています。世界で実施された臨床試験のほぼ半分が米国で実施されています。さらに、ほとんどの製薬研究会社は、確立された医療インフラ、迅速な承認タイムライン、有利な規制の枠組み、および世界中で受け入れられた臨床試験で生成されたデータのために、米国での臨床試験の実施を好みます。世界保健機関(WHO)の報告書によると、2021年に米国は最も多くの臨床試験(157,618件)を登録しました。
次の表は、米国で登録された臨床試験の数と、それらに参加した患者総数、および上記のパラメータにおける世界の米国の割合を示しています。
2023年 |
登録された臨床試験研究 |
研究に参加した患者数 |
|
米国 |
139,632件(世界の研究の31%) |
20,680人(世界の参加者数の32%) |
出典:ClinicalTrial.govレポート
臨床試験向けに企業が投入した革新的な製品が、米国の臨床試験イメージング市場の成長をさらに加速させています。臨床試験向けイメージングサービスを提供するCROであるMedical Metricsは、「Assessa」を提供しています。この製品は、創薬および関連する臨床試験、特に認知症、認知障害、アルツハイマー病、統合失調症、パーキンソン病、その他の記憶関連疾患などの神経疾患に対する創薬における意思決定の改善を支援します。米国における臨床試験件数の増加は、同国の臨床試験イメージング市場の成長を後押ししています。
臨床試験イメージング市場の地域別分析
The Insight Partnersのアナリストは、予測期間を通じて臨床試験画像市場に影響を与える地域的な傾向と要因を詳細に解説しています。このセクションでは、北米、ヨーロッパ、アジア太平洋、中東・アフリカ、中南米における臨床試験画像市場のセグメントと地域についても解説しています。
臨床試験イメージング市場レポートの範囲
| レポート属性 | 詳細 |
|---|---|
| の市場規模 2022 | US$ 1.61 Billion |
| 市場規模別 2028 | US$ 2.48 Billion |
| 世界的なCAGR (2022 - 2028) | 7.6% |
| 過去データ | 2020-2021 |
| 予測期間 | 2023-2028 |
| 対象セグメント |
By モダリティ
|
| 対象地域と国 |
北米
|
| 市場リーダーと主要企業の概要 |
|
臨床試験イメージング市場のプレーヤー密度:ビジネスダイナミクスへの影響を理解する
臨床試験イメージング市場は、消費者の嗜好の変化、技術の進歩、製品ベネフィットに対する認知度の高まりといった要因によるエンドユーザーの需要増加に牽引され、急速に成長しています。需要の増加に伴い、企業は製品ラインナップの拡充、消費者ニーズへの対応のためのイノベーション、そして新たなトレンドの活用を進めており、これが市場の成長をさらに加速させています。
- 入手 臨床試験イメージング市場 主要プレーヤーの概要
世界の臨床試験イメージング市場で活動している主要企業によるさまざまな取り組みを以下に示します。
- 2022 年 12 月、タタコンサルタンシーサービシズ(TCS)(BSE:532540、NSE:TCS)は、分散型試験向けの TCS ADD Connected Clinical Trials プラットフォームが、India Pharma Award 2022 の Excellence in Ancillary Pharma Services 部門で受賞したことを発表しました。
- 2021 年 10 月、ダッソー・システムズ傘下の Medidata は、同社のクラウドベースの安全な臨床試験イメージング管理プラットフォームである Rave Imaging が、1,000 件を超えるイメージング研究をサポートし、重要なマイルストーンを達成したことを発表しました。Medidata Unified Platformこのテクノロジーは、Rave Imagingのすべての試験にわたるすべてのイメージング関連の試験活動をリアルタイムで可視化し、研究効率を高めます。
競合状況と主要企業:
臨床試験イメージング市場は、主にeResearch Technology Inc、Calyx Inc、ICON PLC、VIDA Diagnostics Inc、WCG Clinical Inc、BioTelemetry Inc、Medical Metrics Inc、Medpace Holdings Inc、Radiant Sage LLC、IXICO plcなどの企業で構成されています。これらの企業は、成長を促進するさまざまな戦略を実行し、市場にさまざまな変化をもたらしてきました。これらの企業は、有機的な戦略(発売、拡大、製品承認など)と無機的な戦略(製品の発売、パートナーシップ、コラボレーションなど)を活用してきました。

ムリナル氏は、ライフサイエンス分野の市場インテリジェンスとコンサルティングで8年以上の経験を持つ、経験豊富なリサーチアナリストです。戦略的な思考と揺るぎない卓越性へのコミットメントに基づき、医薬品市場予測、市場機会評価、業界ベンチマークの開発において深い専門知識を培ってきました。彼女の業務は、クライアントが情報に基づいた戦略的意思決定を行えるよう、実用的なインサイトを提供することに重点を置いています。
ムリナル氏の強みは、複雑な定量データセットを有意義なビジネスインテリジェンスへと変換することにあります。彼女の分析力は、医薬品および医療機器分野における市場開拓(GTM)戦略の策定と成長機会の発掘に大きく貢献しています。信頼できるコンサルタントとして、ワークフロープロセスの合理化とベストプラクティスの確立に常に注力し、クライアントのイノベーションと業務効率の向上に貢献しています。
- 過去2年間の分析、基準年、CAGRによる予測(7年間)
- PEST分析とSWOT分析
- 市場規模価値/数量 - 世界、地域、国
- 業界と競争環境
- Excel データセット
お客様の声
Insight PartnersのSCADAシステム市場レポートは包括的で、現在のトレンドと将来の予測に関する貴重な洞察が含まれています。チームは終始、非常にプロフェッショナルで、対応が早く、サポートも充実していました。私たちは彼らのサービスに非常に満足しており、強くお勧めします。
ラン・ケデム パートナー, レアリテクノロジーズ株式会社非常に特殊なソフトウェア市場に関するレポートを依頼したところ、チームは数日でレポートを作成してくれました。情報は非常に関連性が高く、分かりやすくまとめられていました。その後、レポートにいくつか修正と追加を依頼しましたが、チームは非常に迅速に対応し、1週間も経たないうちに最終レポートを受け取ることができました。
ジャン=エルヴェ・ジェン 会長, フューチャー・アナリティカ重要な市場調査と予測のために、The Insight Partnersと協力しました。彼らは機会とリスクに関する明確な洞察を提供し、私たちの計画策定に役立ちました。彼らの調査は使いやすく、確かなデータに基づいており、賢明で自信に満ちた意思決定に役立ちました。彼らを強くお勧めします。
ピユーシュ・ナグパル 上級副社長, ハイビームグローバルInsight Partnersは、深い専門知識に基づき、洞察力に富み、構造化された市場調査を提供しました。チームは終始プロフェッショナルで、対応力も抜群でした。ユーザーフレンドリーなウェブサイトにより、業界レポートへのアクセスもスムーズでした。信頼性の高い高品質な調査サービスをお探しなら、Insight Partnersを強くお勧めします。
安達幸彦 最高経営責任者(CEO), ディープブルーLLC。The Insight Partnersから市場レポートを購入するのは今回が初めてです。最初は不安でしたが、ウェブサイトを見て、リスクを負ってでも購入してみようという気持ちになりました。レポートの品質とカスタマーサービスには大変満足しています。最初のレポートにはいくつか質問やコメントがありましたが、アナリストとメールで何度かやり取りした結果、戦略策定プロセスへのインプットとして活用できるレポートが完成しました。貴重なお時間を割いていただき、貴重な体験をさせていただき、誠にありがとうございました。他の方にもぜひお勧めしたいですし、今後さらに市場データが必要になった際には、まずThe Insight Partnersにご連絡させていただきます。
ジョン・スズキ 社長兼最高経営責任者、取締役, BKテクノロジーズナイジェリアの感染症IVD市場に関する情報提供依頼に対し、ご対応いただいた際、ご尽力とプロフェッショナルな姿勢に深く感謝申し上げます。忍耐強く、的確なアドバイスをいただき、また、最終的に取引成立に至った割引のご提供にも深く感謝申し上げます。今回の最初の出会いで得た強い印象のおかげで、今後もThe Insight Partnersとの連携を心待ちにしております。
チジオケ博士 オニア マネージングディレクター, パインクレストヘルスケア株式会社購入理由
- 情報に基づいた意思決定
- 市場動向の理解
- 競合分析
- 顧客インサイト
- 市場予測
- リスク軽減
- 戦略計画
- 投資の正当性
- 新興市場の特定
- マーケティング戦略の強化
- 業務効率の向上
- 規制動向への対応


 無料サンプルを入手 - 臨床試験イメージング市場