データコンバーター市場戦略、トッププレーヤー、成長機会、分析、2030年までの予測
過去データ : 2020-2021 | 基準年 : 2022 | 予測期間 : 2023-2031データコンバータ市場の規模と予測(2020年 - 2030年)、世界および地域別のシェア、トレンド、成長機会分析レポートの対象範囲:タイプ別(ADCおよびDAC)、解像度別(10ビット、12ビット、14ビット、16ビット、その他)、コンバータのレート別(最大50 Msps、51~100 Msps、101~200 Msps、201~500 Msps、501 Msps~1 Gsps、1 Gsps以上)、エンドユーザー別(自動車、通信、民生用電子機器、産業、医療、その他)および地域別
- ステータス : 出版
- レポートコード : TIPTE100001014
- カテゴリー : エレクトロニクスおよび半導体
- ページ数 : 171
- 利用可能なレポート形式 :


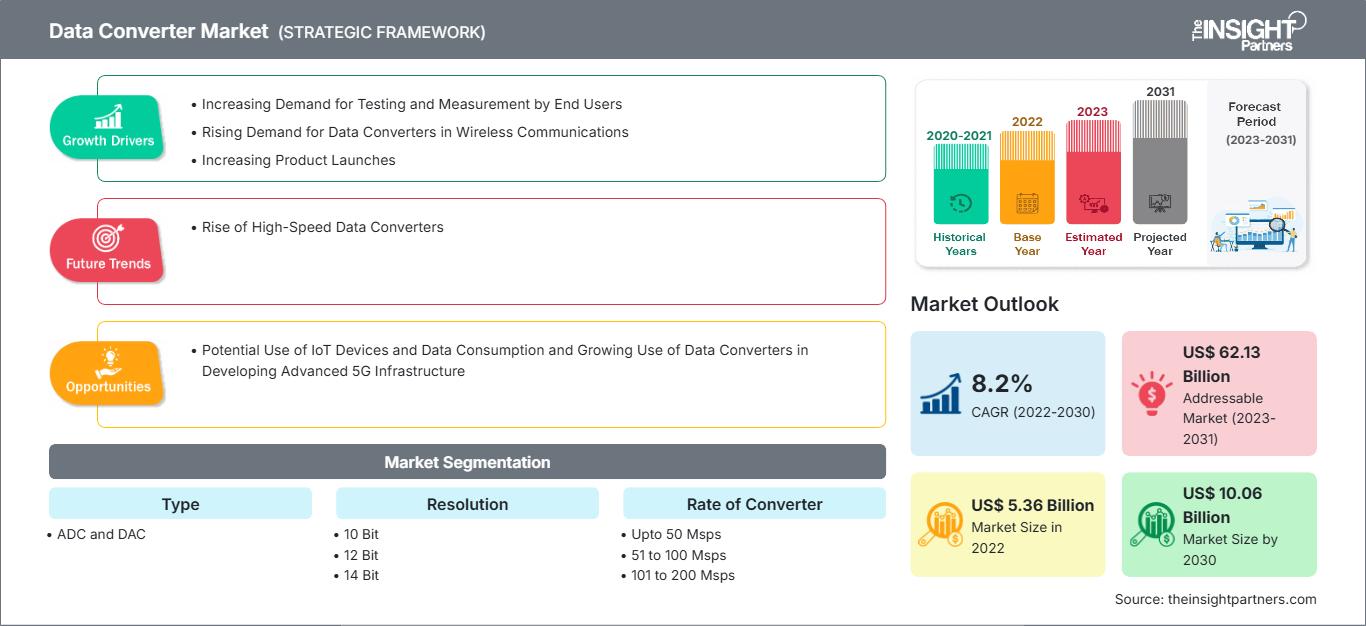
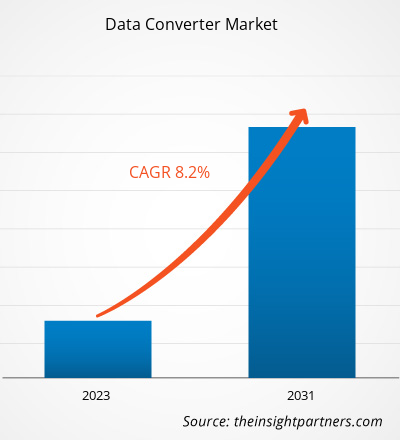
データコンバーターの市場規模は、2022年の53億6,000万米ドルから、2030年には100億6,000万米ドルに達すると予測されています。市場は2022年から2030年にかけて8.2%のCAGRを記録すると予想されています。温度センサーの小型化は、引き続き市場の重要なトレンドであり続ける可能性があります。
データコンバーター市場分析
過去数年間、エンドユーザーによるテストと測定の需要の増加、無線通信におけるデータコンバーターの需要の増加、製品の発売の増加などの要因により、データコンバーター市場は急速に成長しました。IoTデバイスとデータ消費の潜在的な使用、および高度な5Gインフラストラクチャの開発におけるデータコンバーターの使用の増加は、データコンバーター市場に成長の機会を提供する要因の一部です。
データコンバーター市場の概要
データコンバーターは電子回路です。データをある形式から別の形式に変換するもの、つまりデジタル-アナログコンバータ(ADC)またはアナログ-デジタルコンバータ(DAC)です。アナログ信号で動作する回路はアナログ回路であり、デジタル信号で動作する回路はデジタル回路です。高速ADCは、産業用計測機器、インフラストラクチャ、通信システム、産業用プロセス制御、データ収集、計測および制御システム、およびその他のセンサベースのシステムに適しています。さらに、DACは、医療/試験用計測機器および装置、通信システム、およびビデオアプリケーションに適しています。
通信およびプロトコル変換、産業用制御および計測、5G、無線通信、有線通信、LiDARおよびRADAR、車載イーサネット、およびイメージセンサーは、データコンバータが使用される主要なアプリケーションです。これらのアプリケーションにおけるリアルタイム情報の需要が高まるにつれて、データコンバータの要件は今後数年間にわたって増加し続けるでしょう。データコンバータは、高速動作を非常に正確かつ容易にサポートする可能性を秘めており、産業、通信、民生用電子機器、および医療アプリケーションにおける需要を高めています。また、システム設計を簡素化するとともに、精度の向上、消費電力の低減、帯域幅の拡大、コストの削減も実現します。
要件に合わせてレポートをカスタマイズ
レポートの一部、国レベルの分析、Excelデータパックなどを含め、スタートアップ&大学向けに特別オファーや割引もご利用いただけます(無償)
データコンバータ市場: 戦略的洞察
-
このレポートの主要な市場動向を入手してください。この無料サンプルには、市場動向から見積もりや予測に至るまでのデータ分析が含まれます。
データ コンバータ市場の推進要因と機会
エンド ユーザーによるテストと測定の需要増加が市場を後押し
製品の品質、コンプライアンス、効率性の確保は、世界中の企業にとって最優先事項です。テストおよび測定 (T&M) ソリューションは、多数の電子製品の品質とパフォーマンスを保証するため、電子システム設計および製造 (ESDM) 部門の重要な部分を占めています。通信業界では、音声品質とデータ サービスの向上は、高度な変調およびアンテナ技術の結果です。ルーター、リピータ、接続などのさまざまなネットワーク コンポーネントを包括的にテストするには、無線周波数 (RF) 信号解析装置、ロジック アナライザ、信号発生器、ケーブル テスター、ネットワーク アナライザ、その他のテストおよび測定ツールが必要です。アナログ - デジタル コンバータ (ADC) とデジタル - アナログ コンバータ (DAC) は、信号変換用の装置で頻繁に使用されます。通信試験装置におけるADCとDACの使用増加は、データコンバータ市場の成長を牽引しています。
高度な5Gインフラ開発におけるデータコンバータの使用増加
多くの国の政府が、5Gインフラの増強に取り組んでいます。2023年9月、米国国立科学財団技術・イノベーション・パートナーシップ局(TIP)は、5つのコンバージェンスチームをNSFコンバージェンスのフェーズ1からフェーズ2に進めるために2,500万ドルを投資し、5G通信インフラと運用上の課題に取り組むと発表しました。NSFはトラックGのフェーズ1に16チームを選出しました。今後2年間、フェーズ2のチームは、技術開発、知的財産、財務管理と計画、持続可能性計画、コミュニケーションとアウトリーチを含むイノベーションと起業家精神に関するカリキュラムに参加します。 2023年4月、ジーナ・M・ライモンド米国商務長官は、オープンで相互運用可能なネットワークの開発に15億米ドルを投資することを目的とした公共無線サプライチェーンイノベーション基金の立ち上げを発表しました。 2022年のCHIPSおよび科学法によって資金提供されるこの投資は、バイデン・ハリス政権の米国への投資アジェンダの一部であり、無線イノベーションの推進、競争の促進、サプライチェーンの回復力の強化を目指しています。 そのため、5Gインフラストラクチャの開発におけるデータコンバーターの使用の増加と政府の取り組みの増加は、今後数年間でデータコンバーター市場に大きな機会を提供すると予想されます。
データコンバーター市場レポートのセグメンテーション分析
データコンバーター市場分析の導出に貢献した主要なセグメントは、タイプ、解像度、コンバーターの速度、およびエンドユーザーです。
- タイプに基づいて、データコンバーター市場はADCとDACに分かれています。 ADCセグメントは2022年に大きな市場シェアを占めるでしょう。
- 解像度別に見ると、市場は10ビット、12ビット、14ビット、16ビット、その他に分類されています。その他セグメントは2022年に最大の市場シェアを占めました。
- コンバーターの速度別に見ると、市場は最大50Msps、51~100Msps、101~200Msps、201~500Msps、501Msps~1Gsps、1Gsps以上に分類されています。501Msps~1Gspsセグメントは2022年に最大の市場シェアを占めました。
- エンドユーザー別に見ると、市場は自動車、通信、民生用電子機器、産業、医療、その他に分類されています。 2022年には通信セグメントが最大の市場シェアを占めました。
データコンバータ市場シェアの地域別分析
データコンバータ市場レポートの地理的範囲は、主に北米、アジア太平洋、ヨーロッパ、中東およびアフリカ、南米および中米の5つの地域に分かれています。
収益面では、2022年に北米が市場を支配しました。北米のデータコンバータ市場は、米国、カナダ、メキシコに区分されています。この地域の市場成長は、医療アプリケーションにおける高解像度画像の需要の高まりに起因しています。画像品質の向上は、あらゆる病気の迅速な診断と治療を可能にし、医師の生産性を向上させます。技術的に高度なデータ収集システムにおけるデータコンバータの採用の増加は、北米の市場成長をさらに促進します。エレクトロニクス業界は、柔軟なソフトウェアとモジュール式ハードウェアを組み合わせたトレンドへと移行しています。さらに、北米には主要なデータコンバータメーカーが多数存在し、この地域の市場成長を牽引しています。北米のデータ コンバータ メーカーとしては、Texas Instruments Incorporated、Analog Devices、Omni Design Technologies、Inc.、Synopsys、Inc.、Microchip Technology、Inc. などがあります。
データコンバータ市場の地域別分析
The Insight Partnersのアナリストは、予測期間を通じてデータコンバータ市場に影響を与える地域的な動向と要因を詳細に解説しています。このセクションでは、北米、ヨーロッパ、アジア太平洋、中東・アフリカ、中南米におけるデータコンバータ市場のセグメントと地域についても解説しています。
データコンバータ市場レポートの範囲
| レポート属性 | 詳細 |
|---|---|
| の市場規模 2022 | US$ 5.36 Billion |
| 市場規模別 2030 | US$ 10.06 Billion |
| 世界的なCAGR (2022 - 2030) | 8.2% |
| 過去データ | 2020-2021 |
| 予測期間 | 2023-2031 |
| 対象セグメント |
By タイプ
|
| 対象地域と国 |
北米
|
| 市場リーダーと主要企業の概要 |
|
データコンバータ市場のプレーヤー密度:ビジネスダイナミクスへの影響を理解する
データコンバータ市場は、消費者の嗜好の変化、技術の進歩、製品メリットへの認知度の高まりといった要因によるエンドユーザー需要の高まりに牽引され、急速に成長しています。需要の増加に伴い、企業は製品ラインナップの拡充、消費者ニーズへの対応のための革新、そして新たなトレンドの活用を進めており、これが市場の成長をさらに加速させています。
- 入手 データコンバータ市場 主要プレーヤーの概要
データコンバータ市場のニュースと最新動向
データコンバータ市場は、主要な企業出版物、協会データ、データベースなどの一次調査および二次調査を経て、定性的および定量的なデータを収集することで評価されます。データコンバータ市場におけるいくつかの動向を以下に示します。
- STマイクロエレクトロニクスは、衛星電子回路の重要な役割を果たす、低コストのプラスチックパッケージに収められた、耐放射線性を備えた電源、アナログ、ロジックICの新製品ラインを発表しました。このシリーズの最初の9つのデバイスには、データコンバータ、電圧レギュレータ、ラインドライバ、LVDSトランシーバ、そして発電・配電、テレメトリ用スタートラッカー、オンボードコンピュータ、トランシーバなど、さまざまなシステムで使用される5つのロジックゲートが含まれています。(出典: STマイクロエレクトロニクス、プレスリリース、2022年3月)
- ルネサス エレクトロニクス株式会社は、ハイエンド産業用センサーシステム向けの新しいRXデバイスを、32ビットマイクロコントローラのラインナップに追加しました。新しいMCUには、最大変換速度125kSPS(125,000サンプル/秒)の24ビットデルタシグマA/Dコンバータが組み込まれており、RX23E-Aよりも8倍高速です。(出典:ルネサス エレクトロニクス株式会社、プレスリリース、2023年11月)
データコンバータ市場レポートの対象範囲と成果物
「データコンバータ市場の規模と予測(2020~2030年)」このレポートでは、以下の分野を網羅した市場の詳細な分析を提供しています。
- データコンバーター市場の規模と予測(対象範囲に含まれるすべての主要市場セグメントについての世界、地域、国レベル)
- データコンバーター市場の動向、および推進要因、制約、主要な機会などの市場動向
- 詳細なPEST / Porterの5つの力とSWOT分析
- 主要な市場動向、世界および地域の枠組み、主要プレーヤー、規制、および最近の市場動向を網羅したデータコンバーター市場分析
- 市場集中、ヒートマップ分析、主要プレーヤー、およびデータコンバーター市場の最近の動向を網羅した業界の状況と競争分析
- 詳細な企業プロファイル

Naveenは、カスタム、シンジケート、コンサルティングの各プロジェクトにおいて9年以上の実績を持つ、経験豊富な市場調査およびコンサルティングのプロフェッショナルです。現在はアソシエイトバイスプレジデントを務め、プロジェクトバリューチェーン全体にわたるステークホルダー管理を成功させ、100件以上の調査レポートと30件以上のコンサルティング案件を執筆しています。産業および政府機関のプロジェクトに幅広く携わり、クライアントの成功とデータに基づく意思決定に大きく貢献しています。
Naveenは、カルナータカ州VTUで電子通信工学の学位を取得し、マニパル大学でマーケティング&オペレーションズのMBAを取得しています。IEEEの会員として9年間活動し、会議や技術シンポジウムへの参加、セクションレベルおよび地域レベルでのボランティア活動に積極的に取り組んでいます。現職以前は、IndustryARCでアソシエイト戦略コンサルタント、Hewlett Packard(HP Global)で産業用サーバーコンサルタントを務めていました。
- 過去2年間の分析、基準年、CAGRによる予測(7年間)
- PEST分析とSWOT分析
- 市場規模価値/数量 - 世界、地域、国
- 業界と競争環境
- Excel データセット
お客様の声
Insight PartnersのSCADAシステム市場レポートは包括的で、現在のトレンドと将来の予測に関する貴重な洞察が含まれています。チームは終始、非常にプロフェッショナルで、対応が早く、サポートも充実していました。私たちは彼らのサービスに非常に満足しており、強くお勧めします。
ラン・ケデム パートナー, レアリテクノロジーズ株式会社非常に特殊なソフトウェア市場に関するレポートを依頼したところ、チームは数日でレポートを作成してくれました。情報は非常に関連性が高く、分かりやすくまとめられていました。その後、レポートにいくつか修正と追加を依頼しましたが、チームは非常に迅速に対応し、1週間も経たないうちに最終レポートを受け取ることができました。
ジャン=エルヴェ・ジェン 会長, フューチャー・アナリティカ重要な市場調査と予測のために、The Insight Partnersと協力しました。彼らは機会とリスクに関する明確な洞察を提供し、私たちの計画策定に役立ちました。彼らの調査は使いやすく、確かなデータに基づいており、賢明で自信に満ちた意思決定に役立ちました。彼らを強くお勧めします。
ピユーシュ・ナグパル 上級副社長, ハイビームグローバルInsight Partnersは、深い専門知識に基づき、洞察力に富み、構造化された市場調査を提供しました。チームは終始プロフェッショナルで、対応力も抜群でした。ユーザーフレンドリーなウェブサイトにより、業界レポートへのアクセスもスムーズでした。信頼性の高い高品質な調査サービスをお探しなら、Insight Partnersを強くお勧めします。
安達幸彦 最高経営責任者(CEO), ディープブルーLLC。The Insight Partnersから市場レポートを購入するのは今回が初めてです。最初は不安でしたが、ウェブサイトを見て、リスクを負ってでも購入してみようという気持ちになりました。レポートの品質とカスタマーサービスには大変満足しています。最初のレポートにはいくつか質問やコメントがありましたが、アナリストとメールで何度かやり取りした結果、戦略策定プロセスへのインプットとして活用できるレポートが完成しました。貴重なお時間を割いていただき、貴重な体験をさせていただき、誠にありがとうございました。他の方にもぜひお勧めしたいですし、今後さらに市場データが必要になった際には、まずThe Insight Partnersにご連絡させていただきます。
ジョン・スズキ 社長兼最高経営責任者、取締役, BKテクノロジーズナイジェリアの感染症IVD市場に関する情報提供依頼に対し、ご対応いただいた際、ご尽力とプロフェッショナルな姿勢に深く感謝申し上げます。忍耐強く、的確なアドバイスをいただき、また、最終的に取引成立に至った割引のご提供にも深く感謝申し上げます。今回の最初の出会いで得た強い印象のおかげで、今後もThe Insight Partnersとの連携を心待ちにしております。
チジオケ博士 オニア マネージングディレクター, パインクレストヘルスケア株式会社購入理由
- 情報に基づいた意思決定
- 市場動向の理解
- 競合分析
- 顧客インサイト
- 市場予測
- リスク軽減
- 戦略計画
- 投資の正当性
- 新興市場の特定
- マーケティング戦略の強化
- 業務効率の向上
- 規制動向への対応


 無料サンプルを入手 - データコンバータ市場