データファブリック市場の成長、規模、シェア、傾向、主要プレーヤーの分析、2031年までの予測
過去データ : 2021-2022 | 基準年 : 2023 | 予測期間 : 2024-2031データファブリック市場の規模と予測(2021年 - 2031年)、世界および地域のシェア、トレンド、成長機会分析レポートの対象範囲:展開(オンプレミスおよびクラウド)、コンポーネント(ソフトウェアおよびサービス)、ソリューション(データ検出、データ取り込み、データオーケストレーション、ファブリックデータアクセス、データ管理、ファブリック管理)、エンドユーザー(BFSI、ITおよび通信、小売、ヘルスケアおよび製薬、その他)、および地域(北米、ヨーロッパ、アジア太平洋、南米および中米)
- ステータス : 公開されたデータ
- レポートコード : TIPTE100000792
- カテゴリー : テクノロジー、メディア、通信
- ページ数 : 150
- 利用可能なレポート形式 :


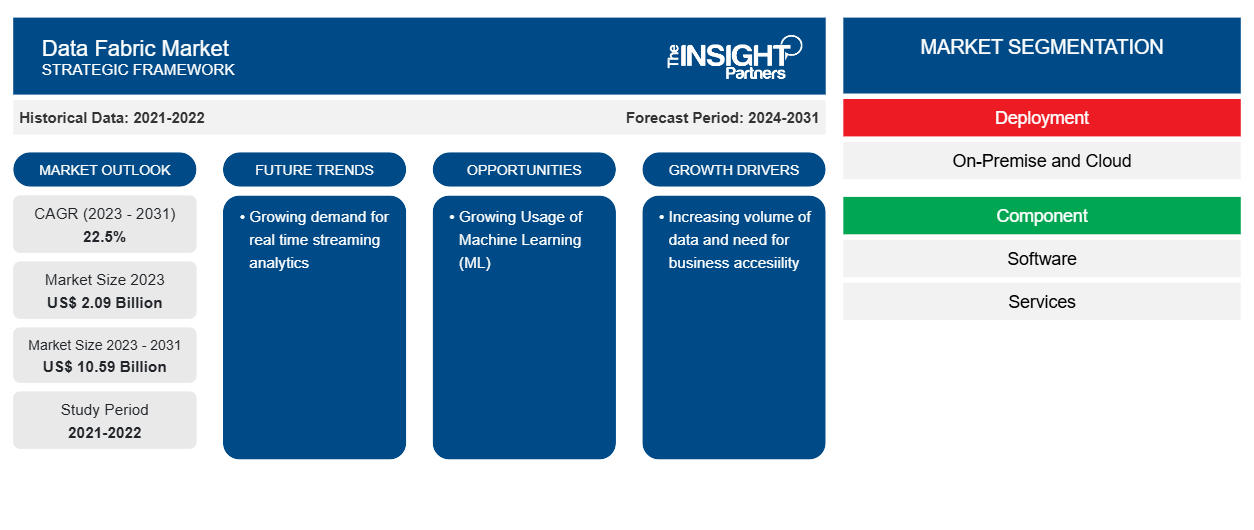
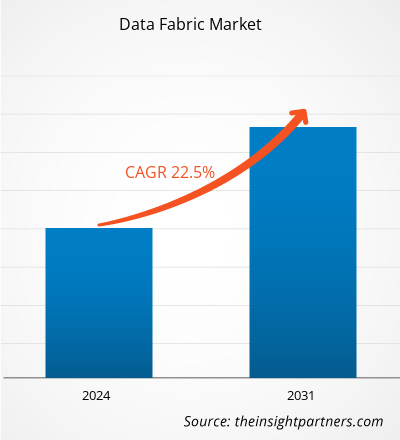
データ ファブリック市場は、2023 年の 20 億 9,000 万米ドルから 2031 年には 105 億 9,000 万米ドルに成長すると予測されており、 2023 年から 2031 年にかけて 22.5% のCAGRで拡大すると予想されています。リアルタイム ストリーミング分析に対する需要の高まりが、市場の重要なトレンドになると予想されています。
データファブリック市場分析
データ ファブリックはデータ仮想化を提供し、企業はデータへのシームレスなアクセスを実装しながら、誰もがアクセスできるようにします。データ ファブリックを実装すると、ビジネス ユーザーは IT の関与を最小限に抑えてデータにアクセスできるため、データ アクセスとデータ交換のための環境がより高速かつ容易になります。適切に設計された論理データ ファブリックは、重要なセキュリティとデータ管理を一元化します。したがって、データ ファブリック市場は予測期間中に成長すると予想されます。
データファブリック市場業界概要
データ ファブリックは、アーキテクチャ、データ管理および統合ツール、共有データなどを含む包括的なデータ統合および管理システムであり、企業のデータ管理を支援します。データ ファブリックは、組織のグローバル ネットワークのすべてのメンバーに、単一の一貫したユーザー エクスペリエンスとリアルタイムのデータ アクセスを提供します。データ ファブリックは、さまざまなアプリケーション、プラットフォーム、場所にわたってデータを管理することで、企業が複雑なデータの問題やユース ケースを解決できるように支援することを目的としています。データ ファブリックは、分散データ環境でスムーズなアクセスとデータ共有を実現します。
要件に合わせてレポートをカスタマイズする
このレポートの一部、国レベルの分析、Excelデータパックなど、あらゆるレポートを無料でカスタマイズできます。また、スタートアップや大学向けのお得なオファーや割引もご利用いただけます。
データファブリック市場:戦略的洞察
-
このレポートの主要な市場動向を入手してください。この無料サンプルには、市場動向から見積もりや予測に至るまでのデータ分析が含まれます。
データファブリック市場の推進要因と機会
データ量の増加が市場の成長を後押し
データ中心の組織では、時間、空間、さまざまなソフトウェアの種類、データの場所に対応する包括的なアプローチが必要です。データは、ファイアウォールの背後に隠されたり、複数の場所に分散されたりするのではなく、必要な人が利用できる必要があります。企業は、運用効率を向上させるために、安全で効率的で一貫性があり、将来を見据えたデータ ソリューションを必要としています。したがって、予測期間中にデータ ファブリックの需要が増加すると予想されます。
機械学習(ML)の利用拡大
MLアルゴリズムは、データパイプラインを監視し、関連するリンクと統合を提案する場合があります。これらのアルゴリズムは、データ構造にリンクされているデータから情報を抽出し、すべてのビジネスデータを確認して、関連するリンクと相関関係を見つけます。データの提供は、MLモデルのトレーニングで最も時間のかかる側面の1つです。データファブリック設計により、データ準備時間が短縮され、MLモデルの効率が向上します。また、さまざまなアプリケーションやモデルで準備されたデータの使いやすさも向上します。企業は、オンプレミス、クラウド、IoTでデータを配布します。データ構造により、安全なデータへの制限付きアクセスが可能になり、MLプロセスが強化されます。したがって、データファブリックでのMLのアプリケーションは、予測期間中に市場の成長を促進すると予想されます。
データファブリック
市場レポートのセグメンテーション分析
データ ファブリック市場分析の導出に貢献した主要なセグメントは、展開、コンポーネント、ソリューション、およびエンド ユーザーによるカバレッジです。
- 展開別に見ると、市場はオンプレミスとクラウドに分かれています。2023 年にはクラウド セグメントが市場をリードしました。
- コンポーネントに基づいて、市場はソフトウェアとサービスに分かれています
- ソリューションに基づいて、市場はデータ検出、データ取り込み、データオーケストレーション、ファブリックデータアクセス、データ管理、ファブリック管理に分かれています。
- エンドユーザーに基づいて、市場はBFSI、ITおよび通信、小売、ヘルスケアおよび医薬品、その他に分類されます。
地域別データファブリック市場シェア分析
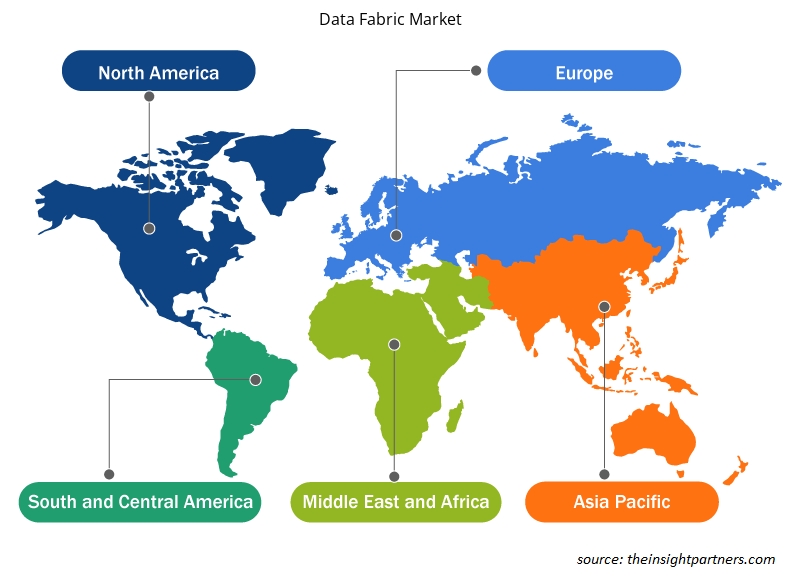
地域に基づいて、市場は北米、ヨーロッパ、アジア太平洋、中東およびアフリカ、南米および中米に分割されています。
北米地域は2023年にデータファブリック市場で大きなシェアを占め、予測期間中に大幅なCAGRで成長すると予想されています。この成長は、多数の市場プレーヤーの存在と技術採用の早期導入に起因する可能性があります。さらに、アジア太平洋地域は、予測期間中に最も速いCAGRで成長すると予想されています。この成長は、データセンター数の増加とデジタル化の進行に起因する可能性があります。
データファブリック市場の地域別分析
予測期間を通じてデータファブリック市場に影響を与える地域的な傾向と要因は、Insight Partners のアナリストによって徹底的に説明されています。このセクションでは、北米、ヨーロッパ、アジア太平洋、中東およびアフリカ、南米および中米にわたるデータファブリック市場のセグメントと地理についても説明します。
- データファブリック市場の地域別データを入手する
データファブリック市場レポートの範囲
| レポート属性 | 詳細 |
|---|---|
| 2023年の市場規模 | 20億9000万米ドル |
| 2031年までの市場規模 | 105億9000万米ドル |
| 世界のCAGR(2023年~2031年) | 22.5% |
| 履歴データ | 2021-2022 |
| 予測期間 | 2024-2031 |
| 対象セグメント |
展開別
|
| 対象地域と国 |
北米
|
| 市場リーダーと主要企業プロフィール |
|
市場プレーヤーの密度:ビジネスダイナミクスへの影響を理解する
データ ファブリック市場は、消費者の嗜好の変化、技術の進歩、製品の利点に対する認識の高まりなどの要因により、エンド ユーザーの需要が高まり、急速に成長しています。需要が高まるにつれて、企業は提供内容を拡大し、消費者のニーズを満たすために革新を起こし、新たなトレンドを活用し、市場の成長をさらに促進しています。
市場プレーヤー密度とは、特定の市場または業界内で活動している企業または会社の分布を指します。これは、特定の市場スペースに、その市場規模または総市場価値に対してどれだけの競合相手 (市場プレーヤー) が存在するかを示します。
データファブリック市場で事業を展開している主要企業は次のとおりです。
- デノドテクノロジーズ
- IBMコーポレーション
- インフォマティカ株式会社
- K2ビュー
- ネットアップ株式会社
- オラクル株式会社
免責事項:上記の企業は、特定の順序でランク付けされていません。
- データファブリック市場のトップキープレーヤーの概要を入手
データファブリック市場のニュースと最近の動向
データ ファブリック市場は、重要な企業出版物、関連データ、データベースなど、一次調査と二次調査後の定性的および定量的データを収集することによって評価されます。データ ファブリック市場の動向のいくつかを以下に示します。
- 通信技術分野の大手ベンダーである LigaData は、新しい LigaData Telecom Data Fabric 4.0 と LigaData Telecom AI アプリのリリースにより、通信データ分析業界に革命を起こしています。これらの新製品により、通信事業者や通信サービス プロバイダーは、収益の成長、市場シェアの維持、顧客体験の向上を推進しながら、従来の通信事業者からアジャイルなデータと AI 主導の技術事業者へと事業を変革する取り組みが可能になります。(出典: LigaData、プレス リリース、2024 年 2 月)
データファブリック市場レポートの対象範囲と成果物
データファブリック市場の予測は、主要な企業の出版物、協会データ、データベースなど、さまざまな二次および一次調査結果に基づいて推定されています。市場レポート「データファブリック市場の規模と予測(2021〜2031年)」では、以下の分野をカバーする市場の詳細な分析を提供しています。
- データファブリック市場規模と予測(対象範囲に含まれるすべての主要市場セグメントの世界、地域、国レベル)
- データファブリック市場の動向、および推進要因、制約、主要な機会などの市場動向
- 詳細なPEST/ポーターの5つの力とSWOT分析
- 主要な市場動向、世界および地域の枠組み、主要プレーヤー、規制、最近の市場動向を網羅したデータファブリック市場分析
- 市場集中、ヒートマップ分析、主要プレーヤー、データファブリック市場の最近の動向を網羅した業界の状況と競争分析
- 詳細な企業プロフィール。

アンキタは、テクノロジー、メディア、ICT、エレクトロニクス・半導体の各分野で8年以上の経験を持つ、ダイナミックな市場調査およびコンサルティングのプロフェッショナルです。Microsoft、Oracle、NEC、SAP、KPMG、Expeditors Internationalといったグローバルクライアントに対し、100件以上のコンサルティングおよび調査案件を主導・遂行してきました。彼女のコアコンピテンシーは、市場評価、データ分析、予測、戦略策定、競合情報、レポート作成です。
アンキタは、販売前の提案書作成やクライアントとの協議から、販売後の実用的なインサイトの提供まで、プロジェクトサイクル全体を巧みに管理することに長けています。彼女は、部門横断的なチームの管理、複雑な調査モジュールの構築、そしてクライアント固有のビジネス目標に合わせたソリューションの調整に長けています。優れたコミュニケーション能力、リーダーシップ、そしてプレゼンテーション能力により、急速に変化する市場環境において、常に価値主導の成果を生み出しています。
- 過去2年間の分析、基準年、CAGRによる予測(7年間)
- PEST分析とSWOT分析
- 市場規模価値/数量 - 世界、地域、国
- 業界と競争環境
- Excel データセット
お客様の声
Insight PartnersのSCADAシステム市場レポートは包括的で、現在のトレンドと将来の予測に関する貴重な洞察が含まれています。チームは終始、非常にプロフェッショナルで、対応が早く、サポートも充実していました。私たちは彼らのサービスに非常に満足しており、強くお勧めします。
ラン・ケデム パートナー, レアリテクノロジーズ株式会社非常に特殊なソフトウェア市場に関するレポートを依頼したところ、チームは数日でレポートを作成してくれました。情報は非常に関連性が高く、分かりやすくまとめられていました。その後、レポートにいくつか修正と追加を依頼しましたが、チームは非常に迅速に対応し、1週間も経たないうちに最終レポートを受け取ることができました。
ジャン=エルヴェ・ジェン 会長, フューチャー・アナリティカ重要な市場調査と予測のために、The Insight Partnersと協力しました。彼らは機会とリスクに関する明確な洞察を提供し、私たちの計画策定に役立ちました。彼らの調査は使いやすく、確かなデータに基づいており、賢明で自信に満ちた意思決定に役立ちました。彼らを強くお勧めします。
ピユーシュ・ナグパル 上級副社長, ハイビームグローバルInsight Partnersは、深い専門知識に基づき、洞察力に富み、構造化された市場調査を提供しました。チームは終始プロフェッショナルで、対応力も抜群でした。ユーザーフレンドリーなウェブサイトにより、業界レポートへのアクセスもスムーズでした。信頼性の高い高品質な調査サービスをお探しなら、Insight Partnersを強くお勧めします。
安達幸彦 最高経営責任者(CEO), ディープブルーLLC。The Insight Partnersから市場レポートを購入するのは今回が初めてです。最初は不安でしたが、ウェブサイトを見て、リスクを負ってでも購入してみようという気持ちになりました。レポートの品質とカスタマーサービスには大変満足しています。最初のレポートにはいくつか質問やコメントがありましたが、アナリストとメールで何度かやり取りした結果、戦略策定プロセスへのインプットとして活用できるレポートが完成しました。貴重なお時間を割いていただき、貴重な体験をさせていただき、誠にありがとうございました。他の方にもぜひお勧めしたいですし、今後さらに市場データが必要になった際には、まずThe Insight Partnersにご連絡させていただきます。
ジョン・スズキ 社長兼最高経営責任者、取締役, BKテクノロジーズナイジェリアの感染症IVD市場に関する情報提供依頼に対し、ご対応いただいた際、ご尽力とプロフェッショナルな姿勢に深く感謝申し上げます。忍耐強く、的確なアドバイスをいただき、また、最終的に取引成立に至った割引のご提供にも深く感謝申し上げます。今回の最初の出会いで得た強い印象のおかげで、今後もThe Insight Partnersとの連携を心待ちにしております。
チジオケ博士 オニア マネージングディレクター, パインクレストヘルスケア株式会社購入理由
- 情報に基づいた意思決定
- 市場動向の理解
- 競合分析
- 顧客インサイト
- 市場予測
- リスク軽減
- 戦略計画
- 投資の正当性
- 新興市場の特定
- マーケティング戦略の強化
- 業務効率の向上
- 規制動向への対応


 無料サンプルを入手 - データファブリック市場