
デジタルツイン市場戦略、トッププレーヤー、成長機会、分析、2031年までの予測
デジタルツイン市場の規模と予測(2021年 - 2031年)、世界および地域のシェア、トレンド、成長機会分析レポートの対象範囲:タイプ別(アセットツイン、システムツイン、プロセスツイン、部品/コンポーネントツイン)、企業規模別(大企業および中小企業)、エンドユーザー別(製造業、自動車産業、航空宇宙および防衛産業、ヘルスケア産業、小売業、その他)、および地域別
- ステータス : 出版
- レポートコード : TIPRE00017045
- カテゴリー : テクノロジー、メディア、通信
- ページ数 : 185
- 利用可能なレポート形式 :


- 最終更新日 : May 22, 2026

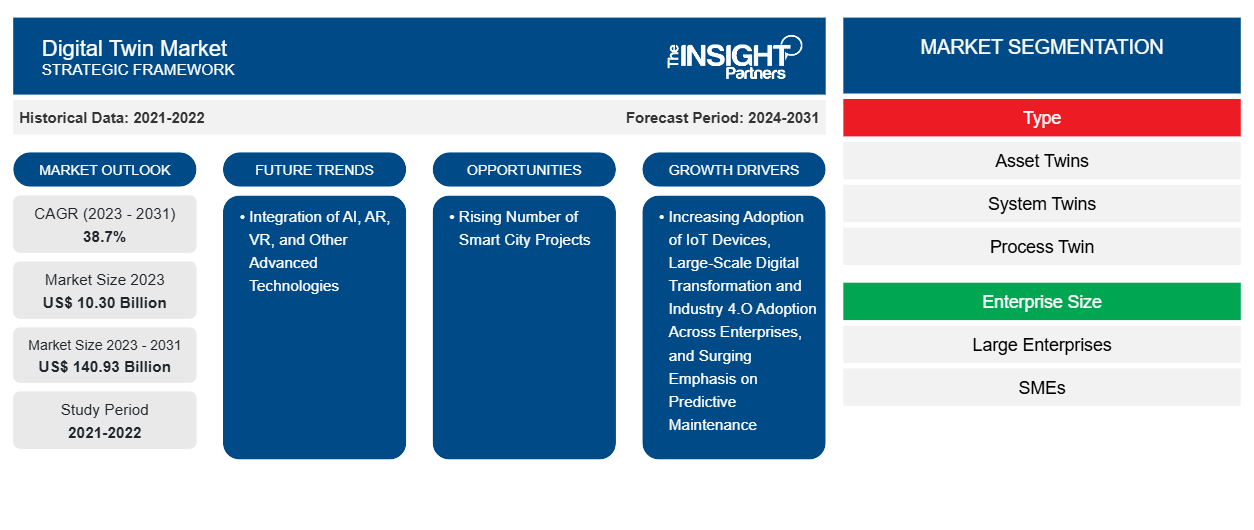
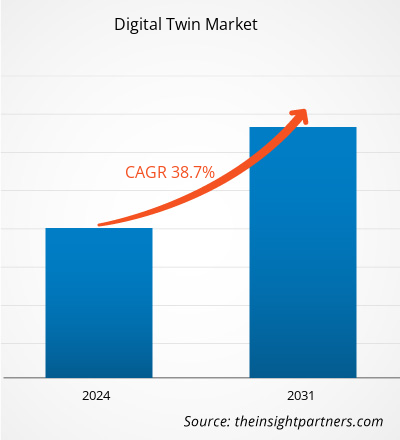
デジタルツインの市場規模は、2023年の103億米ドルから2031年には1,409.3億米ドルに達すると予想されています。市場は2023年から2031年にかけて38.7%のCAGRを記録すると予測されています。AI、AR、VR、その他の先進技術の統合は、引き続き主要な市場トレンドとなると思われます。
デジタルツイン市場分析
デジタルツイン技術はさまざまな業界に革命を起こしており、製造業の未来を形作る可能性を秘めています。クラウドソリューションとサービスの利用増加、政府や産業部門によるデジタル変革対策、持続可能性の重視は、デジタルツイン市場の成長を促進する主な要因の一部です。デジタルツインは、COVID-19パンデミックの際にさらに注目を集めました。デジタルツインを使用すると、病気の蔓延に寄与することなく企業が効率的に運営できるからです。この技術は、患者の非接触型体温スキャン、インテリジェントな交通管理、COVID-19が患者の健康に与える長期的な影響を理解するための調査研究に役立ちました。デジタルツインの実装により、エンドユーザーはパフォーマンスを向上させ、運用コストを削減し、さまざまなレベルで利便性を提供することができました。
デジタルツイン市場の概要
デジタル ツインは、実際のオブジェクトまたは環境の仮想表現です。オブジェクトに接続されたセンサーから取得したリアルタイム データを使用して構築され、そのライフサイクル全体にわたって複製されます。したがって、デジタル ツインは、仮想環境で資産の特徴、機能、動作、およびその他のパラメーターをデジタルで複製します。工場内の個々の機械から、風力タービンや都市全体などの巨大な設備まで、さまざまな現実世界のオブジェクトをデジタル ツインとして複製できます。組織は、デジタル ツイン テクノロジを使用して、資産のパフォーマンスを監視し、運用上の問題を検出し、メンテナンスの必要性を判断します。また、資産データを使用して資産の寿命を予測することもできます。アセット ツイン、システム ツイン、プロセス ツイン、パーツ/コンポーネント ツインは、さまざまな業界で人気のあるさまざまな種類のデジタル ツインです。デジタル ツインは、人工知能 (AI)、モノのインターネット (IoT)、拡張現実 (AR)、仮想現実 (VR)、シミュレーションなどの高度なテクノロジを使用して、オブジェクトのデジタル モデルを作成します。
要件に合わせてレポートをカスタマイズする
このレポートの一部、国レベルの分析、Excelデータパックなど、あらゆるレポートを無料でカスタマイズできます。また、スタートアップや大学向けのお得なオファーや割引もご利用いただけます。
デジタルツイン市場:戦略的洞察
-
このレポートの主要な市場動向を入手してください。この無料サンプルには、市場動向から見積もりや予測に至るまでのデータ分析が含まれます。
デジタルツイン市場の推進要因と機会
IoTデバイスの採用増加が市場を有利に導く
IoT は、相互接続されたデバイスの広範囲にわたるネットワークと、これらのデバイスとクラウド間の通信を可能にするテクノロジーを指します。最近では、モバイルおよびワイヤレス接続テクノロジーの進歩と、センサーやその他のコンポーネントのコストの段階的な低下により、IoT テクノロジーの採用が急増しています。いくつかの業界では、効率を改善し、運用コストを削減するために IoT を使用しています。Finance Online によると、2023 年 11 月の時点で接続された IoT デバイスは約 147 億 6,000 万台あり、この数字は 2030 年までに約 254 億 4,000 万台に増加すると予想されています。IoT Analytics の予測によると、2030 年までに使用されるデバイス全体の 75% が IoT になると予想されています。さらに、FinleyUSA は、2023 年の世界の IoT 支出を 1.1 兆米ドルと推定しています。IoT の採用が急増するにつれて、デジタル ツインの使用が増加しています。IoT デバイスがデータを送信すると、デジタル ツインがデータをリアルタイムで更新し、仮想モデルが物理エンティティと同期していることを保証します。 IoT を活用することで、デジタル ツインは風力タービンなどの複雑な機器や小売店での顧客活動などのプロセスを表現できます。そのため、IoT デバイスの採用が増えることで、デジタル ツイン市場が拡大しています。
スマートシティプロジェクトの増加
より快適な生活のためのテクノロジーへの依存は、世界中の消費者やコミュニティのライフスタイルの進化とともに高まっています。スマート シティは、最適化された都市機能を備えた新しい生活様式を促進し、スマート テクノロジーとデータ分析を使用することで経済成長と消費者の生活の質の向上を可能にする可能性があるため、過去数十年で大きな注目を集めています。TWI Ltd. によると、世界の人口の 54% が都市に住んでおり、その数は 2050 年までに 66% に増加すると予想されています。予測される人口増加は、スマート シティの助けを借りて、環境、社会、経済の持続可能性を管理する必要性が高まっていることを示しています。デジタル ツインは、スマート シティが環境、経済、社会の持続可能性の目標を達成するのに役立ちます。仮想モデルは、計画の決定を導き、スマート シティが直面するさまざまな複雑な課題に対するソリューションを提供します。スマート シティの計画者は、デジタル ツイン テクノロジーを使用して、交通システム、水道および廃水ネットワーク、エネルギー グリッド、通信などのインフラストラクチャを設計、監視、管理できます。したがって、スマート シティ プロジェクトの数の増加は、今後数年間でデジタル ツイン市場に成長の機会をもたらすでしょう。
デジタルツイン市場レポートのセグメンテーション分析
デジタルツイン市場分析のタイプ、企業規模、エンドユーザーの導出に貢献した主要セグメント。
- タイプに基づいて、市場はアセットツイン、システムツイン、プロセスツイン、およびパーツ/コンポーネントツインに分類されます。アセットツインセグメントは2023年に最大の市場シェアを占めました。
- 企業規模に基づいて、市場は大企業と中小企業に分かれています。2023年には大企業セグメントが市場を支配しました。
- エンドユーザーに基づいて、デジタルツイン市場は製造業、自動車産業、航空宇宙および防衛産業、ヘルスケア産業、小売業、その他に分類されます。2023年には製造業セグメントが市場を支配しました。
地域別デジタルツイン市場シェア分析
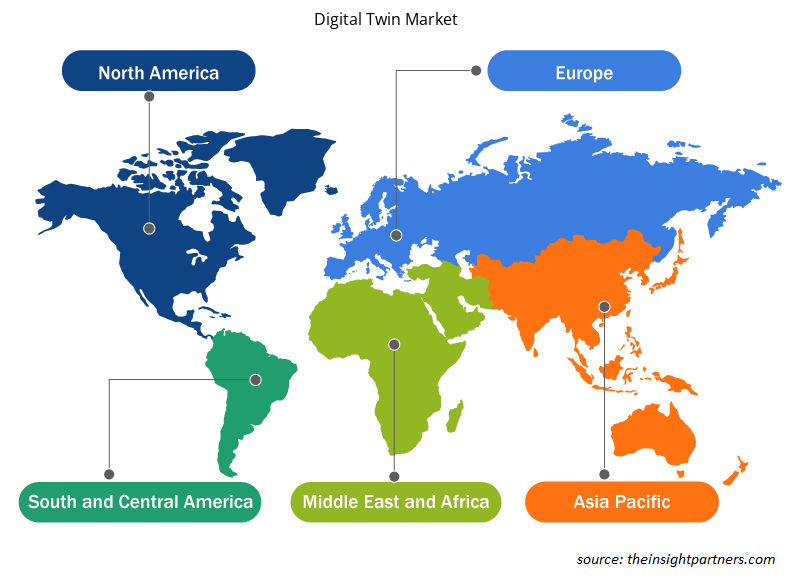
- デジタルツイン市場は、北米、ヨーロッパ、アジア太平洋 (APAC)、中東およびアフリカ (MEA)、南米および中米の 5 つの主要地域に分割されています。
- 2023年、北米は世界のデジタルツイン市場シェアを独占しました。北米は、技術革新と先進技術の採用の面で最も急速に成長している地域の1つです。この地域では、過去3年間にすべての主要な業界分野で機械学習(ML)、人工知能(AI)、ブロックチェーンなどの技術が大量に採用されました。さまざまな業界でデジタル化が浸透するにつれて、デジタルツインはビジネスの重要な要素になっています。さらに、この地域にはIBM Corporation、Oracle、Microsoft、ANSYS、Inc、PTCなどの主要な市場プレーヤーの大半が拠点を置いており、北米のデジタルツイン市場の成長につながっています。
デジタルツイン市場の地域別洞察
予測期間を通じてデジタルツイン市場に影響を与える地域的な傾向と要因は、Insight Partners のアナリストによって徹底的に説明されています。このセクションでは、北米、ヨーロッパ、アジア太平洋、中東、アフリカ、南米、中米にわたるデジタルツイン市場のセグメントと地理についても説明します。
- デジタルツイン市場の地域別データを入手
デジタルツイン市場レポートの範囲
| レポート属性 | 詳細 |
|---|---|
| 2023年の市場規模 | 103億米ドル |
| 2031年までの市場規模 | 1,409.3億米ドル |
| 世界のCAGR(2023年~2031年) | 38.7% |
| 履歴データ | 2021-2022 |
| 予測期間 | 2024-2031 |
| 対象セグメント |
タイプ別
|
| 対象地域と国 |
北米
|
| 市場リーダーと主要企業プロフィール |
|
市場プレーヤーの密度:ビジネスダイナミクスへの影響を理解する
デジタル ツイン市場は、消費者の嗜好の変化、技術の進歩、製品の利点に対する認識の高まりなどの要因により、エンド ユーザーの需要が高まり、急速に成長しています。需要が高まるにつれて、企業は提供内容を拡大し、消費者のニーズを満たすために革新を起こし、新たなトレンドを活用し、市場の成長をさらに促進しています。
市場プレーヤー密度とは、特定の市場または業界内で活動している企業または会社の分布を指します。これは、特定の市場スペースに、その規模または総市場価値と比較して、どれだけの競合相手 (市場プレーヤー) が存在するかを示します。
デジタルツイン市場で活動している主要企業は次のとおりです。
- ゼネラル・エレクトリック
- マイクロソフト
- シーメンスAG
- ダッソー・システムズ SE
- PTC株式会社
- ロバート・ボッシュ GmbH
免責事項:上記の企業は、特定の順序でランク付けされていません。
- デジタルツイン市場のトップキープレーヤーの概要を入手
デジタルツイン市場のニュースと最近の動向
デジタル ツイン市場は、重要な企業出版物、協会データ、データベースなどの一次調査と二次調査後の定性的および定量的データを収集することによって評価されます。デジタル ツイン市場の動向のいくつかを以下に示します。
- シーメンスとマイクロソフトは、デジタル ツイン定義言語 (DTDL) を国際標準化機構 W3C の Thing Description 標準に統合する取り組みを発表しました。両言語を統合することで、顧客には一貫したモデリング エクスペリエンスが提供され、進化する IoT 環境における断片化が緩和されます。顧客は通常、インフラストラクチャに複数のベンダーを組み合わせて導入し、ロックインや高度な統合作業につながりますが、この統合により、システム統合と相互運用性が簡素化されます。
(出典:シーメンス、プレスリリース、2024年4月)
- 英国を拠点とする新しいグローバル テクノロジー企業である Helixx は、革新的な電気自動車製造システムの設計、開発、検証、提供、管理を支援するために、Siemens Xcelerator の業界ソフトウェアおよびサービスのポートフォリオを選択しました。
(出典:Helixx、プレスリリース、2023年6月)
デジタルツイン市場レポートの対象範囲と成果物
「デジタルツイン市場規模と予測(2021〜2031年)」では、以下の分野をカバーする市場の詳細な分析を提供します。
- 対象範囲に含まれるすべての主要市場セグメントについて、世界、地域、国レベルでのデジタルツイン市場規模と予測
- デジタルツイン市場の動向、推進要因、制約、主要な機会などの市場動向
- 詳細なPEST/ポーターの5つの力とSWOT分析
- 主要な市場動向、世界および地域の枠組み、主要プレーヤー、規制、最近の市場動向を網羅したデジタルツイン市場分析
- 市場集中、ヒートマップ分析、主要プレーヤー、デジタルツイン市場の最近の動向を網羅した業界の状況と競争分析
- 詳細な企業プロフィール

アンキタは、テクノロジー、メディア、ICT、エレクトロニクス・半導体の各分野で8年以上の経験を持つ、ダイナミックな市場調査およびコンサルティングのプロフェッショナルです。Microsoft、Oracle、NEC、SAP、KPMG、Expeditors Internationalといったグローバルクライアントに対し、100件以上のコンサルティングおよび調査案件を主導・遂行してきました。彼女のコアコンピテンシーは、市場評価、データ分析、予測、戦略策定、競合情報、レポート作成です。
アンキタは、販売前の提案書作成やクライアントとの協議から、販売後の実用的なインサイトの提供まで、プロジェクトサイクル全体を巧みに管理することに長けています。彼女は、部門横断的なチームの管理、複雑な調査モジュールの構築、そしてクライアント固有のビジネス目標に合わせたソリューションの調整に長けています。優れたコミュニケーション能力、リーダーシップ、そしてプレゼンテーション能力により、急速に変化する市場環境において、常に価値主導の成果を生み出しています。
- 包括的な市場規模および予測分析
- 詳細なセグメンテーション分析
- 市場動向(ダイナミクス)の徹底的な評価
- 地域および国別のインサイト
- 競争環境および企業ベンチマーク
- 戦略的ビジネスインテリジェンス
お客様の声
Insight PartnersのSCADAシステム市場レポートは包括的で、現在のトレンドと将来の予測に関する貴重な洞察が含まれています。チームは終始、非常にプロフェッショナルで、対応が早く、サポートも充実していました。私たちは彼らのサービスに非常に満足しており、強くお勧めします。
ラン・ケデム パートナー, レアリテクノロジーズ株式会社非常に特殊なソフトウェア市場に関するレポートを依頼したところ、チームは数日でレポートを作成してくれました。情報は非常に関連性が高く、分かりやすくまとめられていました。その後、レポートにいくつか修正と追加を依頼しましたが、チームは非常に迅速に対応し、1週間も経たないうちに最終レポートを受け取ることができました。
ジャン=エルヴェ・ジェン 会長, フューチャー・アナリティカ重要な市場調査と予測のために、The Insight Partnersと協力しました。彼らは機会とリスクに関する明確な洞察を提供し、私たちの計画策定に役立ちました。彼らの調査は使いやすく、確かなデータに基づいており、賢明で自信に満ちた意思決定に役立ちました。彼らを強くお勧めします。
ピユーシュ・ナグパル 上級副社長, ハイビームグローバルInsight Partnersは、深い専門知識に基づき、洞察力に富み、構造化された市場調査を提供しました。チームは終始プロフェッショナルで、対応力も抜群でした。ユーザーフレンドリーなウェブサイトにより、業界レポートへのアクセスもスムーズでした。信頼性の高い高品質な調査サービスをお探しなら、Insight Partnersを強くお勧めします。
安達幸彦 最高経営責任者(CEO), ディープブルーLLC。The Insight Partnersから市場レポートを購入するのは今回が初めてです。最初は不安でしたが、ウェブサイトを見て、リスクを負ってでも購入してみようという気持ちになりました。レポートの品質とカスタマーサービスには大変満足しています。最初のレポートにはいくつか質問やコメントがありましたが、アナリストとメールで何度かやり取りした結果、戦略策定プロセスへのインプットとして活用できるレポートが完成しました。貴重なお時間を割いていただき、貴重な体験をさせていただき、誠にありがとうございました。他の方にもぜひお勧めしたいですし、今後さらに市場データが必要になった際には、まずThe Insight Partnersにご連絡させていただきます。
ジョン・スズキ 社長兼最高経営責任者、取締役, BKテクノロジーズナイジェリアの感染症IVD市場に関する情報提供依頼に対し、ご対応いただいた際、ご尽力とプロフェッショナルな姿勢に深く感謝申し上げます。忍耐強く、的確なアドバイスをいただき、また、最終的に取引成立に至った割引のご提供にも深く感謝申し上げます。今回の最初の出会いで得た強い印象のおかげで、今後もThe Insight Partnersとの連携を心待ちにしております。
チジオケ博士 オニア マネージングディレクター, パインクレストヘルスケア株式会社購入理由
- 情報に基づいた意思決定
- 市場動向の理解
- 競合分析
- 顧客インサイト
- 市場予測
- リスク軽減
- 戦略計画
- 投資の正当性
- 新興市場の特定
- マーケティング戦略の強化
- 業務効率の向上
- 規制動向への対応


