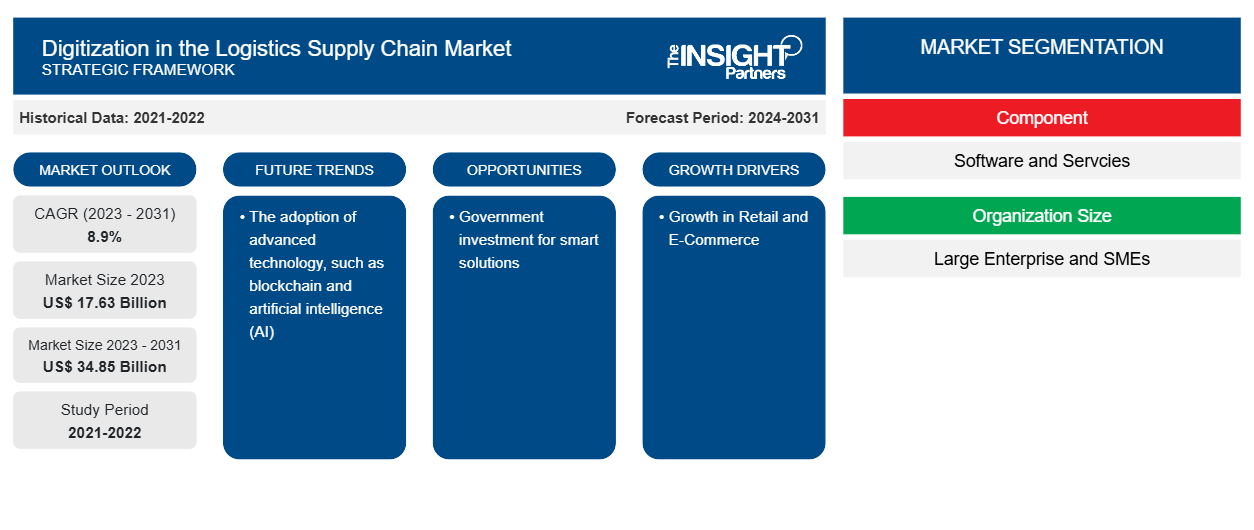
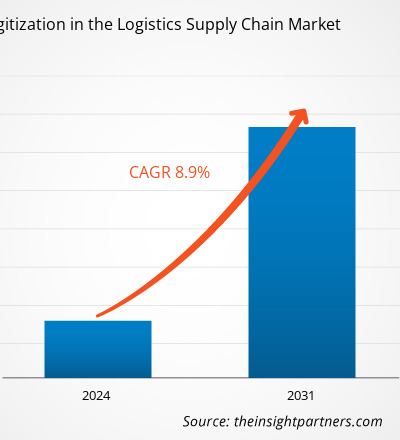
物流サプライチェーンのデジタル化市場規模は、2023年の176億3,000万米ドルから2031年には348億5,000万米ドルに達すると予測されています。市場は2023年から2031年にかけて8.9%のCAGRを記録すると予想されています。サプライチェーン管理の需要の増加と小売および電子商取引業界の増加は、物流サプライチェーン市場の動向における主要なデジタル化であり続けると思われます。
物流サプライチェーンのデジタル化市場分析
自動車、小売、電子商取引、製造、ヘルスケアなど、さまざまな業界で自動化が進み、人的ミスが減ったことで、これらの業界の運営者は大きな恩恵を受けています。たとえば、世界中の小売業は継続的に成長しており、今後もさらに成長すると予想されています。そのため、成長を続ける小売業界では、サプライチェーンと物流の在庫管理や管理における手作業を排除することで、総運用コストを削減することに重点を置いています。小売業界全体で自動化ソリューションの需要が市場を牽引しています。複数の業界の物流部門では、関係者がミスの最小化、業務の強化、時間通りの配達に傾倒しているため、デジタル変革が進んでおり、これが市場を牽引しています。
物流サプライチェーン市場におけるデジタル化の概要
デジタル変革の進展により、従来のビジネス モデルはより効果的かつ効率的なものへと変化しています。デジタル テクノロジーの導入により、さまざまな業界の市場プレーヤーはビジネス モデルを最適化し、他のプレーヤーに対して競争上の優位性を獲得できます。物流サプライ チェーン業務をデジタル化することで、人件費の削減、プロセスの迅速化、エラーの最小化が可能になります。人工知能 (AI) などのより高度なテクノロジーを導入することで、高度な分析によって効果的なビジネス上の意思決定を行うことができます。
要件に合わせてレポートをカスタマイズする
このレポートの一部、国レベルの分析、Excelデータパックなど、あらゆるレポートを無料でカスタマイズできます。また、スタートアップや大学向けのお得なオファーや割引もご利用いただけます。
- このレポートの主要な市場動向を入手してください。この無料サンプルには、市場動向から見積もりや予測に至るまでのデータ分析が含まれます。
物流サプライチェーンのデジタル化市場の推進要因と機会
小売業と電子商取引の成長が市場を有利に導く
個人の収入と購買力の向上は、小売業と電子商取引業界の成長につながる主な要因です。モバイルの普及とインターネット接続の増加により、小売業の実現可能性と容易なアクセスが提供され、電子商取引業界の成長につながっています。インドブランドエクイティ財団(IBEF)によると、米国、カナダ、ドイツ、英国、中国、日本、フランス、オーストラリア、スイス、イタリア、インドなどの国々は、堅調な小売市場を抱えています。物流サプライチェーンのデジタル化は、サプライチェーンの関係者が業務を最適化するのに役立ちます。デジタル化は、サプライチェーン内の注文と原材料のリアルタイムの追跡とトレースに役立ちます。メーカー、サプライヤー、ディストリビューター、小売業者間の効率的な調整を促進し、コストを削減し、品質を向上させ、顧客の要求を満たすのに役立ちます。したがって、小売業と電子商取引の成長は、サプライチェーンと物流ワークフローを強化するソリューションの需要を促進し、それが物流サプライチェーン市場の成長におけるデジタル化をさらに促進します。
スマートソリューションへの政府投資 - 物流サプライチェーン市場におけるデジタル化のチャンス
政府は、世界中でデジタル化を推進するために、スマート ソリューションに投資しています。スマート ソリューションを導入することで、生産性の向上、運用の最適化、投資収益率の向上が実現します。また、複雑なビジネス モデルを簡素化し、運用の迅速化を促進するのに役立ちます。
- 2023年9月、バイデン・ハリス政権はスマート輸送技術に1億6000万ドルを投資すると発表しました。この投資は、配送と物流、交通信号、スマートグリッド、データ統合などのシステム革新にも重点を置いています。
- 2023年2月、インドの財務大臣はインド貨物専用鉄道公社(DFCC)に約33億6,350万米ドル(27,482億ルピー)の予算配分を発表した。これは前年比75%増となる。予算演説では、港湾、石炭、鉄鋼、肥料、食糧穀物のラストマイルとファーストマイルの配送など、100の重要な輸送インフラプロジェクトの優先順位付けが強調された。
したがって、このような投資は物流およびサプライチェーン分野のデジタル化を促進し、市場成長の機会として機能する可能性があります。
物流サプライチェーン市場レポートのデジタル化セグメンテーション分析
物流サプライチェーン市場分析におけるデジタル化の導出に貢献した主要なセグメントは、コンポーネント、組織規模、および業界です。
- コンポーネントに基づいて、市場はソフトウェアとサービスに分かれています。ソフトウェアセグメントは2023年に大きな市場シェアを占めました。
- 組織規模別に見ると、市場は大企業と中小企業に分かれています。2023年には大企業セグメントが市場で最大のシェアを占めました。
- 業界別に見ると、市場は小売・電子商取引、ヘルスケア、製造、自動車、その他に分類されています。小売・電子商取引セグメントは、2023年に最大の市場シェアを占めました。
物流サプライチェーンのデジタル化 地域別市場シェア分析
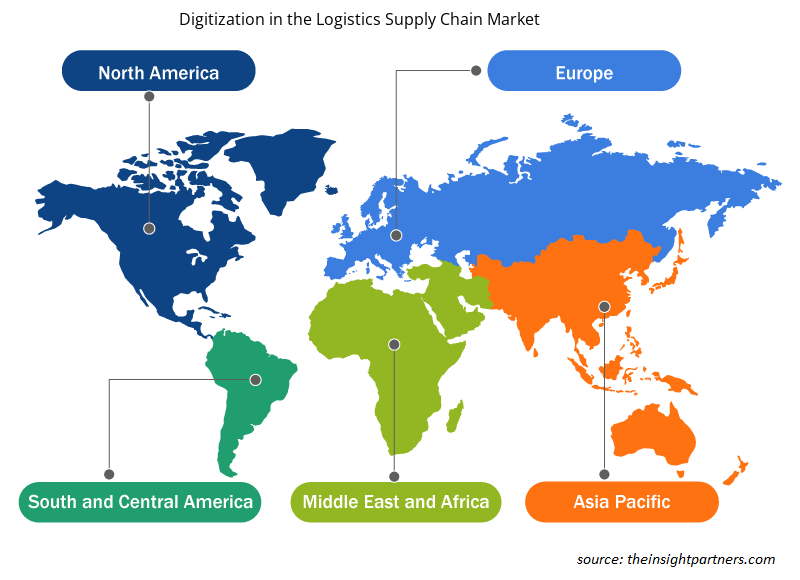
物流サプライチェーン市場レポートにおけるデジタル化の地理的範囲は、主に北米、アジア太平洋、ヨーロッパ、中東およびアフリカ、南米/中南米の 5 つの地域に分かれています。
収益の面では、北米が物流サプライチェーンの市場シェアで最大のデジタル化を占めています。北米の主要国には、米国、カナダ、メキシコなどがあります。この地域は技術的に高度なソリューションを早期に導入しており、これが市場の成長を促進する重要な要因の1つです。この地域の小売およびeコマース業界の台頭により、サプライチェーンと物流活動を最適化するデジタルソリューションの需要が生まれ、市場が活性化しています。米国商務省によると、米国の小売および食品サービスの売上高は、2024年2月に2024年1月と比較して0.6%増加しました。さらに、国際貿易局によると、2022年にはカナダの全人口の約75%がeコマースユーザーであり、2025年までに77.6%に増加すると予想されています。カナダではオンラインで商品を購入する人が増加しており、製品配送業務などのeコマース活動の増加に貢献しています。
物流サプライチェーン市場のデジタル化に関する地域別洞察
予測期間を通じて物流サプライチェーン市場のデジタル化に影響を与える地域的な傾向と要因は、Insight Partners のアナリストによって徹底的に説明されています。このセクションでは、北米、ヨーロッパ、アジア太平洋、中東、アフリカ、南米、中米にわたる物流サプライチェーン市場のセグメントと地理についても説明します。

- 物流サプライチェーン市場のデジタル化に関する地域固有のデータを入手
物流サプライチェーン市場レポートのデジタル化の範囲
レポート属性 | 詳細 |
---|---|
2023年の市場規模 | 176.3億米ドル |
2031年までの市場規模 | 348.5億米ドル |
世界のCAGR(2023年~2031年) | 8.9% |
履歴データ | 2021-2022 |
予測期間 | 2024-2031 |
対象セグメント | コンポーネント別
|
対象地域と国 | 北米
|
市場リーダーと主要企業プロフィール |
|
物流サプライチェーン市場のデジタル化:プレーヤー密度:ビジネスダイナミクスへの影響を理解する
物流サプライチェーン市場のデジタル化は、消費者の嗜好の変化、技術の進歩、製品の利点に対する認識の高まりなどの要因により、エンドユーザーの需要が高まり、急速に成長しています。需要が高まるにつれて、企業は提供を拡大し、消費者のニーズを満たすために革新し、新たなトレンドを活用し、市場の成長をさらに促進しています。
市場プレーヤー密度とは、特定の市場または業界内で活動している企業または会社の分布を指します。これは、特定の市場スペースに、その規模または総市場価値と比較して、どれだけの競合相手 (市場プレーヤー) が存在するかを示します。
物流サプライチェーン市場のデジタル化に取り組んでいる主要企業は次のとおりです。
- SAP SE
- オラクル株式会社
- IBM
- インテルコーポレーション
- インフォア
- ヘクサウェアテクノロジーズリミテッド
免責事項:上記の企業は、特定の順序でランク付けされていません。

- 物流サプライチェーン市場のデジタル化に関する主要プレーヤーの概要
物流サプライチェーンのデジタル化に関する市場ニュースと最近の動向
物流サプライチェーン市場におけるデジタル化は、主要な企業出版物、協会データ、データベースを含む一次調査と二次調査後の定性的および定量的データを収集することによって評価されます。以下は、市場における動向のリストです。
- 富士通は2023年12月、サプライチェーン全体の荷主、物流会社、ベンダー向けに、クラウドベースの新しい物流データ標準化・可視化サービスを開始すると発表しました。このサービスは、迫りくるトラック運転手不足、輸送における二酸化炭素排出量削減の緊急の必要性、厳格化する業界規制への準拠など、さまざまな課題に対処し、業務の持続可能性を実現するための新しいツールを顧客に提供します。(出典:富士通、プレスリリース、2023年)
- 2024 年 1 月、大手サプライ チェーン ソリューション プロバイダーの Blue Yonder は、同社史上最大の製品アップデートのリリースを発表し、同社の Luminate Cognitive Platform 上で提供される、計画から倉庫、輸送、商取引まで、サプライ チェーン全体にわたる初の相互運用可能なソリューション セットを立ち上げました。相互運用性を活用することで、Blue Yonder は生産性の向上、無駄の削減、より回復力のあるサプライ チェーンを顧客に提供できます。(出典: Blue Yonder、プレス リリース、2024 年)
物流サプライチェーン市場におけるデジタル化レポートの対象範囲と成果物
「物流サプライチェーンのデジタル化市場規模と予測(2021〜2031年)」レポートでは、以下の分野をカバーする市場の詳細な分析を提供しています。
- 対象範囲に含まれるすべての主要市場セグメントの世界、地域、国レベルでの市場規模と予測
- 市場の動向(推進要因、制約、主要な機会など)
- 今後の主な動向
- 詳細なPEST/ポーターの5つの力とSWOT分析
- 主要な市場動向、主要プレーヤー、規制、最近の市場動向を網羅した世界および地域の市場分析
- 市場集中、ヒートマップ分析、主要プレーヤー、最近の動向を網羅した業界の状況と競争分析
- 詳細な企業プロフィール
よくある質問
The global digitization in the logistics supply chain market was estimated to be US$ 17.63 billion in 2023 and is expected to grow at a CAGR of 8.9% during the forecast period 2023 - 2031.
Increasing demand for digital solutions across various industries and growth in the retail and e-commerce industry are the major factors that propel global digitization in the logistics supply chain market.
The adoption of advanced technology, such as blockchain and artificial intelligence (AI), is anticipated to play a significant role in the global digitization of the logistics supply chain market in the coming years.
The global digitization in the logistics supply chain market is expected to reach US$ 34.85 billion by 2031.
The key players holding majority shares in the global digitization in the logistics supply chain market are SAP SE, Oracle Corporation, Infor, IBM, and Intel Corporation.
- 過去2年間の分析、基準年、CAGRによる予測(7年間)
- PEST分析とSWOT分析
- 市場規模価値/数量 - 世界、地域、国
- 業界と競争環境
- Excel データセット
お客様の声
購入理由
- 情報に基づいた意思決定
- 市場動向の理解
- 競合分析
- 新興市場の特定
- 顧客インサイト
- 市場予測
- リスク軽減
- 業務効率の向上
- 戦略計画
- 投資の正当性
- 業界イノベーションの追跡
- 規制動向への対応
はい!レポートの範囲(目次)、レポートの構成、そしてレポート全体の価値を評価するのに役立つ厳選されたインサイトを含む、レポートの無料サンプルをご提供しています。 「サンプルをダウンロード」ボタンをクリックするか、お問い合わせの上、サンプルをお送りください。
はい、アナリストによるサポートはパッケージに含まれています。ご購入後、アナリストにご連絡いただき、レポートの洞察や手法についてご説明したり、調査結果がお客様のビジネスニーズにどのように当てはまるかご相談いただけます。
ご注文が完了すると、確認メールと請求書が届きます。
• 公開済みレポートの場合:4~6営業時間以内に、セキュリティ保護されたメールがお客様のメールアドレスに送信されます。
• 近日公開予定レポートの場合:ご注文は事前予約として記録されます。リリース予定日については、担当チームからご連絡し、最新情報をお知らせいたします。レポートが公開され次第、ご登録いただいたメールアドレスに配信いたします。
お客様の特定の目的に合わせてレポートをカスタマイズするためのオプションをご用意しております。特定の地域、業界セグメント、競合他社の分析、データカットなど、より深い洞察が必要な場合でも、当社のリサーチチームがそれに応じてレポートをカスタマイズいたします。ご要望をお聞かせください。お客様に合わせたご提案やスコープを喜んでご提供いたします。
レポートは、選択したライセンスに応じて、PDF形式またはExcelデータセットで提供されます。
PDF版では、完全な分析とビジュアルがすぐに読める形式で提供されます。Excelデータセットには、すべてのデータテーブルが含まれており、簡単に操作して詳細な分析を行うことができます。
ご購入時にライセンスオプションをご確認ください。または、ご購入に含まれる形式を確認するには、お問い合わせください。
当社の決済プロセスは完全に安全で、PCI-DSSに準拠しています。
当社は、すべての取引が業界標準のSSL暗号化で保護されるよう、信頼性の高い暗号化された決済ゲートウェイを使用しています。お支払い情報は当社のサーバーに保存されることはありません。認定されたサードパーティの決済代行業者によって安全に処理されます。
お客様の個人情報と財務情報は当社で安全に保管されますので、安心してご購入いただけます。
はい、まとめ買いの場合は特別価格をご用意しております。
複数のレポートをご購入いただく場合は、お客様のニーズに合わせてカスタマイズされたバンドルオファーまたは数量ベースの割引をご提供いたします。ご検討中のレポートのリストを弊社の営業チームまでお送りください。お客様に合わせたお見積もりをお送りいたします。
はい、もちろんです。
弊社のチームが、お客様が十分な情報に基づいて意思決定できるようお手伝いいたします。レポートの範囲、方法論、カスタマイズオプション、最適なライセンスなど、ご質問がございましたら、お気軽にお問い合わせください。 sales@theinsightpartners.com までご連絡ください。担当者が速やかにご連絡いたします。
はい、ご購入が完了すると請求書が自動的に生成され、ご登録いただいたメールアドレスに送信されます。
特定の形式で請求書が必要な場合や、追加情報(会社名、GST、VAT情報など)が必要な場合は、お気軽にお問い合わせください。喜んでご対応させていただきます。
はい、もちろんです。
レポートへのアクセスや受信に問題が発生した場合は、サポートチームがサポートいたします。ご注文情報を添えて、メールまたはライブチャットでお問い合わせください。問題を迅速に解決し、お客様が中断することなくレポートにアクセスできるようお手伝いいたします。


The Insight Partners performs research in 4 major stages: Data Collection & Secondary Research, Primary Research, Data Analysis and Data Triangulation & Final Review.
- Data Collection and Secondary Research:
As a market research and consulting firm operating from a decade, we have published and advised several client across the globe. First step for any study will start with an assessment of currently available data and insights from existing reports. Further, historical and current market information is collected from Investor Presentations, Annual Reports, SEC Filings, etc., and other information related to company’s performance and market positioning are gathered from Paid Databases (Factiva, Hoovers, and Reuters) and various other publications available in public domain.
Several associations trade associates, technical forums, institutes, societies and organization are accessed to gain technical as well as market related insights through their publications such as research papers, blogs and press releases related to the studies are referred to get cues about the market. Further, white papers, journals, magazines, and other news articles published in last 3 years are scrutinized and analyzed to understand the current market trends.
- Primary Research:
The primarily interview analysis comprise of data obtained from industry participants interview and answers to survey questions gathered by in-house primary team.
For primary research, interviews are conducted with industry experts/CEOs/Marketing Managers/VPs/Subject Matter Experts from both demand and supply side to get a 360-degree view of the market. The primary team conducts several interviews based on the complexity of the markets to understand the various market trends and dynamics which makes research more credible and precise.
A typical research interview fulfils the following functions:
- Provides first-hand information on the market size, market trends, growth trends, competitive landscape, and outlook
- Validates and strengthens in-house secondary research findings
- Develops the analysis team’s expertise and market understanding
Primary research involves email interactions and telephone interviews for each market, category, segment, and sub-segment across geographies. The participants who typically take part in such a process include, but are not limited to:
- Industry participants: VPs, business development managers, market intelligence managers and national sales managers
- Outside experts: Valuation experts, research analysts and key opinion leaders specializing in the electronics and semiconductor industry.
Below is the breakup of our primary respondents by company, designation, and region:
Once we receive the confirmation from primary research sources or primary respondents, we finalize the base year market estimation and forecast the data as per the macroeconomic and microeconomic factors assessed during data collection.
- Data Analysis:
Once data is validated through both secondary as well as primary respondents, we finalize the market estimations by hypothesis formulation and factor analysis at regional and country level.
- Macro-Economic Factor Analysis:
We analyse macroeconomic indicators such the gross domestic product (GDP), increase in the demand for goods and services across industries, technological advancement, regional economic growth, governmental policies, the influence of COVID-19, PEST analysis, and other aspects. This analysis aids in setting benchmarks for various nations/regions and approximating market splits. Additionally, the general trend of the aforementioned components aid in determining the market's development possibilities.
- Country Level Data:
Various factors that are especially aligned to the country are taken into account to determine the market size for a certain area and country, including the presence of vendors, such as headquarters and offices, the country's GDP, demand patterns, and industry growth. To comprehend the market dynamics for the nation, a number of growth variables, inhibitors, application areas, and current market trends are researched. The aforementioned elements aid in determining the country's overall market's growth potential.
- Company Profile:
The “Table of Contents” is formulated by listing and analyzing more than 25 - 30 companies operating in the market ecosystem across geographies. However, we profile only 10 companies as a standard practice in our syndicate reports. These 10 companies comprise leading, emerging, and regional players. Nonetheless, our analysis is not restricted to the 10 listed companies, we also analyze other companies present in the market to develop a holistic view and understand the prevailing trends. The “Company Profiles” section in the report covers key facts, business description, products & services, financial information, SWOT analysis, and key developments. The financial information presented is extracted from the annual reports and official documents of the publicly listed companies. Upon collecting the information for the sections of respective companies, we verify them via various primary sources and then compile the data in respective company profiles. The company level information helps us in deriving the base number as well as in forecasting the market size.
- Developing Base Number:
Aggregation of sales statistics (2020-2022) and macro-economic factor, and other secondary and primary research insights are utilized to arrive at base number and related market shares for 2022. The data gaps are identified in this step and relevant market data is analyzed, collected from paid primary interviews or databases. On finalizing the base year market size, forecasts are developed on the basis of macro-economic, industry and market growth factors and company level analysis.
- Data Triangulation and Final Review:
The market findings and base year market size calculations are validated from supply as well as demand side. Demand side validations are based on macro-economic factor analysis and benchmarks for respective regions and countries. In case of supply side validations, revenues of major companies are estimated (in case not available) based on industry benchmark, approximate number of employees, product portfolio, and primary interviews revenues are gathered. Further revenue from target product/service segment is assessed to avoid overshooting of market statistics. In case of heavy deviations between supply and demand side values, all thes steps are repeated to achieve synchronization.
We follow an iterative model, wherein we share our research findings with Subject Matter Experts (SME’s) and Key Opinion Leaders (KOLs) until consensus view of the market is not formulated – this model negates any drastic deviation in the opinions of experts. Only validated and universally acceptable research findings are quoted in our reports.
We have important check points that we use to validate our research findings – which we call – data triangulation, where we validate the information, we generate from secondary sources with primary interviews and then we re-validate with our internal data bases and Subject matter experts. This comprehensive model enables us to deliver high quality, reliable data in shortest possible time.