
電子データ交換市場戦略、主要プレーヤー、成長機会、分析、2031年までの予測
電子データ交換市場の規模と予測(2021年 - 2031年)、世界および地域のシェア、傾向、成長機会分析レポートの対象範囲:コンポーネント(ソリューションとサービス)、タイプ(直接EDI、AS2経由EDI、VAN経由EDI、モバイルEDI、Web EDI、EDIアウトソーシング、その他)、業界(BFSI、小売および消費財、ヘルスケア、ITおよび通信、輸送および物流、その他)、および地理
- ステータス : 出版
- レポートコード : TIPRE00006160
- カテゴリー : テクノロジー、メディア、通信
- ページ数 : 256
- 利用可能なレポート形式 :


- 最終更新日 : June 13, 2025

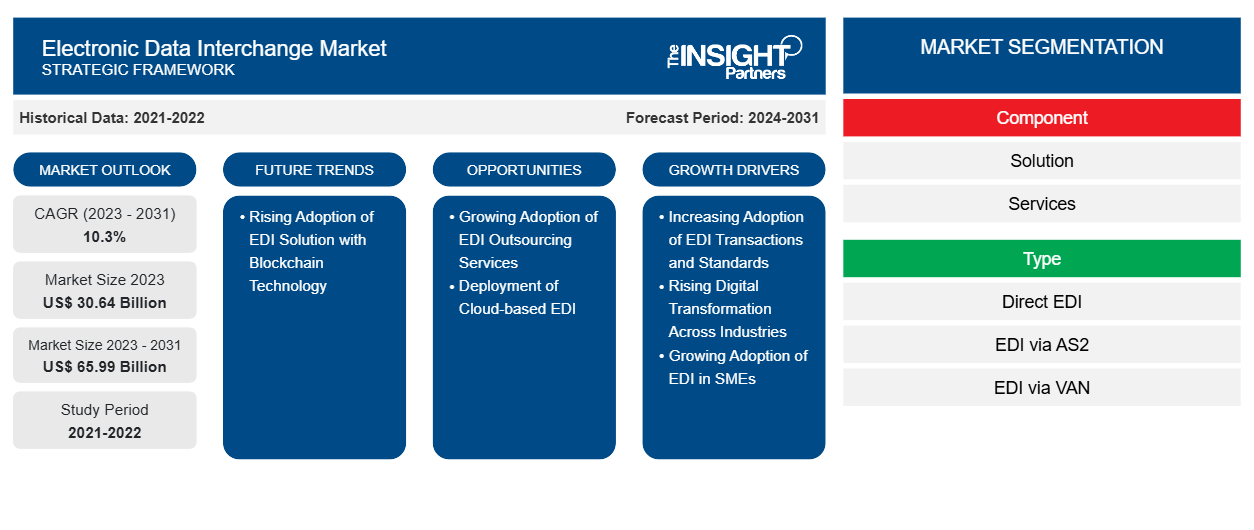
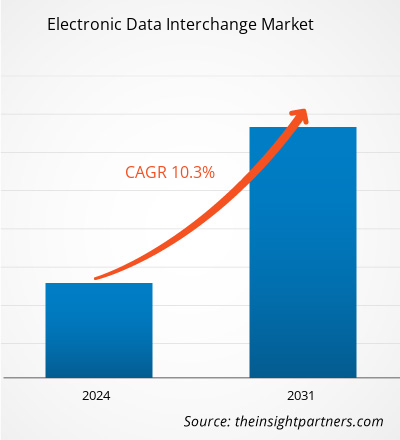
電子データ交換(EDI)市場規模は、2024年の340.2億米ドルから2031年には743.6億米ドルに達すると予測されています。市場は2025年から2031年にかけて年平均成長率(CAGR)11.9%を記録すると予想されています。今後数年間、電子データ交換(EDI)ソリューションとブロックチェーン技術の統合は、市場に新たなトレンドをもたらす可能性が高いでしょう。
電子データ交換市場分析
EDIソリューションは、組織のビジネスワークフロー全体を支えるため、継続的なメンテナンスが必要です。多くの組織は、EDIが数多くのコンプライアンスや標準に準拠していると考えています。そのため、中小企業が大規模組織と取引する際に、最新の文書標準を導入することが困難になっています。多くの組織は、顧客と直接EDI文書をやり取りするか、サードパーティのサービスプロバイダーを利用しています。効率的な処理のためにビジネス文書をデジタル化する傾向が高まるにつれ、様々なコンプライアンスが実装され、世界中で紙ベースの請求書から電子請求書への移行が促進されています。
BFSI、小売、製造業におけるデータ取引トレンドへのデジタルトランスフォーメーションの進展とEDIソリューションの普及、EDI関連のコンプライアンス要件の厳格化、そしてEDIソリューションの導入促進に向けた政府の積極的な取り組みは、世界中でEDIソリューションの需要を牽引する重要な要因です。しかしながら、EDIのデメリットは、導入コストの高さとソリューション導入に時間がかかることです。こうした制約があるにもかかわらず、EDI取引および標準規格の導入拡大、そして業界をまたいだデジタルトランスフォーメーションの進展は、予測期間中の市場成長を牽引すると予想されます。
電子データ交換市場の概要
EDIは、企業が請求書、注文書、出荷前通知、通関書類、支払書類、在庫書類、船荷証券、出荷状況書類などの文書を電子的に交換するための自動化プロセスです。EDIにより、組織はサプライチェーンアプリケーション間のデータ交換を統制できます。また、ビジネスクリティカルなデータが時間どおりに送信されることも保証されます。EDIは、従来の郵便物の準備と処理を伴うビジネスコミュニケーションに取って代わりました。EDIソリューションは、組織全体のワークフローパフォーマンスを向上させることを可能にします。EDI文書の迅速かつ正確な処理は、重複作業の削減、注文のキャンセルや在庫切れの減少につながります。
このレポートの一部、国レベルの分析、Excelデータパックなど、あらゆるレポートを無料でカスタマイズできます。また、スタートアップや大学向けのお得なオファーや割引もご利用いただけます。
電子データ交換市場:戦略的洞察
-
このレポートの主要な市場動向を入手してください。この無料サンプルには、市場動向から見積もりや予測に至るまでのデータ分析が含まれます。
電子データ交換市場の推進要因と機会
中小企業におけるEDI導入の拡大
EDIは中小企業で広く利用されています。中小企業はリソースや人的資本が少ないため、EDIは従来の方法に頼るのではなく、プロセスの自動化を支援します。EDIは、電子交換プロセス全体において、世界および地域のEDIルールと標準に従って、さまざまな文書やデータを共有できるようにします。これには、送信、メッセージフロー、文書形式、中小企業における文書の送受信に使用されるソフトウェアが含まれます。世界中の中小企業の成長に伴い、自動化された取引の数が増加し、中小企業におけるEDIソリューションの需要が高まっています。例えば、欧州委員会(EU)の2024年7月のデータによると、ヨーロッパでは中小企業の数が5.4%増加し、雇用率が4.8%増加しました。この地域の中小企業の総成長率は、2021年から2023年の間に4.5%に達しました。この成長により事業活動の数が増加し、業務の合理化、運用効率の向上、IT経費の削減を目的としたEDIソリューションの需要が急増しています。 EDIソリューションを活用することで、中小企業は発注書や請求書などの重要な文書を電子的にシームレスに交換することができ、手作業や書類処理を回避できます。これにより、注文処理の迅速化、ミスの削減、在庫管理の改善が実現し、ビジネス全体のパフォーマンスが向上します。
さらに、デジタル化の進展と自動化ソリューションの需要の高まりにより、中小企業はクラウドベースのソリューションを採用するようになっています。クラウドベースのソリューションは、検証、データ マッピング、フォーマット変換、ワークフローの合理化、手動データ入力の削減など、EDI プロセスの多くの側面を自動化します。 2024 年に実施された Public First の調査によると、調査対象となったクラウド サービスを使用している中小企業の 85% が、クラウド サービスの使用により大企業との競争が容易になったことに同意しています。 EDI ソリューションの採用が拡大すると、EDI プロバイダーの収益が増加する可能性があります。その結果、プロバイダーは、EDI ソリューションをより手頃な価格で利用しやすくし、ビジネスを拡大できるようにしています。さらに、中小企業が EDI に投資することで、より大規模な組織と取引すると同時に、より多くのビジネス トランザクションを処理できるようになります。全体として、EDI は中小企業の運営効率を高め、より多くのトランザクションを処理し、大規模な組織とビジネスを行うことを可能にします。このように、中小企業における EDI の採用拡大は、電子データ交換市場の成長を後押ししています。
EDIアウトソーシングサービスの需要増加
EDIプログラムのアウトソーシングは、サードパーティプロバイダーのEDIプラットフォームの管理と実装を行うマネージドサービスを通じて行われます。アウトソーシングベンダーは通常、クラウドベースのソリューションまたはサービスを提供し、企業が発注書、請求書、出荷通知などの文書を安全に交換することをサポートします。アウトソーシングには、組織が幅広い機能にアクセスし、ハードウェアとソフトウェアに投資する必要があります。多くの企業は、社内リソースの需要を満たすのに役立つERPシステムを含む、バックオフィスシステムとEDIの統合に積極的に取り組んでいます。さらに、EDIに対するマネージドサービスのアプローチの採用は、次のような大きなメリットから、組織の間で人気が高まっています。
- クラウドベースのマネージドEDIアウトソーシングサービスは、企業が取引先と連携してデータフローを検証し、エンドツーエンドのEDIテストを実施できるようサポートします。
- 取引先の要件の変更に応じて自動内部更新を提供します
- EDIトランザクションとメンテナンスイニシアチブの内部監視と最適化をサポートします
- 取引先、システム、販売チャネル、EDI サービスの専門家による 24 時間 365 日のサポート
- データ入力を最小限に抑え、エラーを防ぐために継続的な監視を提供します
EDIアウトソーシングの実装は、IT業界の他の分野のアウトソーシングよりも魅力的です。EDIアウトソーシングは、インフラストラクチャコストの削減、正確でタイムリーなデータ交換の保証、取引先の要件変更への迅速な適応の促進、顧客へのサービス提供のための適切なスキルへのアクセスの確保を目的としています。EDIアウトソーシングの実装には、最新技術へのアクセス、外部システムとの接続、ユーザーが世界中で取引できるようにする付加価値サービスへのアクセスなど、さまざまな利点があります。EDIは、パフォーマンス、サプライチェーン、ビジネスパートナーに関する高度な情報を提供することで、ユーザーが新しい市場に迅速に参入し、ビジネスの生産性を向上させることを可能にすることで、ビジネスの俊敏性を高めます。したがって、EDIアウトソーシングサービスの需要の増加は、予測期間中に電子データ交換市場の成長の機会を生み出すと予想されます。
電子データ交換市場レポートのセグメンテーション分析
電子データ交換市場分析の導出に貢献した主要なセグメントは、コンポーネント、タイプ、および業界です。
- 市場はコンポーネントに基づいてソリューションとサービスに分かれており、2024年にはソリューションセグメントが市場を支配しました。
- 種類別に見ると、市場はダイレクトEDI、AS2経由EDI、VAN経由EDI、モバイルEDI、Web EDI、EDIアウトソーシング、その他に分類されます。2024年には、VAN経由EDIセグメントが市場を席巻しました。
- 電子データ交換市場は、業種別に見ると、BFSI、ヘルスケア、小売・消費財、IT・通信、運輸・物流、自動車、食品・飲料、その他に分類されます。2024年には、小売・消費財セグメントが市場を牽引しました。
電子データ交換市場シェアの地域別分析
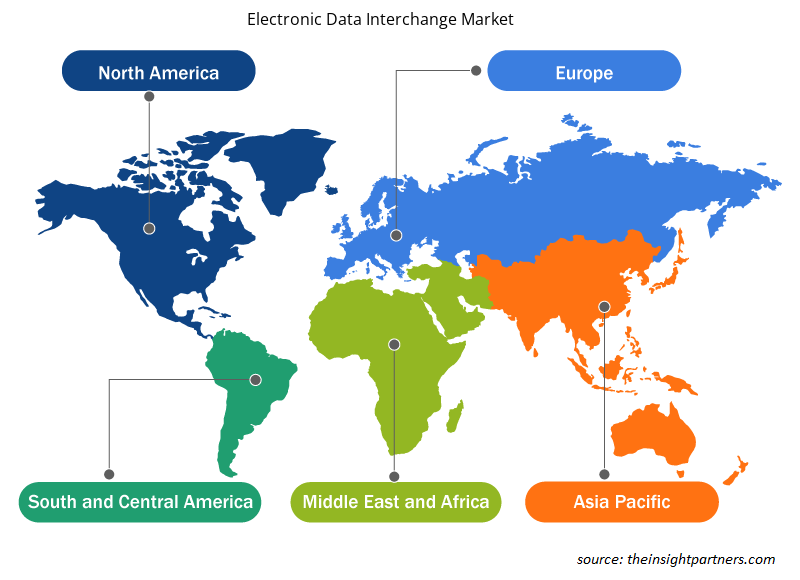
電子データ交換市場は、北米、ヨーロッパ、アジア太平洋、中東およびアフリカ(MEA)、南米の5つの主要地域に分類されています。2024年には北米が市場を支配しました。
北米には、堅牢な技術開発に多額の投資を行う巨大テクノロジー企業が数多く存在します。B2CおよびB2Bにおけるデータ取引の継続的な増加に伴い、多くの組織とそのパートナーが将来的に事業成長を報告すると予測されています。多くの企業は、データを正確、効率的、かつ安全に交換するためのEDIソリューションに関心を示しています。米国には、自動化されたEDIソリューションを提供するサービスプロバイダーが複数存在します。EDIソリューションの導入により、米国政府内の様々な組織で効率性が向上し、コスト削減が実現しています。さらに、新興技術の台頭や組織によるクラウドシステムへの投資により、この地域におけるEDI導入は徐々に増加しています。
電子データ交換市場の地域別分析
Insight Partnersのアナリストは、予測期間を通じて電子データ交換市場に影響を与える地域的な傾向と要因を詳細に解説しています。このセクションでは、北米、ヨーロッパ、アジア太平洋、中東・アフリカ、中南米における電子データ交換市場のセグメントと地域についても解説します。
- 電子データ交換市場の地域別データを入手
電子データ交換市場レポートの範囲
| レポート属性 | 詳細 |
|---|---|
| 2024年の市場規模 | 340.2億米ドル |
| 2031年までの市場規模 | 743.6億米ドル |
| 世界のCAGR(2025年~2031年) | 11.9% |
| 履歴データ | 2021-2023 |
| 予測期間 | 2025~2031年 |
| 対象セグメント |
コンポーネント別
|
| 対象地域と国 |
北米
|
| 市場リーダーと主要企業の概要 |
|
電子データ交換市場のプレーヤー密度:ビジネスダイナミクスへの影響を理解する
電子データ交換市場は、消費者の嗜好の変化、技術の進歩、製品メリットへの認知度の向上といった要因によるエンドユーザー需要の高まりに牽引され、急速に成長しています。需要が高まるにつれ、企業は提供内容を拡大し、消費者ニーズを満たすための革新を進め、新たなトレンドを捉えることで、市場の成長をさらに加速させています。
市場プレーヤー密度とは、特定の市場または業界内で事業を展開する企業または会社の分布を指します。これは、特定の市場空間における競合企業(市場プレーヤー)の数が、その市場規模または市場価値全体と比較してどれだけ多いかを示します。
電子データ交換市場で事業を展開している主要企業は次のとおりです。
- セールスフォース株式会社(MuleSoft)
- SPSコマース株式会社
- トゥルーコマース株式会社
- IBMコーポレーション
- クレオ
- ジェネリックスグループ
免責事項:上記の企業は、特定の順序でランク付けされているわけではありません。
- 電子データ交換市場のトップキープレーヤーの概要を入手
電子データ交換市場のニュースと最近の動向
電子データ交換市場は、主要な企業出版物、協会データ、データベースなどを含む一次調査および二次調査に基づく定性・定量データの収集によって評価されます。電子データ交換市場における動向のいくつかを以下に示します。
- Cleoは、製造、運輸、保険、小売など幅広い分野の企業向けにAI活用およびテクノロジーソリューションを提供するリーディングサービスプロバイダーであるProgrammers.ioとの提携を発表しました。この戦略的提携は、Cleo Integration Cloud(CIC)の強みとProgrammers.ioの深い技術的専門知識を融合させ、顧客の需要の拡大に合わせてビジネスオペレーションをシームレスに拡張できる、カスタマイズされたEDIおよびAPI統合を提供します。
(出典:リバティ・ミューチュアル・インシュアランス、プレスリリース、2025年3月)
- AWS B2B Data Interchange は、生成AIを用いて電子データ交換(EDI)マッピングコードを生成できます。この新機能により、双方向EDIマッピングの作成とテストのプロセスが迅速化され、EDIワークロードのAWSへの移行に伴う時間、労力、コストを削減できます。AWS B2B Data Interchange は、ビジネスクリティカルなEDIトランザクションの大規模な変換を、柔軟性と従量課金制で自動化するフルマネージドサービスです。
(出典:リバティ・ミューチュアル・シュアティ、プレスリリース、2024年11月)
電子データ交換市場レポートの対象範囲と成果物
「電子データ交換市場の規模と予測(2021〜2031年)」では、以下の分野を網羅した市場の詳細な分析を提供しています。
- 電子データ交換市場の規模と予測(対象範囲に含まれるすべての主要市場セグメントの世界、地域、国レベル)
- 電子データ交換市場の動向、および推進要因、制約、主要な機会などの市場動向
- 詳細なPEST分析とSWOT分析
- 主要な市場動向、世界および地域の枠組み、主要プレーヤー、規制、最近の市場動向を網羅した電子データ交換市場分析
- 市場集中、ヒートマップ分析、主要プレーヤー、電子データ交換市場の最近の動向を網羅した業界の展望と競争分析
- 詳細な企業プロフィール

アンキタは、テクノロジー、メディア、ICT、エレクトロニクス・半導体の各分野で8年以上の経験を持つ、ダイナミックな市場調査およびコンサルティングのプロフェッショナルです。Microsoft、Oracle、NEC、SAP、KPMG、Expeditors Internationalといったグローバルクライアントに対し、100件以上のコンサルティングおよび調査案件を主導・遂行してきました。彼女のコアコンピテンシーは、市場評価、データ分析、予測、戦略策定、競合情報、レポート作成です。
アンキタは、販売前の提案書作成やクライアントとの協議から、販売後の実用的なインサイトの提供まで、プロジェクトサイクル全体を巧みに管理することに長けています。彼女は、部門横断的なチームの管理、複雑な調査モジュールの構築、そしてクライアント固有のビジネス目標に合わせたソリューションの調整に長けています。優れたコミュニケーション能力、リーダーシップ、そしてプレゼンテーション能力により、急速に変化する市場環境において、常に価値主導の成果を生み出しています。
- 包括的な市場規模および予測分析
- 詳細なセグメンテーション分析
- 市場動向(ダイナミクス)の徹底的な評価
- 地域および国別のインサイト
- 競争環境および企業ベンチマーク
- 戦略的ビジネスインテリジェンス
お客様の声
Insight PartnersのSCADAシステム市場レポートは包括的で、現在のトレンドと将来の予測に関する貴重な洞察が含まれています。チームは終始、非常にプロフェッショナルで、対応が早く、サポートも充実していました。私たちは彼らのサービスに非常に満足しており、強くお勧めします。
ラン・ケデム パートナー, レアリテクノロジーズ株式会社非常に特殊なソフトウェア市場に関するレポートを依頼したところ、チームは数日でレポートを作成してくれました。情報は非常に関連性が高く、分かりやすくまとめられていました。その後、レポートにいくつか修正と追加を依頼しましたが、チームは非常に迅速に対応し、1週間も経たないうちに最終レポートを受け取ることができました。
ジャン=エルヴェ・ジェン 会長, フューチャー・アナリティカ重要な市場調査と予測のために、The Insight Partnersと協力しました。彼らは機会とリスクに関する明確な洞察を提供し、私たちの計画策定に役立ちました。彼らの調査は使いやすく、確かなデータに基づいており、賢明で自信に満ちた意思決定に役立ちました。彼らを強くお勧めします。
ピユーシュ・ナグパル 上級副社長, ハイビームグローバルInsight Partnersは、深い専門知識に基づき、洞察力に富み、構造化された市場調査を提供しました。チームは終始プロフェッショナルで、対応力も抜群でした。ユーザーフレンドリーなウェブサイトにより、業界レポートへのアクセスもスムーズでした。信頼性の高い高品質な調査サービスをお探しなら、Insight Partnersを強くお勧めします。
安達幸彦 最高経営責任者(CEO), ディープブルーLLC。The Insight Partnersから市場レポートを購入するのは今回が初めてです。最初は不安でしたが、ウェブサイトを見て、リスクを負ってでも購入してみようという気持ちになりました。レポートの品質とカスタマーサービスには大変満足しています。最初のレポートにはいくつか質問やコメントがありましたが、アナリストとメールで何度かやり取りした結果、戦略策定プロセスへのインプットとして活用できるレポートが完成しました。貴重なお時間を割いていただき、貴重な体験をさせていただき、誠にありがとうございました。他の方にもぜひお勧めしたいですし、今後さらに市場データが必要になった際には、まずThe Insight Partnersにご連絡させていただきます。
ジョン・スズキ 社長兼最高経営責任者、取締役, BKテクノロジーズナイジェリアの感染症IVD市場に関する情報提供依頼に対し、ご対応いただいた際、ご尽力とプロフェッショナルな姿勢に深く感謝申し上げます。忍耐強く、的確なアドバイスをいただき、また、最終的に取引成立に至った割引のご提供にも深く感謝申し上げます。今回の最初の出会いで得た強い印象のおかげで、今後もThe Insight Partnersとの連携を心待ちにしております。
チジオケ博士 オニア マネージングディレクター, パインクレストヘルスケア株式会社購入理由
- 情報に基づいた意思決定
- 市場動向の理解
- 競合分析
- 顧客インサイト
- 市場予測
- リスク軽減
- 戦略計画
- 投資の正当性
- 新興市場の特定
- マーケティング戦略の強化
- 業務効率の向上
- 規制動向への対応


