高速ケーブル市場の成長、規模、シェア、トレンド、主要プレーヤーの分析、2031年までの予測
過去データ : 2021-2023 | 基準年 : 2024 | 予測期間 : 2025-2031高速ケーブル市場の規模と予測(2021年 - 2031年)、世界および地域のシェア、トレンド、成長機会分析レポートの対象範囲:タイプ別(ダイレクトアタッチ銅線(DAC)ケーブル、アクティブ光ケーブル(AOC)、アクティブ銅線ケーブル(ACC)、PCIeケーブル、アクティブ電気ケーブル(AEC)、SASケーブル)、アプリケーション別(スイッチ間相互接続、スイッチとサーバー、サーバーとストレージ間の相互接続)、および地域別
- ステータス : 出版
- レポートコード : TIPRE00025895
- カテゴリー : エレクトロニクスおよび半導体
- ページ数 : 187
- 利用可能なレポート形式 :


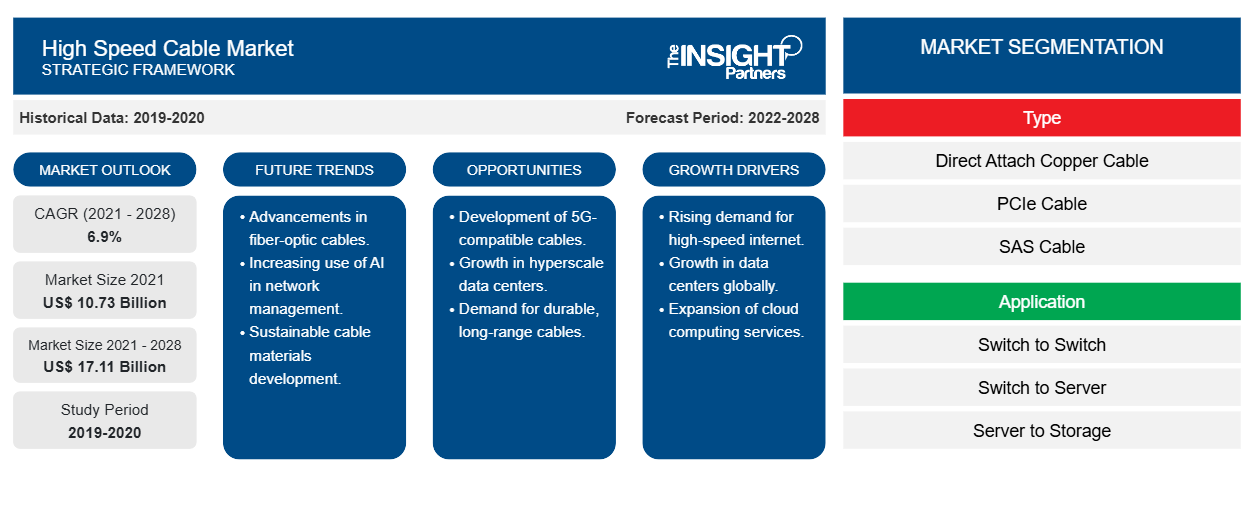
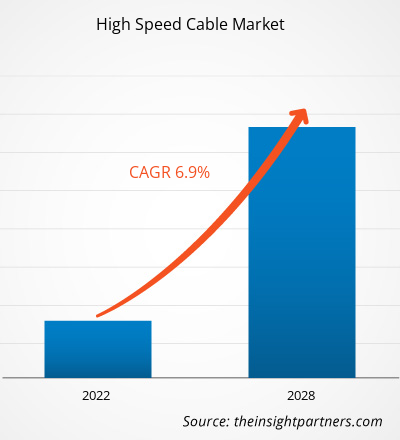
高速ケーブル市場規模は、2024年の129億米ドルから2031年には249億9000万米ドルに達すると予測されています。市場は2025年から2031年にかけて年平均成長率(CAGR)10.2%を記録すると予想されています。スマートシティの台頭は、今後数年間で市場に新たなトレンドをもたらす可能性が高いでしょう。
高速ケーブル市場分析
クラウドサービスがかつてないペースで拡大するにつれ、高性能で費用対効果の高いデータセンター相互接続の需要が急速に高まっています。これにより、高速ケーブルの採用が拡大しています。信号変換に光モジュールに依存する光相互接続とは異なり、ダイレクトアタッチカッパー(DAC)やアクティブ光ケーブル(AOC)などの高速ケーブルは、ツインアクシャルケーブルを使用して2つのポート間を直接物理層接続します。これにより、アクティブな光部品を必要とせずに、指定された距離にわたって信号の整合性が確保されます。エレクトロニクス、自動車、通信、ネットワークなどの業界は進化しており、より高速なデータ転送をサポートする革新を導入しています。その結果、効率的な接続に対するニーズの高まりが高速ケーブル市場の成長を促進しています。自動車分野では、メーカーが接続性を強化するために電子システムとインフォテインメントシステムを車両に統合するケースが増えており、この需要がさらに高まっています。
高速ケーブル市場の概要
データセンターでは、ラック内およびラック間の効率的な接続が求められており、高速ケーブルはまさにこの目的に最適です。高速接続を実現すると同時に、消費電力は0.1W未満で、処理中の発熱も最小限に抑えられます。このエネルギー効率の高さは、データセンターの空調システムの冷却負荷を軽減するのに役立ちます。さらに、高速ケーブルは優れた耐久性を備えているため、曲げや物理的なストレスによる損傷を受けにくくなっています。この堅牢性により、高密度環境における障害リスクが最小限に抑えられ、データセンター運用に大きなメリットをもたらします。
このレポートの一部、国レベルの分析、Excelデータパックなど、あらゆるレポートを無料でカスタマイズできます。また、スタートアップや大学向けのお得なオファーや割引もご利用いただけます。
高速ケーブル市場:戦略的洞察
-
このレポートの主要な市場動向を入手してください。この無料サンプルには、市場動向から見積もりや予測に至るまでのデータ分析が含まれます。
高速ケーブル市場の推進要因と機会
5Gネットワークサービスの発展
パッシブDACは、基本的に電子機器が組み込まれていない高品質の銅線であり、これらのコンポーネントのおかげでケーブルよりも安価です。AECSの高度なチップセットとAOCSのVCSELレーザーはプレミアムを追加し、コストが少なくとも2〜5倍増加する可能性があります。 DACは、O-RANセルサイトやエッジデータセンターなど、同じエリアで発生する短距離接続の5Gネットワークで頻繁に使用されます。これらのケーブルは、低遅延および低消費電力で高速データ転送をサポートします。たとえば、パッシブQSFP28 DACは100Gb/sをサポートできるため、キャビネット内の直接接続に適していますが、SFP28 DACは25Gb/sをサポートできます。 5Gネットワークの高密度セルと高トラフィックには、数百ギガビットを処理できるバックホール接続が必要です。これには、400G以上などのより高速なイーサネット接続が必要です。 DACは、短距離における高速イーサネット接続を容易にし、ネットワークデバイス間の効率的なデータ転送を保証するために不可欠です。パッシブDACはポートあたりの消費電力が最も低く、独立したトランシーバーを備えた光ファイバーケーブルと比較して、ポートあたりの消費電力を91%~97%削減します。短距離のサーバーネットワークアクセス接続は急速に増加します。
データセンターの導入拡大
インターネット消費の増加と高度なソフトウェアソリューションの開発により、世界中で生成されるデータ量は急増しています。膨大な量のデータの処理と保存の必要性から、組織は高度な処理およびストレージソリューションの導入を迫られ、データセンターの導入が促進されています。デジタル化の進展に伴い、データセンターは現代の産業と経済において極めて重要な要素となっています。データセンターはクラウドコンピューティングにおいて重要な役割を果たしています。コストと運用上の利点から、業界はクラウド技術の導入へと進んでおり、中小企業はこの技術導入の最前線に立っています。さらに、複雑なクラウドコンピューティング運用は、大手テクノロジー企業や研究機関によって行われています。データセンターでは、アクティブ光ケーブル、ダイレクトアタッチ銅線ケーブル、光ファイバーケーブルなどが広く使用されている高速ケーブルです。
高速ケーブル市場レポートのセグメンテーション分析
高速ケーブル市場分析の導出に貢献した主要なセグメントは、コンポーネント、エンド ユーザー、および接続性です。
- 種類別に見ると、市場はダイレクトアタッチ銅線(DAC)ケーブル、アクティブ光ケーブル(AOC)、アクティブ銅線ケーブル(ACC)、PCIeケーブル、アクティブ電気ケーブル(AEC)、SASケーブルに分類されます。2024年には、アクティブ光ケーブル(AOC)セグメントが最大の市場シェアを占めました。
- アプリケーションに基づいて、市場はスイッチ間相互接続、スイッチとサーバー、サーバーとストレージ間の相互接続に分類されます。スイッチ間相互接続セグメントは、2024年に最大の市場シェアを占めました。
高速ケーブル市場シェアの地域別分析
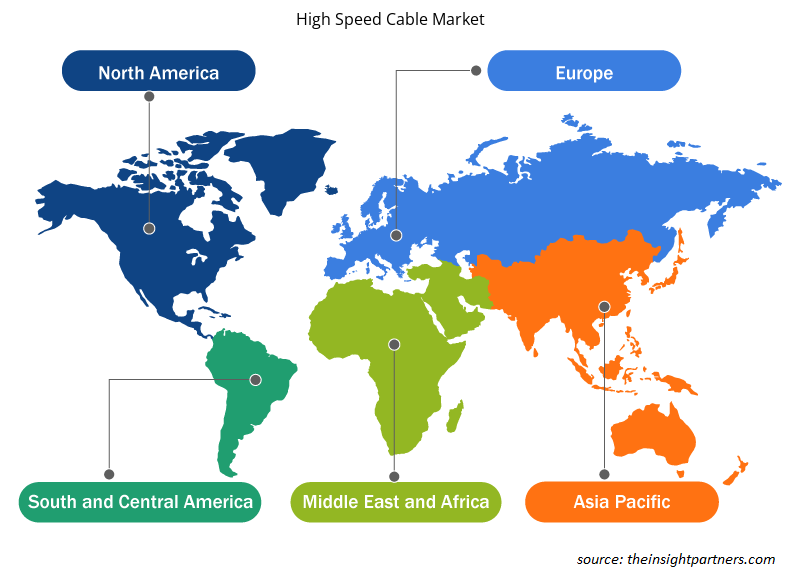
高速ケーブル市場レポートの地理的範囲は、北米、アジア太平洋、ヨーロッパ、中東およびアフリカ、南米および中米の 5 つの地域に分かれています。
アジア太平洋地域は2024年に大きな市場シェアを獲得しました。急速な都市化、インターネット利用者の急増、そして中国、日本、韓国、インドといった国々における技術革新により、アジア太平洋地域は高速ケーブル需要が最も急速に伸びている地域です。5Gネットワークの拡大、大規模データセンターの建設、そして活況を呈するEV市場は、通信、運輸、エネルギー分野全体にわたって高速ケーブル導入の大きな機会を生み出しています。
アジア太平洋地域の自動車産業は、高速ケーブル需要の増加に大きく貢献しています。中国、日本、韓国などの国々では、電気自動車(EV)の普及に伴い、自動車メーカーは画像データ、多機能ディスプレイ、後部座席の乗員用インフォテインメントシステムなどの伝送用として高速ケーブルを必要としています。世界最大のEV市場である中国は、電動モビリティに関して野心的な目標を掲げており、高性能部品の需要を牽引しています。国際エネルギー機関(IEA)によると、中国における電気自動車(EV)の普及は著しく、2023年には新規登録台数が2022年から35%増の810万台に達すると予測されており、自動車産業における高速ケーブル需要の増加を浮き彫りにしています。EV生産の急増は、特にアジア太平洋地域における高速ケーブルの増加と密接に関連しています。自動車用途における高速ケーブルは、先進運転支援システム(ADAS)、インフォテインメントシステム、カメラシステムなどの機能における高速データ伝送を可能にします。また、車両間 (V2V) 通信や車両インフラ間 (V2X) 通信も可能になります。
高速ケーブル市場の地域別分析
Insight Partnersのアナリストは、予測期間を通じて高速ケーブル市場に影響を与える地域的な動向と要因を詳細に解説しています。このセクションでは、北米、ヨーロッパ、アジア太平洋、中東・アフリカ、中南米における高速ケーブル市場のセグメントと地域についても解説します。
- 高速ケーブル市場の地域別データを入手
高速ケーブル市場レポートの範囲
| レポート属性 | 詳細 |
|---|---|
| 2024年の市場規模 | 129億米ドル |
| 2031年までの市場規模 | 249億9000万米ドル |
| 世界のCAGR(2025年~2031年) | 10.2% |
| 履歴データ | 2021-2023 |
| 予測期間 | 2025~2031年 |
| 対象セグメント |
タイプ別
|
| 対象地域と国 |
北米
|
| 市場リーダーと主要企業の概要 |
|
高速ケーブル市場のプレーヤー密度:ビジネスダイナミクスへの影響を理解する
高速ケーブル市場は、消費者の嗜好の変化、技術の進歩、製品メリットへの認知度の高まりといった要因によるエンドユーザー需要の増加に牽引され、急速に成長しています。需要の増加に伴い、企業は製品ラインナップの拡充、消費者ニーズへの対応のための革新、そして新たなトレンドの活用を進めており、これが市場の成長をさらに加速させています。
市場プレーヤー密度とは、特定の市場または業界内で事業を展開する企業または会社の分布を指します。これは、特定の市場空間における競合企業(市場プレーヤー)の数が、その市場規模または市場価値全体と比較してどれだけ多いかを示します。
高速ケーブル市場で事業を展開している主要企業は次のとおりです。
- アンフェノールコーポレーション
- アクソンケーブルSAS
- モレックスLLC
- ボレックスPLC
- NVIDIAコーポレーション
- サムテック株式会社
免責事項:上記の企業は、特定の順序でランク付けされているわけではありません。
- 高速ケーブル市場のトップキープレーヤーの概要を入手
高速ケーブル市場のニュースと最近の動向
高速ケーブル市場は、主要な企業出版物、協会データ、データベースなどを含む一次調査および二次調査を経て、定性・定量データを収集することで評価されます。高速ケーブル市場におけるいくつかの動向を以下に示します。
- 高性能相互接続ソリューションの世界的リーダーであるAmphenol Communications Services(ACS)と、高性能半導体、モノのインターネット(IoT)システム、クラウド接続サービスソリューションの大手プロバイダーであるSemtech Corporation(Nasdaq: SMTC)は、次世代AI/MLおよびデータセンターインフラストラクチャでの使用を目的とした、SemtechのCopperEdge 224G/レーンリニアイコライザー/リドライバーICを搭載した最先端の1.6T OSFPアクティブ銅ケーブル(ACC)製品を発表しました。(出典:Amphenol Communications、プレスリリース、2025年4月)
- Samtecは、新製品、新技術、ロードマップ項目を網羅した高速ケーブル設計ガイドを発表しました。このガイドでは、Samtecの次世代アーキテクチャにおけるイノベーション(フライオーバー、HDR、光学、RFソリューション)と、業界をリードするサポート、社内製造、カスタマイズ能力を組み合わせ、あらゆるアプリケーションに対応するソリューションを実現しています。(出典:Samtec、プレスリリース、2023年6月)
高速ケーブル市場レポートの対象範囲と成果物
「高速ケーブル市場の規模と予測(2021〜2031年)」レポートでは、以下の分野を網羅した市場の詳細な分析を提供しています。
- 高速ケーブル市場の規模と予測は、スコープに含まれるすべての主要な市場セグメントについて、世界、地域、国レベルで行われます。
- 高速ケーブル市場の動向、および推進要因、制約、主要な機会などの市場動向
- 詳細なPEST分析とSWOT分析
- 主要な市場動向、世界および地域の枠組み、主要プレーヤー、規制、最近の市場動向を網羅した高速ケーブル市場分析
- 高速ケーブル市場の市場集中、ヒートマップ分析、主要プレーヤー、最近の動向を網羅した業界の展望と競争分析
- 詳細な企業プロフィール

Naveenは、カスタム、シンジケート、コンサルティングの各プロジェクトにおいて9年以上の実績を持つ、経験豊富な市場調査およびコンサルティングのプロフェッショナルです。現在はアソシエイトバイスプレジデントを務め、プロジェクトバリューチェーン全体にわたるステークホルダー管理を成功させ、100件以上の調査レポートと30件以上のコンサルティング案件を執筆しています。産業および政府機関のプロジェクトに幅広く携わり、クライアントの成功とデータに基づく意思決定に大きく貢献しています。
Naveenは、カルナータカ州VTUで電子通信工学の学位を取得し、マニパル大学でマーケティング&オペレーションズのMBAを取得しています。IEEEの会員として9年間活動し、会議や技術シンポジウムへの参加、セクションレベルおよび地域レベルでのボランティア活動に積極的に取り組んでいます。現職以前は、IndustryARCでアソシエイト戦略コンサルタント、Hewlett Packard(HP Global)で産業用サーバーコンサルタントを務めていました。
- 過去2年間の分析、基準年、CAGRによる予測(7年間)
- PEST分析とSWOT分析
- 市場規模価値/数量 - 世界、地域、国
- 業界と競争環境
- Excel データセット
お客様の声
Insight PartnersのSCADAシステム市場レポートは包括的で、現在のトレンドと将来の予測に関する貴重な洞察が含まれています。チームは終始、非常にプロフェッショナルで、対応が早く、サポートも充実していました。私たちは彼らのサービスに非常に満足しており、強くお勧めします。
ラン・ケデム パートナー, レアリテクノロジーズ株式会社非常に特殊なソフトウェア市場に関するレポートを依頼したところ、チームは数日でレポートを作成してくれました。情報は非常に関連性が高く、分かりやすくまとめられていました。その後、レポートにいくつか修正と追加を依頼しましたが、チームは非常に迅速に対応し、1週間も経たないうちに最終レポートを受け取ることができました。
ジャン=エルヴェ・ジェン 会長, フューチャー・アナリティカ重要な市場調査と予測のために、The Insight Partnersと協力しました。彼らは機会とリスクに関する明確な洞察を提供し、私たちの計画策定に役立ちました。彼らの調査は使いやすく、確かなデータに基づいており、賢明で自信に満ちた意思決定に役立ちました。彼らを強くお勧めします。
ピユーシュ・ナグパル 上級副社長, ハイビームグローバルInsight Partnersは、深い専門知識に基づき、洞察力に富み、構造化された市場調査を提供しました。チームは終始プロフェッショナルで、対応力も抜群でした。ユーザーフレンドリーなウェブサイトにより、業界レポートへのアクセスもスムーズでした。信頼性の高い高品質な調査サービスをお探しなら、Insight Partnersを強くお勧めします。
安達幸彦 最高経営責任者(CEO), ディープブルーLLC。The Insight Partnersから市場レポートを購入するのは今回が初めてです。最初は不安でしたが、ウェブサイトを見て、リスクを負ってでも購入してみようという気持ちになりました。レポートの品質とカスタマーサービスには大変満足しています。最初のレポートにはいくつか質問やコメントがありましたが、アナリストとメールで何度かやり取りした結果、戦略策定プロセスへのインプットとして活用できるレポートが完成しました。貴重なお時間を割いていただき、貴重な体験をさせていただき、誠にありがとうございました。他の方にもぜひお勧めしたいですし、今後さらに市場データが必要になった際には、まずThe Insight Partnersにご連絡させていただきます。
ジョン・スズキ 社長兼最高経営責任者、取締役, BKテクノロジーズナイジェリアの感染症IVD市場に関する情報提供依頼に対し、ご対応いただいた際、ご尽力とプロフェッショナルな姿勢に深く感謝申し上げます。忍耐強く、的確なアドバイスをいただき、また、最終的に取引成立に至った割引のご提供にも深く感謝申し上げます。今回の最初の出会いで得た強い印象のおかげで、今後もThe Insight Partnersとの連携を心待ちにしております。
チジオケ博士 オニア マネージングディレクター, パインクレストヘルスケア株式会社購入理由
- 情報に基づいた意思決定
- 市場動向の理解
- 競合分析
- 顧客インサイト
- 市場予測
- リスク軽減
- 戦略計画
- 投資の正当性
- 新興市場の特定
- マーケティング戦略の強化
- 業務効率の向上
- 規制動向への対応


 無料サンプルを入手 - 高速ケーブル市場