イメージ増強管市場の分析と予測 - 規模、シェア、成長、トレンド 2031 年
過去データ : 2021-2022 | 基準年 : 2023 | 予測期間 : 2024-2031イメージインテンシファイアチューブ市場の規模と予測(2021年 - 2031年)、世界および地域のシェア、トレンド、成長機会分析レポートの対象範囲:世代別(第1世代、第2世代、第3世代)、エンドユーザー別(軍事、ヘルスケア、バイオテクノロジー、その他)、および地理別
- ステータス : 公開されたデータ
- レポートコード : TIPRE00010542
- カテゴリー : エレクトロニクスおよび半導体
- ページ数 : 150
- 利用可能なレポート形式 :


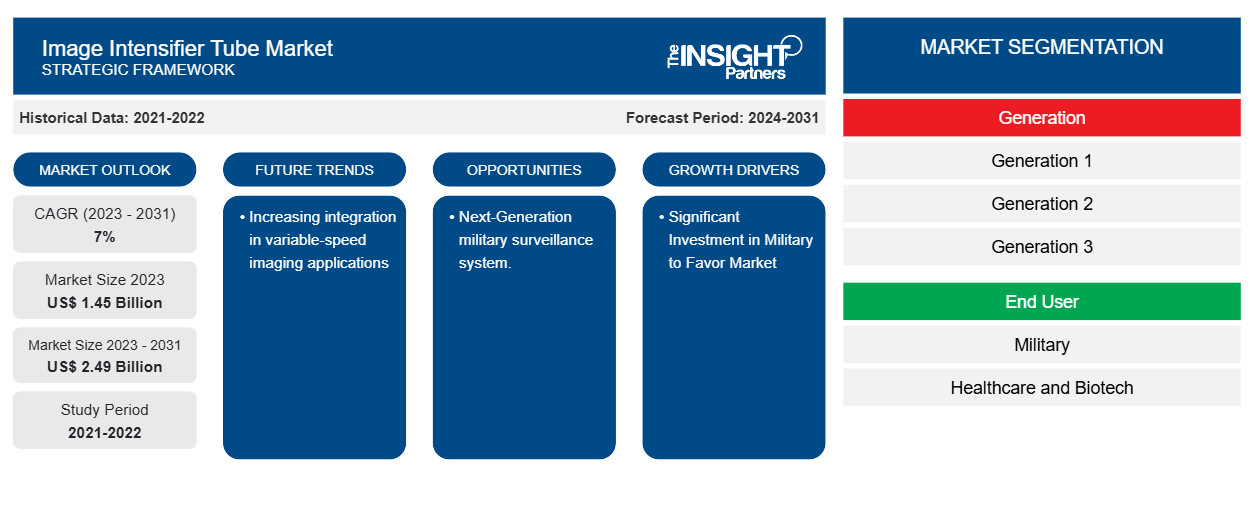
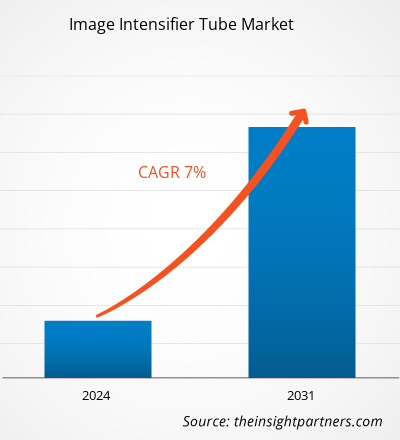
イメージ増強管市場規模は、2023年の14億5,000万米ドルから2031年には24億9,000万米ドルに達すると予測されています。市場は2023年から2031年の間に7.0%のCAGRを記録すると予想されています。暗視システムの調達と進歩に関する契約の増加と、X線装置の需要の増加は、引き続き市場の主要なトレンドとなると思われます。
イメージ増強管市場分析
イメージ増強管市場の需要は、あらゆる高速カメラ用の増強管アタッチメントであるHiCATTを含む高速カメラシステムの調達の増加に伴い、増加すると予想されます。このような機器は、移動中の画像をキャプチャするために使用されます。さらに、暗視システムの調達と進歩に関する契約の増加と、X 線機器の需要の高まりが、イメージ増強管市場の成長を牽引しています。
イメージ増強管市場の概要
イメージ増強管 ( IIT ) は、低光レベルの画像を観察可能なレベルまで増強する真空管です。イメージ増強管は、産業/防衛/セキュリティ/アプリケーションで重要な役割を果たす暗視装置の最も重要なモジュールの 1 つです。イメージ増強管の製造技術は難しく、現代のIITの性能パラメータは同じ技術プロセス内でも異なります。さらに、製造元によってテスト方法が異なるため、製造元が提供するテスト レポートを完全に信頼することはできません。さらに、文献にはさまざまな製造元からの矛盾した主張が記載されています。世界の市場では、データ シートの制約は同じでも画像の品質が異なる 2 つの暗視装置がよく見られます。上記のいくつかの理由により、イメージ増強管のテストは、管製造元、暗視装置 ( NVD ) の製造元、およびNVDの最終ユーザーのいずれにとっても非常に重要です。
要件に合わせてレポートをカスタマイズする
このレポートの一部、国レベルの分析、Excelデータパックなど、あらゆるレポートを無料でカスタマイズできます。また、スタートアップや大学向けのお得なオファーや割引もご利用いただけます。
イメージ増強管市場:戦略的洞察
-
このレポートの主要な市場動向を入手してください。この無料サンプルには、市場動向から見積もりや予測に至るまでのデータ分析が含まれます。
イメージ増強管市場の推進要因と機会
軍事への多額の投資が市場を有利にする
暗視は現代の戦争において非常に重要な光電子技術となり、夜間に行われる戦闘が増えています。Photonisの画像増強管は、世界有数の光学システム サプライヤーの機器に組み込まれています。さまざまな企業が軍事用の画像増強管を提供しています。たとえば、Photonics は軍事および防衛用の最先端の画像増強管の製造と設計の先駆者の 1 つです。Photonisは、兵士に夜間作戦での戦略的優位性を与えるために、幅広い暗視装置用の高品質の画像増強管を提供しています。
さらに、企業はいくつかのイニシアチブをとっています。たとえば、企業は大量のイメージ増強管を納入するなど、さまざまなイニシアチブをとっています。たとえば、2024年2月、Exosensのブランドであり、イメージ増強管の世界的リーダーの1つであるPhotonisは、ドイツ軍とベルギー軍に供給されるTheon SensorsのMikron暗視双眼鏡向けに40,000個の4G 16mmイメージ増強管を供給するために2度目に選ばれました。このように、軍事への多額の投資がイメージ増強管市場を牽引しています。
次世代の軍事監視システム。
陸軍は、巡航ミサイル、航空機、小型の無人飛行システムの識別に役立つ高さ 60 フィートのセンサーを迅速に展開できる戦術トラックに搭載された陸軍長距離持続監視システムの一種である次世代モバイルパッシブレーダーの要件を課しています。3 月 26 日、陸軍の防空砲および野戦砲センサーの開発と購入を担当する事務所は、新しいレーダーの競争に関心を持つ可能性のある企業からのフィードバックを求める通知を発表しました。さらに、主要な軍隊は、優れた画質、拡張された範囲、およびハロー効果の低減を提供する Gen 3 および Gen 4 NVD を装備しています。Gen 3 デバイスは、ガリウムヒ素光電陰極とマイクロチャネルプレート (MCP) 増幅を利用しています。したがって、次世代の軍事監視システムは、画像増強管市場で多くの機会を秘めています。
イメージ増強管市場レポートのセグメンテーション分析
イメージ増強管市場分析の導出に貢献した主要なセグメントは、世代とエンドユーザーです。
- 世代に基づいて、イメージ増強管市場は第 1 世代、第 2 世代、第 3 世代に分けられます。第 2 世代は 2023 年に大きな市場シェアを占めました。
- エンドユーザー別に見ると、市場は軍事、ヘルスケアバイオテクノロジー、その他に分類されます。軍事分野は2023年に市場で大きなシェアを占めました。
イメージ増強管市場シェアの地域別分析
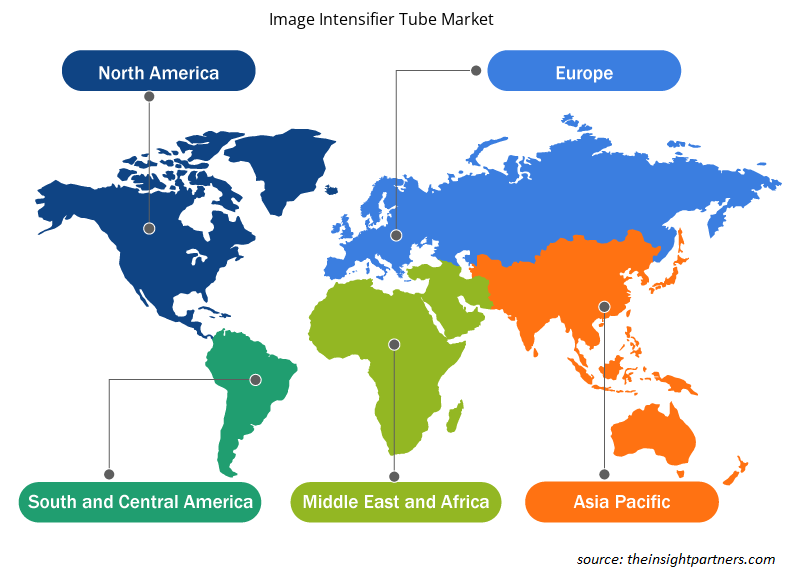
イメージ増強管市場レポートの地理的範囲は、主に北米、アジア太平洋、ヨーロッパ、中東およびアフリカ、南米および中米の 5 つの地域に分かれています。
北米は、イメージ増強管市場を独占しています。北米は、高度な技術の採用に関して最も先進的な地域の 1 つです。長年にわたり、北米では軍事力を強化するために、技術的に高度な軍事機器の採用が増加しています。米国、カナダ、メキシコなどの国の政府機関は、軍事費を増やしています。さらに、北米の国々では、医療インフラを強化するために、ヘルスケア分野への投資が増加しています。したがって、イメージ増強管が不可欠な分野への投資の増加が、市場の成長を牽引しています。
イメージ増強管市場の地域別分析
予測期間を通じてイメージ増強管市場に影響を与える地域的な傾向と要因は、Insight Partners のアナリストによって徹底的に説明されています。このセクションでは、北米、ヨーロッパ、アジア太平洋、中東およびアフリカ、南米および中米にわたるイメージ増強管市場のセグメントと地理についても説明します。
- イメージ増強管市場の地域別データを入手
イメージ増強管市場レポートの範囲
| レポート属性 | 詳細 |
|---|---|
| 2023年の市場規模 | 14億5千万米ドル |
| 2031年までの市場規模 | 24億9千万米ドル |
| 世界のCAGR(2023年~2031年) | 7% |
| 履歴データ | 2021-2022 |
| 予測期間 | 2024-2031 |
| 対象セグメント |
世代別
|
| 対象地域と国 |
北米
|
| 市場リーダーと主要企業プロフィール |
|
市場プレーヤーの密度:ビジネスダイナミクスへの影響を理解する
イメージ増強管市場は、消費者の嗜好の変化、技術の進歩、製品の利点に対する認識の高まりなどの要因により、エンドユーザーの需要が高まり、急速に成長しています。需要が高まるにつれて、企業は提供を拡大し、消費者のニーズを満たすために革新し、新たなトレンドを活用し、市場の成長をさらに促進しています。
市場プレーヤー密度とは、特定の市場または業界内で活動している企業または会社の分布を指します。これは、特定の市場スペースに、その市場規模または総市場価値に対してどれだけの競合相手 (市場プレーヤー) が存在するかを示します。
イメージ増強管市場で事業を展開している主要企業は次のとおりです。
- BELオプトロニックデバイスリミテッド(BELOP)
- HARDER.デジタル
- キヤノン電子管デバイス株式会社
- L3ハリステクノロジーズ株式会社
- ニューコンオプティック
- フォテック
免責事項:上記の企業は、特定の順序でランク付けされていません。
- イメージ増強管市場のトップキープレーヤーの概要を入手
イメージ増強管市場のニュースと最近の動向
イメージ増強管市場は、重要な企業出版物、協会データ、データベースを含む一次および二次調査後の定性的および定量的データを収集することによって評価されます。イメージ増強管市場の動向のいくつかを以下に示します。
- Exosens は、25 mm イメージ インテンシファイア ソリューションの導入により、Photonis Ultimate Detection Scientific Imaging 製品ポートフォリオの拡張を発表しました。医療および高速イメージング、マシン ビジョン、ロボット工学、研究など、さまざまな科学アプリケーションをサポートするように設計されたこの最新テクノロジは、SPIE Photonics West で展示されます。
(出典:Exosens、企業ウェブサイト、2024年1月)
- Exosens のブランドであり、イメージ増強管の世界的リーダーの 1 つである Photonis は、ドイツ軍とベルギー軍に供給される Theon Sensors の Mikron 暗視双眼鏡用の 4G 16mm イメージ増強管 40,000 個を供給する企業として、2 度目の選定を受けました。
(出典:Photonis社名、2024年2月)
イメージ増強管市場レポートの対象範囲と成果物
「イメージ増強管市場規模と予測(2021〜2031年)」レポートでは、以下の分野をカバーする市場の詳細な分析を提供しています。
- 対象範囲に含まれるすべての主要市場セグメントについて、世界、地域、国レベルでのイメージ増強管市場の規模と予測。
- イメージ増強管市場の動向、および推進要因、制約、主要な機会などの市場動向。
- 詳細な PEST/ポーターの 5 つの力と SWOT 分析。
- 主要な市場動向、世界および地域の枠組み、主要プレーヤー、規制、最近の市場動向を網羅したイメージ増強管市場分析。
- 市場集中、ヒートマップ分析、主要プレーヤー、およびイメージ増強管市場の最近の動向を網羅した業界の状況と競争分析。
- 詳細な企業プロフィール。

Naveenは、カスタム、シンジケート、コンサルティングの各プロジェクトにおいて9年以上の実績を持つ、経験豊富な市場調査およびコンサルティングのプロフェッショナルです。現在はアソシエイトバイスプレジデントを務め、プロジェクトバリューチェーン全体にわたるステークホルダー管理を成功させ、100件以上の調査レポートと30件以上のコンサルティング案件を執筆しています。産業および政府機関のプロジェクトに幅広く携わり、クライアントの成功とデータに基づく意思決定に大きく貢献しています。
Naveenは、カルナータカ州VTUで電子通信工学の学位を取得し、マニパル大学でマーケティング&オペレーションズのMBAを取得しています。IEEEの会員として9年間活動し、会議や技術シンポジウムへの参加、セクションレベルおよび地域レベルでのボランティア活動に積極的に取り組んでいます。現職以前は、IndustryARCでアソシエイト戦略コンサルタント、Hewlett Packard(HP Global)で産業用サーバーコンサルタントを務めていました。
- 過去2年間の分析、基準年、CAGRによる予測(7年間)
- PEST分析とSWOT分析
- 市場規模価値/数量 - 世界、地域、国
- 業界と競争環境
- Excel データセット
お客様の声
Insight PartnersのSCADAシステム市場レポートは包括的で、現在のトレンドと将来の予測に関する貴重な洞察が含まれています。チームは終始、非常にプロフェッショナルで、対応が早く、サポートも充実していました。私たちは彼らのサービスに非常に満足しており、強くお勧めします。
ラン・ケデム パートナー, レアリテクノロジーズ株式会社非常に特殊なソフトウェア市場に関するレポートを依頼したところ、チームは数日でレポートを作成してくれました。情報は非常に関連性が高く、分かりやすくまとめられていました。その後、レポートにいくつか修正と追加を依頼しましたが、チームは非常に迅速に対応し、1週間も経たないうちに最終レポートを受け取ることができました。
ジャン=エルヴェ・ジェン 会長, フューチャー・アナリティカ重要な市場調査と予測のために、The Insight Partnersと協力しました。彼らは機会とリスクに関する明確な洞察を提供し、私たちの計画策定に役立ちました。彼らの調査は使いやすく、確かなデータに基づいており、賢明で自信に満ちた意思決定に役立ちました。彼らを強くお勧めします。
ピユーシュ・ナグパル 上級副社長, ハイビームグローバルInsight Partnersは、深い専門知識に基づき、洞察力に富み、構造化された市場調査を提供しました。チームは終始プロフェッショナルで、対応力も抜群でした。ユーザーフレンドリーなウェブサイトにより、業界レポートへのアクセスもスムーズでした。信頼性の高い高品質な調査サービスをお探しなら、Insight Partnersを強くお勧めします。
安達幸彦 最高経営責任者(CEO), ディープブルーLLC。The Insight Partnersから市場レポートを購入するのは今回が初めてです。最初は不安でしたが、ウェブサイトを見て、リスクを負ってでも購入してみようという気持ちになりました。レポートの品質とカスタマーサービスには大変満足しています。最初のレポートにはいくつか質問やコメントがありましたが、アナリストとメールで何度かやり取りした結果、戦略策定プロセスへのインプットとして活用できるレポートが完成しました。貴重なお時間を割いていただき、貴重な体験をさせていただき、誠にありがとうございました。他の方にもぜひお勧めしたいですし、今後さらに市場データが必要になった際には、まずThe Insight Partnersにご連絡させていただきます。
ジョン・スズキ 社長兼最高経営責任者、取締役, BKテクノロジーズナイジェリアの感染症IVD市場に関する情報提供依頼に対し、ご対応いただいた際、ご尽力とプロフェッショナルな姿勢に深く感謝申し上げます。忍耐強く、的確なアドバイスをいただき、また、最終的に取引成立に至った割引のご提供にも深く感謝申し上げます。今回の最初の出会いで得た強い印象のおかげで、今後もThe Insight Partnersとの連携を心待ちにしております。
チジオケ博士 オニア マネージングディレクター, パインクレストヘルスケア株式会社購入理由
- 情報に基づいた意思決定
- 市場動向の理解
- 競合分析
- 顧客インサイト
- 市場予測
- リスク軽減
- 戦略計画
- 投資の正当性
- 新興市場の特定
- マーケティング戦略の強化
- 業務効率の向上
- 規制動向への対応


 無料サンプルを入手 - イメージ増強管市場