
Análisis y pronóstico del mercado de tubos intensificadores de imagen por tamaño, participación, crecimiento y tendencias para 2031
Tamaño y pronóstico del mercado de tubos intensificadores de imagen (2021-2031), participación global y regional, tendencias y análisis de oportunidades de crecimiento. Cobertura del informe: por generación (1.ª, 2.ª y 3.ª generación), usuario final (militar, sanitario, biotecnológico y otros) y geografía.
- Estado : Datos publicados
- Código de informe : TIPRE00010542
- Categoría : Electrónica y semiconductores
- Número de páginas : 150
- Formatos de informe disponibles :


- Fecha de última actualización : February 15, 2025

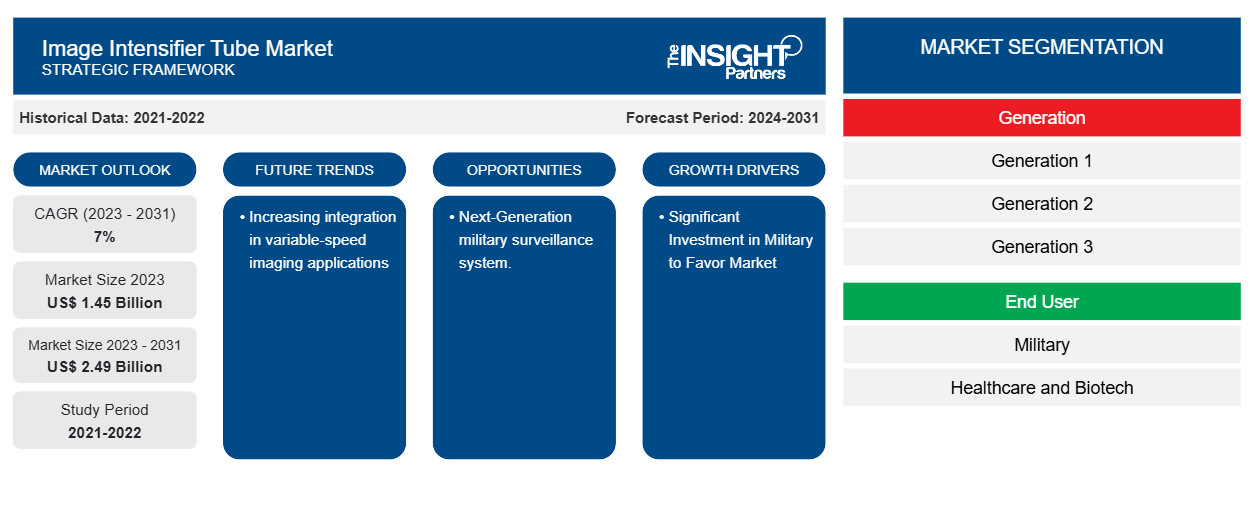
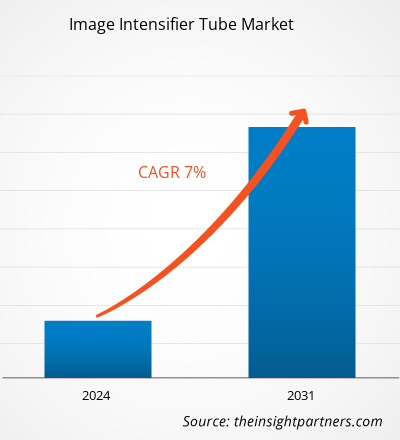
Se prevé que el tamaño del mercado de tubos intensificadores de imagen alcance los 2.490 millones de dólares estadounidenses en 2031, frente a los 1.450 millones de dólares estadounidenses en 2023. Se espera que el mercado registre una CAGR del 7,0 % durante el período 2023-2031. Es probable que el aumento de los contratos para la adquisición y el avance de los sistemas de visión nocturna y la creciente demanda de máquinas de rayos X sigan siendo tendencias clave en el mercado.
Análisis del mercado de tubos intensificadores de imagen
Se prevé que la demanda del mercado de tubos intensificadores de imagen aumente con la creciente adquisición de sistemas de cámaras de alta velocidad, incluido el HiCATT, que es un accesorio intensificador para cualquier cámara de alta velocidad. Instrumentos como estos se utilizan para capturar imágenes en condiciones de movimiento. Además, el aumento de los contratos para la adquisición y el avance de los sistemas de visión nocturna y la creciente demanda de máquinas de rayos X están impulsando el crecimiento del mercado de tubos intensificadores de imagen.
Descripción general del mercado de tubos intensificadores de imagen
Los tubos intensificadores de imagen (IIT) son tubos de vacío que intensifican una imagen con niveles bajos de luz hasta niveles observables. Los tubos intensificadores de imagen son uno de los módulos más importantes de los dispositivos de visión nocturna que definen un papel crucial en aplicaciones industriales, de defensa y de seguridad. La tecnología de fabricación de tubos intensificadores de imagen es difícil y los parámetros de rendimiento de los IIT modernos varían incluso dentro del mismo proceso tecnológico. Además, los informes de prueba proporcionados por los fabricantes no son totalmente confiables porque existen diferencias en los métodos de prueba utilizados por diferentes fabricantes. Además, las fuentes bibliográficas ofrecen afirmaciones contradictorias de una variedad de fabricantes. Es común encontrar en el mercado mundial dos dispositivos de visión nocturna con las mismas limitaciones de hoja de datos pero con diferente calidad de imagen. Debido a algunas de las razones mencionadas anteriormente, probar los tubos intensificadores de imagen es de gran importancia tanto para los fabricantes de tubos, los fabricantes de dispositivos de visión nocturna (NVD) como para los usuarios finales de NVD.
Personalice este informe según sus necesidades
Obtendrá personalización en cualquier informe, sin cargo, incluidas partes de este informe o análisis a nivel de país, paquete de datos de Excel, así como también grandes ofertas y descuentos para empresas emergentes y universidades.
Mercado de tubos intensificadores de imagen: perspectivas estratégicas
-
Obtenga las principales tendencias clave del mercado de este informe.Esta muestra GRATUITA incluirá análisis de datos, desde tendencias del mercado hasta estimaciones y pronósticos.
Factores impulsores y oportunidades del mercado de tubos intensificadores de imagen
Importante inversión militar favorecerá al mercado
La visión nocturna se ha convertido en una tecnología optoelectrónica crucial en la guerra moderna, y cada vez hay más combates que se desarrollan de noche. Los tubos intensificadores de imagen Photonis están integrados en los equipos de los principales proveedores de sistemas ópticos del mundo. Varias empresas ofrecen tubos intensificadores de imagen para uso militar. Por ejemplo, Photonics es una de las pioneras en la fabricación y el diseño de tubos intensificadores de imagen de última generación para uso militar y de defensa. Photonis ofrece tubos intensificadores de imagen de alta calidad para una amplia gama de dispositivos de visión nocturna para dar a los soldados una ventaja estratégica en operaciones nocturnas.optoelectronic technology in modern warfare, and more combats are emerging and taking play at night. Photonis image intensifier tubes are integrated into equipment of the world’s leading suppliers of optical systems. Various companies offer image intensifier tubes for military use. For example, Photonics is one of the pioneers in the manufacturing and design of state-of-the-art image intensifier tubes for military and defense. Photonis offers high-quality image intensifier tubes for a broad range of night vision devices to give soldiers a strategic advantage in night operations.
Además, las empresas están tomando varias iniciativas, como por ejemplo, el suministro de una gran cantidad de tubos intensificadores de imagen. Por ejemplo, en febrero de 2024, Photonis, la marca de Exosens y uno de los líderes mundiales en tubos intensificadores de imagen, fue seleccionada, por segunda vez, para suministrar 40.000 tubos intensificadores de imagen 4G de 16 mm para los binoculares de visión nocturna Mikron de Theon Sensors que se suministrarán a las Fuerzas Armadas alemanas y belgas. Por lo tanto, una inversión significativa en el ejército está impulsando el mercado de tubos intensificadores de imagen.Photonis, the brand of Exosens and one of the world leaders in image intensifier tubes, was selected, for the second time, to supply 40,000 4G 16mm image intensifier tubes for Mikron night vision binoculars of Theon Sensors to be supplied to German and Belgian Armed Forces. Thus, a significant investment in the military is driving the image intensifier tube market.
Sistema de vigilancia militar de próxima generación.
El Ejército está solicitando un requerimiento para un radar pasivo móvil de próxima generación, un tipo de sistema de vigilancia persistente de largo alcance del Ejército montado en un camión táctico que puede desplegar rápidamente un sensor de 60 pies de alto para ayudar a distinguir misiles de crucero, aviones y sistemas de vuelo no tripulados más pequeños. El 26 de marzo, la oficina del Ejército responsable del desarrollo y la compra de sensores de artillería de defensa aérea y artillería de campaña publicó un aviso en el que solicitaba comentarios de empresas potencialmente interesadas en competir por el nuevo radar . Además, los ejércitos líderes están equipados con NVD Gen 3 y Gen 4 que ofrecen una calidad de imagen superior, un alcance extendido y efectos de halo reducidos. Los dispositivos Gen 3 utilizan fotocátodos de arseniuro de galio y amplificación de placa de microcanal (MCP). Por lo tanto, el sistema de vigilancia militar de próxima generación ofrece muchas oportunidades en el mercado de tubos intensificadores de imagen.
Análisis de segmentación del informe de mercado de tubos intensificadores de imagen
Los segmentos clave que contribuyeron a la derivación del análisis del mercado de tubos intensificadores de imagen son la generación y el usuario final.
- Según las generaciones, el mercado de tubos intensificadores de imagen se divide en generación 1, generación 2 y generación 3. La generación 2 tuvo una participación de mercado significativa en 2023.
- Por usuario final, el mercado se segmenta en biotecnología militar, sanitaria y otros. El segmento militar tuvo una participación significativa del mercado en 2023.
Análisis de la cuota de mercado de los tubos intensificadores de imagen por geografía
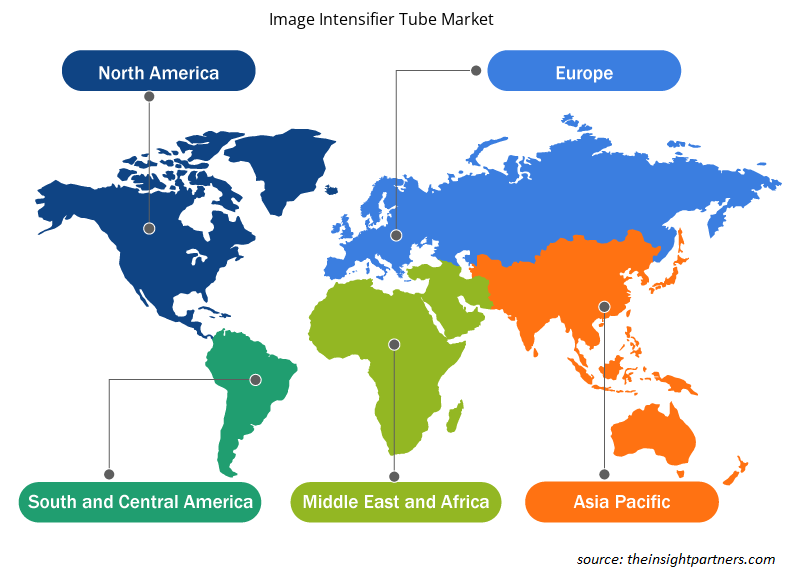
El alcance geográfico del informe de mercado del tubo intensificador de imagen se divide principalmente en cinco regiones: América del Norte, Asia Pacífico, Europa, Medio Oriente y África, y América del Sur y Central.
América del Norte ha dominado el mercado de los tubos intensificadores de imagen. América del Norte es una de las regiones más avanzadas en lo que respecta a la adopción de tecnologías avanzadas. A lo largo de los años, América del Norte ha experimentado un aumento en la adopción de equipos militares tecnológicamente avanzados para mejorar sus capacidades militares. Los organismos gubernamentales de países como Estados Unidos, Canadá y México han aumentado su gasto militar. Además, los países de América del Norte han experimentado un aumento de la inversión en el sector de la salud para mejorar su infraestructura médica. Por lo tanto, el aumento de las inversiones en los sectores en los que el tubo intensificador de imagen es esencial está impulsando el crecimiento del mercado.
Perspectivas regionales del mercado de tubos intensificadores de imagen
Los analistas de Insight Partners explicaron en detalle las tendencias y los factores regionales que influyen en el mercado de tubos intensificadores de imagen durante el período de pronóstico. Esta sección también analiza los segmentos y la geografía del mercado de tubos intensificadores de imagen en América del Norte, Europa, Asia Pacífico, Oriente Medio y África, y América del Sur y Central.
- Obtenga datos regionales específicos para el mercado de tubos intensificadores de imagen
Alcance del informe de mercado de tubos intensificadores de imagen
| Atributo del informe | Detalles |
|---|---|
| Tamaño del mercado en 2023 | 1.450 millones de dólares estadounidenses |
| Tamaño del mercado en 2031 | US$ 2,49 mil millones |
| CAGR global (2023 - 2031) | 7% |
| Datos históricos | 2021-2022 |
| Período de pronóstico | 2024-2031 |
| Segmentos cubiertos |
Por Generación
|
| Regiones y países cubiertos |
América del norte
|
| Líderes del mercado y perfiles de empresas clave |
|
Densidad de actores del mercado: comprensión de su impacto en la dinámica empresarial
El mercado de tubos intensificadores de imagen está creciendo rápidamente, impulsado por la creciente demanda de los usuarios finales debido a factores como la evolución de las preferencias de los consumidores, los avances tecnológicos y una mayor conciencia de los beneficios del producto. A medida que aumenta la demanda, las empresas amplían sus ofertas, innovan para satisfacer las necesidades de los consumidores y aprovechan las tendencias emergentes, lo que impulsa aún más el crecimiento del mercado.
La densidad de actores del mercado se refiere a la distribución de las empresas o firmas que operan dentro de un mercado o industria en particular. Indica cuántos competidores (actores del mercado) están presentes en un espacio de mercado determinado en relación con su tamaño o valor total de mercado.
Las principales empresas que operan en el mercado de tubos intensificadores de imagen son:
- Dispositivos Optronicos BEL Limited (BELOP)
- MÁS DIFÍCIL.digital
- Tubos y dispositivos electrónicos Canon Co., Ltd.
- Tecnologías L3Harris, Inc.
- Óptica Newcon
- Fototeca
Descargo de responsabilidad : Las empresas enumeradas anteriormente no están clasificadas en ningún orden particular.
- Obtenga una descripción general de los principales actores clave del mercado de tubos intensificadores de imagen
Noticias y desarrollos recientes del mercado de tubos intensificadores de imagen
El mercado de tubos intensificadores de imagen se evalúa mediante la recopilación de datos cualitativos y cuantitativos posteriores a la investigación primaria y secundaria, que incluye publicaciones corporativas importantes, datos de asociaciones y bases de datos. A continuación, se enumeran algunos de los avances en el mercado de tubos intensificadores de imagen:
- Exosens anunció la expansión de su cartera de productos de imágenes científicas Photonis Ultimate Detection con la introducción de la solución intensificadora de imágenes de 25 mm. Esta última tecnología, diseñada para respaldar una amplia variedad de aplicaciones científicas, como imágenes médicas y de alta velocidad, visión artificial, robótica e investigación, se exhibirá en SPIE Photonics West.
(Fuente: Exosens, sitio web de la empresa, enero de 2024)
- Photonis, marca de Exosens y uno de los líderes mundiales en tubos intensificadores de imagen, fue seleccionada, por segunda vez, para suministrar 40.000 tubos intensificadores de imagen 4G de 16 mm para los binoculares de visión nocturna Mikron de Theon Sensors que se suministrarán a las Fuerzas Armadas alemanas y belgas.
(Fuente: Nombre de la empresa Photonis, febrero de 2024)
Informe de mercado de tubos intensificadores de imagen: cobertura y resultados
El informe “Tamaño y pronóstico del mercado de tubos intensificadores de imagen (2021-2031)” proporciona un análisis detallado del mercado que cubre las siguientes áreas:
- Tamaño del mercado de tubos intensificadores de imagen y pronóstico a nivel global, regional y nacional para todos los segmentos clave del mercado cubiertos bajo el alcance.
- Tendencias del mercado de tubos intensificadores de imagen, así como dinámica del mercado, como impulsores, restricciones y oportunidades clave.
- Análisis detallado PEST/Cinco fuerzas de Porter y FODA.
- Análisis del mercado del tubo intensificador de imagen que cubre las tendencias clave del mercado, el marco global y regional, los principales actores, las regulaciones y los desarrollos recientes del mercado.
- Análisis del panorama de la industria y la competencia que cubre la concentración del mercado, el análisis del mapa de calor, los actores destacados y los desarrollos recientes para el mercado de tubos intensificadores de imagen.
- Perfiles detallados de empresas.

Naveen es un experimentado profesional en investigación de mercados y consultoría con más de 9 años de experiencia en proyectos personalizados, sindicados y de consultoría. Actualmente se desempeña como Vicepresidente Asociado, donde ha gestionado con éxito a las partes interesadas en toda la cadena de valor del proyecto y ha redactado más de 100 informes de investigación y más de 30 proyectos de consultoría. Su trabajo abarca proyectos industriales y gubernamentales, contribuyendo significativamente al éxito de los clientes y a la toma de decisiones basada en datos.
Naveen es licenciado en Ingeniería Electrónica y Comunicaciones por la VTU (Karnataka) y tiene un MBA en Marketing y Operaciones por la Universidad de Manipal. Ha sido miembro activo del IEEE durante 9 años, participando en conferencias, simposios técnicos y realizando voluntariado tanto a nivel de sección como regional. Antes de su puesto actual, trabajó como Consultor Estratégico Asociado en IndustryARC y como Consultor de Servidores Industriales en Hewlett Packard (HP Global).
- Análisis exhaustivo del tamaño del mercado y previsiones
- Análisis detallado de la segmentación
- Evaluación en profundidad de la dinámica del mercado
- Información a nivel regional y nacional
- Panorama competitivo y análisis comparativo de empresas
- Inteligencia empresarial estratégica
Testimonios
El informe de mercado de sistemas SCADA de Insight Partners es completo y ofrece información valiosa sobre las tendencias actuales y las previsiones futuras. El equipo fue altamente profesional, receptivo y me brindó un gran apoyo en todo momento. Estamos muy satisfechos y recomendamos ampliamente sus servicios.
RAN KEDEM Socio, Reali Technologies LTDsSolicité un informe sobre un mercado de software muy específico y el equipo lo elaboró en pocos días. La información era muy relevante y estaba bien presentada. Posteriormente, solicité algunos cambios y adiciones al informe. El equipo fue muy receptivo y recibí el informe final en menos de una semana.
JEAN-HERVE JENN Presidente, Future AnalyticaTrabajamos con The Insight Partners para un importante estudio y pronóstico de mercado. Nos brindaron una visión clara de las oportunidades y los riesgos, lo que nos ayudó a definir nuestros planes. Su investigación fue fácil de usar y se basó en datos sólidos. Nos ayudó a tomar decisiones inteligentes y seguras. Los recomendamos ampliamente.
PIYUSH NAGPAL Vicepresidente Sénior, , High Beam GlobalThe Insight Partners realizó una investigación de mercado profunda y bien estructurada con una sólida experiencia en el sector. Su equipo fue profesional y receptivo en todo momento. El sitio web, fácil de usar, facilitó el acceso a los informes del sector. Los recomendamos ampliamente por sus servicios de investigación confiables y de alta calidad.
YUKIHIKO ADACHI Director Ejecutivo, , Deep Blue, LLCEsta es la primera vez que compro un informe de mercado de The Insight Partners. Aunque al principio tenía dudas, visité su sitio web y me sentí más cómodo al arriesgarme y comprarlo. Estoy completamente satisfecho con la calidad del informe y el servicio al cliente. Tenía varias preguntas y comentarios sobre el informe inicial, pero después de un par de conversaciones por correo electrónico con su analista, creo que tengo un informe que puedo usar como base para nuestro proceso de planificación estratégica. Muchas gracias por tomarse el tiempo y hacer de esta una experiencia positiva. Sin duda, recomendaré sus servicios y serán mi primera opción cuando necesitemos más datos de mercado.
JOHN SUZUKI Presidente y Director Ejecutivo, Director de la Junta Directiva, BK TechnologiesAgradezco su apoyo y la profesionalidad que demostraron al atender mi solicitud de información sobre el mercado de diagnóstico in vitro (IVD) para enfermedades infecciosas en Nigeria. Agradezco su paciencia, su orientación y su disposición a ofrecerme un descuento, lo que finalmente nos permitió cerrar un trato. Espero poder colaborar con The Insight Partners en el futuro, gracias a la impresión que me causó este primer encuentro.
DRA. CHIJIOKE ONYIA, DIRECTORA GENERAL, PineCrest Healthcare Ltd.Razón para comprar
- Toma de decisiones informada
- Comprensión de la dinámica del mercado
- Análisis competitivo
- Información sobre clientes
- Pronósticos del mercado
- Mitigación de riesgos
- Planificación estratégica
- Justificación de la inversión
- Identificación de mercados emergentes
- Mejora de las estrategias de marketing
- Impulso de la eficiencia operativa
- Alineación con las tendencias regulatorias


