工業用吸収剤市場の成長、規模、シェア、傾向、主要プレーヤーの分析、2031年までの予測
過去データ : 2021-2022 | 基準年 : 2023 | 予測期間 : 2023-2031工業用吸収剤市場の規模と予測(2021年 - 2031年)、世界および地域のシェア、トレンド、成長機会分析レポートの対象範囲:製品タイプ(パッド、ロール、ピロー、ブーム、ソックス、その他)、タイプ(ユニバーサル、オイルのみ、危険物/化学)、最終用途産業(石油・ガス、化学、食品加工、ヘルスケア、自動車、その他)、および地域別
- ステータス : 出版
- レポートコード : TIPRE00009411
- カテゴリー : 化学薬品および材料
- ページ数 : 181
- 利用可能なレポート形式 :


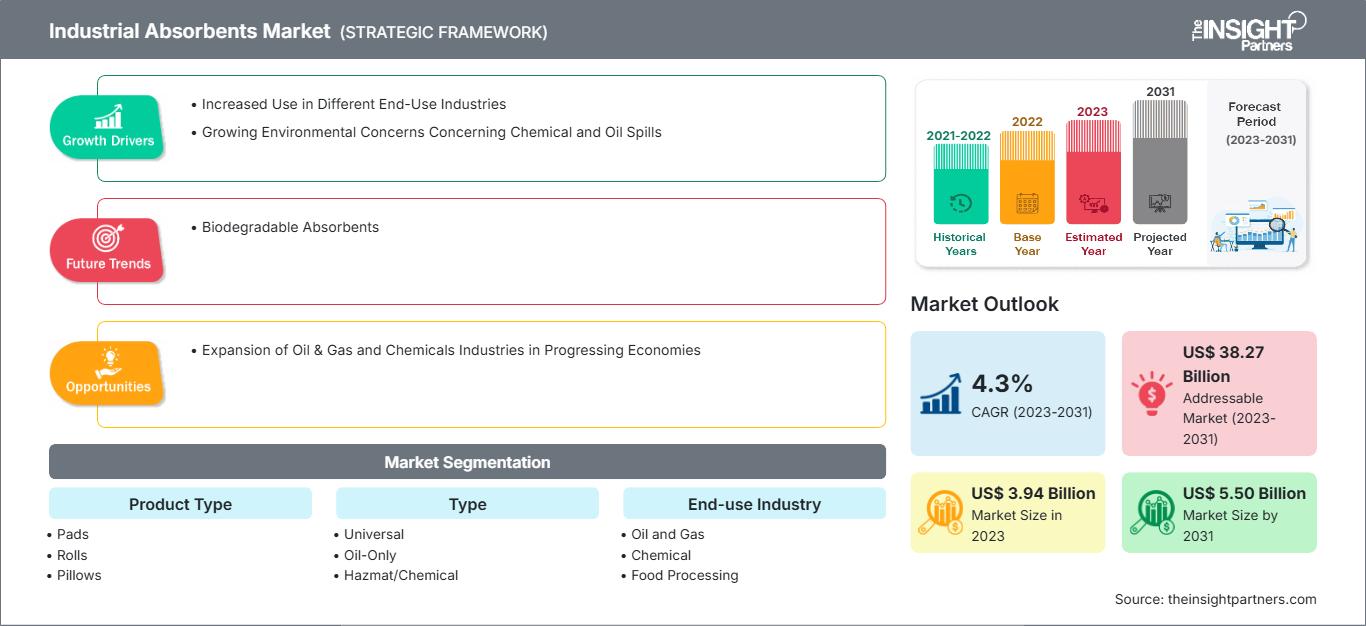
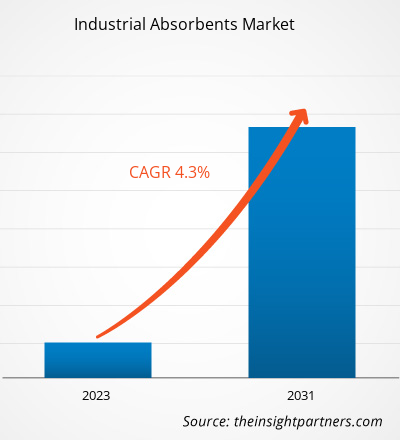
工業用吸収剤市場は、2023年の39億4,000万米ドルから2031年には55億米ドルに成長すると予測されており、2023年から2031年にかけて4.3%のCAGRで成長すると見込まれています。天然の工業用吸収剤の概念化は、さまざまな工業プロセスで油流出やその他の液体を吸収することにより、環境の持続可能性を確保する上で重要な役割を果たすため、引き続き重要なトレンドとなる可能性があります。
工業用吸収剤市場分析
工業用吸収剤の使用は、主に油流出、化学物質、その他の危険物質の制御と浄化を目的とした製品に焦点を当てた、より広範な環境管理および安全産業において非常に重要です。これらの吸収剤は、特に石油・ガス、化学製造、医薬品、食品加工などの産業において、職場の安全を維持し、環境汚染を防ぐために不可欠です。市場は、世界中の産業活動の急増、および環境保護と職場の安全に対する意識の高まりと規制措置によって推進されています。石油・ガスおよび化学部門の操業は、とりわけ事故による流出や排出作業と相まって、近隣の生態系に有害な影響を及ぼします。したがって、企業は効果的な流出管理および制御措置を講じることが義務付けられています。アジア太平洋および中東・アフリカの発展途上国における石油・ガスおよび化学産業の拡大は、今後数年間で市場に大きなチャンスを生み出す可能性があります。
工業用吸収剤市場の概要
石油・ガス、化学、食品加工、ヘルスケア、製薬業界は、工業用吸収剤の主なエンドユーザーです。工業用吸収剤は、石油・ガス業界における大規模および小規模の油流出の清掃に使用されます。石油処理中の燃料排出、大規模な沖合石油ユニットからの漏洩、石油掘削中の事故、および海路による石油輸送による事故による石油流出は、周囲の環境に深刻な脅威をもたらす可能性があります。油流出は水質を悪化させ、水生生態系に悪影響を及ぼします。油流出事故の急増は、石油およびガス業界における工業用吸収剤の需要を引き起こします。たとえば、国際タンカー所有者汚染連盟によると、2023年にはタンカーからの大規模な油流出が1件、中程度の油流出が9件記録され、環境に失われた石油の量はおよそ2,000トンに上ります。これらの事故は、アジア、アフリカ、ヨーロッパ、および南北アメリカで発生しました。石油精製所の数の増加は、工業用吸収剤の需要を促進するもう1つの要因です。北米および中東の石油およびガス産業における掘削作業の増加は、工業用吸収剤の需要増加に大きく貢献しています。化学業界では、保管中の化学物質の輸送中に化学物質の流出が発生することがよくあります。工業用吸収剤は、放置すると危険な可能性のある化学物質の洗浄に広く使用されています。そのため、石油・ガス、化学、食品加工、ヘルスケアなど、さまざまな業界での使用が増えており、工業用吸収剤市場の成長を促進しています。
要件に合わせてレポートをカスタマイズ
レポートの一部、国レベルの分析、Excelデータパックなどを含め、スタートアップ&大学向けに特別オファーや割引もご利用いただけます(無償)
工業用吸収剤市場: 戦略的洞察
-
このレポートの主要な市場動向を入手してください。この無料サンプルには、市場動向から見積もりや予測に至るまでのデータ分析が含まれます。
工業用吸収剤市場の推進要因と機会
化学物質および石油流出に関する環境懸念の高まりが市場成長を後押し
石油流出は、長期にわたる環境災害であり、その影響は多岐にわたります。石油流出の影響は、流出の規模と場所によって、軽微なものから深刻なものまで多岐にわたります。油は、表層に生息する動物や鳥類を中毒または窒息させたり、浮力や天然の防水能力に影響を与えたりすることで、死に至る可能性があります。汚染された食料は動物の栄養失調につながり、時間の経過とともに中毒を引き起こす可能性があります。野生生物が生息する地域で油流出が発生した場合、被害は甚大になる可能性があります。油は哺乳類の毛皮の断熱性を阻害し、鳥の羽毛の撥水性に影響を与えます。断熱性や撥水性がなければ、哺乳類や鳥類は低体温症で死亡する可能性があります。さらに、石油および石油製品(石油製品)には、ガスとして放出される多くの揮発性化合物が含まれています。これらのガスは、強い化学臭を発する場合もあれば、そうでない場合もありますが、周囲の空気を汚染する可能性があり、長期間曝露されると健康リスクにつながる可能性があります。さらに、汚染物質は一度大気中に入ると、長距離を移動する可能性があります。発生源における汚染レベルと特定の気象条件は、石油汚染された空気蒸気の最終的な拡散を左右する可能性があります。油流出は、油膜や油膜光沢を引き起こし、沿岸水域、汀線、ビーチ、湿地などの美観とレクリエーション価値も損ないます。深刻な結果として、流出が除去され清掃プロセスが完了するまで、少なくとも一時的にこれらの地域でのレクリエーション活動が中止されることがあります。
油流出の発生は、流出した油に直接接触したり、揮発した油成分を吸い込んだり、食物連鎖のどの段階でも汚染された食品を摂取したりすると、一般に人間、魚、動物、鳥、野生生物に即時の影響を及ぼす可能性があります。さまざまな国の政府は、油や化学物質の流出に関する規制を実施しています。たとえば、カナダ石油ガス事業法の第14条規則では、石油およびガス産業における探査、掘削、生産、貯蔵、輸送、流通、その他の事業による大気、土地、または水の汚染を防止するために必要な措置を規定しています。したがって、環境への懸念の高まりと、それに伴う油流出防止規制により、世界中で工業用吸収剤の需要が高まっています。
発展途上国における石油・ガスおよび化学産業の拡大が大きなチャンスを創出
国際エネルギー機関(IEA)によると、中国とインドはアジア太平洋地域の総石油生産量の主要な貢献国となっています。米国エネルギー情報局(US EIA)は、中国を世界第5位の石油生産国にランク付けしています。世界の石油生産量に占めるアジアのシェアは緩やかながらも着実に減少していますが、2025年までの世界の石油需要の増加の約77%を占めると予想されています。さらに、石油輸入への依存度は2025年までに81%に増加すると予想されています。中国は化学処理の中心地でもあり、世界で生産される化学物質の大部分を占めています。中国は世界の化学品売上高の35%以上を占めています。世界的にさまざまな化学薬品の需要が高まっているため、この業界では生産活動の規模拡大が進んでいます。
Invest Indiaによると、インドは世界第3位のエネルギーと石油の消費国です。インドの原油と石油製品の消費量は、2023年度に2億2,304万トンに達しました。そのため、同国の石油・ガス産業は活況を呈しており、各社は急増する需要に対応するために生産量を増やす投資を行っています。インド政府は、石油・ガス公共部門の事業体に対し、自動承認ルートで石油製品、製油所、天然ガスなどの分野への100%外国直接投資(FDI)を許可する命令を承認しました。インドには高度に多様化した化学処理産業もあり、7万種類以上の製品を製造しています。生産量ではアジア第3位、生産量では世界第7位の化学品生産国です。インド・ブランド・エクイティ財団によると、インドは世界第4位の農薬生産国です。世界の染料および染料中間体の約16%をインドが占めています。インドの着色剤産業は、世界市場シェアの約15%を占める事業として成長しています。
中東の化学産業は、世界の石油化学製品生産において依然として優位な地位を維持しています。石油化学分野の複数の企業が実施している多角化戦略は、この地域の化学産業の成長を後押しする要因となっています。例えば、サウジアラムコはダウ・ケミカルと合弁会社を設立し、グリコールエーテル、ポリエーテルポリオール、ポリオレフィンエラストマー、イソシアネート、プロピレングリコールなど、幅広い化学製品の生産プロセスユニットを擁しています。サウジアラムコは、サウジアラビアの公共投資基金を通じてSABICの株式70%の取得を完了し、石油化学事業と精製プロセスを統合して、世界市場の競争上のニーズに対応しました。
したがって、発展途上国の石油・ガスおよび化学産業のこのような発展は、予測期間中に工業用吸収剤市場のプレーヤーに大きな拡大の機会を生み出す可能性があります。
工業用吸収剤市場レポートのセグメンテーション分析
工業用吸収剤市場分析の導出に貢献した主要セグメントは、製品タイプ、タイプ、および最終用途産業です。
- 工業用吸収剤市場は、製品タイプに基づいて、パッド、ロール、枕、ブーム、ソックス、その他に分類されています。ブームセグメントは2023年に最大の市場シェアを占めました。
- タイプ別に、市場はユニバーサル、オイルのみ、および危険物/化学物質に分類されています。 2023年には、危険物/化学セグメントが工業用吸収剤市場で最大のシェアを占めました。
- 最終用途産業別では、工業用吸収剤市場は石油・ガス、化学、食品加工、ヘルスケア、自動車、その他に分類されています。石油・ガス部門は2023年に最大の収益シェアで市場をリードしました。
地域別工業用吸収剤市場シェア分析
地域別では、工業用吸収剤市場は主に北米、ヨーロッパ、アジア太平洋、中東・アフリカ、南米および中米に分類されています。アジア太平洋地域は2023年に最大の市場シェアを占め、予測期間中に最高のCAGRを記録すると予想されています。アジア太平洋地域は、化学、石油・ガス、ヘルスケア、自動車、食品加工産業などの急速な成長により、工業用吸収剤の主要市場の1つとなっています。政府の取り組みや政策は、FDIを奨励することで様々な製造工場の設立を促し、それぞれの国の工業化をさらに後押ししています。中国、韓国、インド、オーストラリア、そして日本は、アジア太平洋地域の工業用吸収剤市場における主要な貢献国です。2023年には中国が最大の市場シェアを占め、インドがそれに続き2番目に大きなシェアを占めました。中国海上安全局は、中国海域における海洋汚染事故を監視しており、これらの事故の調査と対応も担当しています。中国はまた、2010年から2012年にかけて、船舶による輸送を規制するための一連の新しい汚染規制を施行しました。このような厳格な規制環境は、中国の工業用吸収剤市場の成長を後押ししています。
工業用吸収剤市場
工業用吸収剤市場
予測期間全体を通して工業用吸収剤市場に影響を与える地域的な傾向と要因については、The Insight Partnersのアナリストが詳細に説明しています。このセクションでは、北米、ヨーロッパ、アジア太平洋、中東・アフリカ、中南米における工業用吸収剤市場のセグメントと地域についても説明します。
工業用吸収剤市場レポートの範囲
| レポート属性 | 詳細 |
|---|---|
| の市場規模 2023 | US$ 3.94 Billion |
| 市場規模別 2031 | US$ 5.50 Billion |
| 世界的なCAGR (2023 - 2031) | 4.3% |
| 過去データ | 2021-2022 |
| 予測期間 | 2023-2031 |
| 対象セグメント |
By 製品タイプ
|
| 対象地域と国 |
北米
|
| 市場リーダーと主要企業の概要 |
|
工業用吸収剤市場のプレーヤーの密度:ビジネスダイナミクスへの影響を理解する
工業用吸収剤市場は、消費者の嗜好の変化、技術の進歩、製品の利点に対する認知度の高まりといった要因によるエンドユーザーの需要増加に牽引され、急速に成長しています。需要の増加に伴い、企業は製品ラインナップの拡充、消費者ニーズへの対応のための革新、そして新たなトレンドの活用を進めており、これが市場の成長をさらに加速させています。
- 入手 工業用吸収剤市場 主要プレーヤーの概要
工業用吸収剤市場のニュースと最近の動向
工業用吸収剤市場は、主要な企業出版物、協会データ、データベースなどの一次調査と二次調査後の定性的および定量的データを収集することで評価されます。市場におけるいくつかの動向を以下に示します。
- Finite Fiber は、効率的な流出清掃用の工業用超吸収剤 PurAbsorb を発売しました。(出典: Finite Fiber、プレスリリース、2024 年 1 月)
- Progressive Planet Solutions Inc. は、珪藻土、ゼオライト、ベントナイトから得られる鉱物ベースの製品の主要メーカーである Absorbent Products Ltd を買収しました。(出典: Progressive Planet Solutions Inc、プレスリリース、2022 年 2 月)
- Domtar は、ジョージア州ジェサップの Engineered Absorbent Materials (EAM) 製造工場を拡張し、エアレイ不織布事業をサポートしました。 (出典: Domtar、プレスリリース、2021 年 5 月)
工業用吸収剤市場レポートの対象範囲と成果物
「工業用吸収剤市場の規模と予測 (2021~2031 年)」このレポートでは、以下の分野を網羅した市場の詳細な分析を提供しています。
- 産業用吸収剤市場の規模と、その範囲内でカバーされているすべての主要な市場セグメントの予測
- 産業用吸収剤市場の動向、および推進要因、制約、主要な機会などの市場動向
- 詳細なポーターのファイブフォース分析とSWOT分析
- 主要な市場動向、国の枠組み、主要プレーヤー、規制、および最近の市場動向を網羅した産業用吸収剤市場分析。
- 市場集中、ヒートマップ分析、主要プレーヤー、および産業用吸収剤市場の最近の動向を網羅した業界の展望と競争分析
- 詳細な企業プロファイル

- 過去2年間の分析、基準年、CAGRによる予測(7年間)
- PEST分析とSWOT分析
- 市場規模価値/数量 - 世界、地域、国
- 業界と競争環境
- Excel データセット
お客様の声
Insight PartnersのSCADAシステム市場レポートは包括的で、現在のトレンドと将来の予測に関する貴重な洞察が含まれています。チームは終始、非常にプロフェッショナルで、対応が早く、サポートも充実していました。私たちは彼らのサービスに非常に満足しており、強くお勧めします。
ラン・ケデム パートナー, レアリテクノロジーズ株式会社非常に特殊なソフトウェア市場に関するレポートを依頼したところ、チームは数日でレポートを作成してくれました。情報は非常に関連性が高く、分かりやすくまとめられていました。その後、レポートにいくつか修正と追加を依頼しましたが、チームは非常に迅速に対応し、1週間も経たないうちに最終レポートを受け取ることができました。
ジャン=エルヴェ・ジェン 会長, フューチャー・アナリティカ重要な市場調査と予測のために、The Insight Partnersと協力しました。彼らは機会とリスクに関する明確な洞察を提供し、私たちの計画策定に役立ちました。彼らの調査は使いやすく、確かなデータに基づいており、賢明で自信に満ちた意思決定に役立ちました。彼らを強くお勧めします。
ピユーシュ・ナグパル 上級副社長, ハイビームグローバルInsight Partnersは、深い専門知識に基づき、洞察力に富み、構造化された市場調査を提供しました。チームは終始プロフェッショナルで、対応力も抜群でした。ユーザーフレンドリーなウェブサイトにより、業界レポートへのアクセスもスムーズでした。信頼性の高い高品質な調査サービスをお探しなら、Insight Partnersを強くお勧めします。
安達幸彦 最高経営責任者(CEO), ディープブルーLLC。The Insight Partnersから市場レポートを購入するのは今回が初めてです。最初は不安でしたが、ウェブサイトを見て、リスクを負ってでも購入してみようという気持ちになりました。レポートの品質とカスタマーサービスには大変満足しています。最初のレポートにはいくつか質問やコメントがありましたが、アナリストとメールで何度かやり取りした結果、戦略策定プロセスへのインプットとして活用できるレポートが完成しました。貴重なお時間を割いていただき、貴重な体験をさせていただき、誠にありがとうございました。他の方にもぜひお勧めしたいですし、今後さらに市場データが必要になった際には、まずThe Insight Partnersにご連絡させていただきます。
ジョン・スズキ 社長兼最高経営責任者、取締役, BKテクノロジーズナイジェリアの感染症IVD市場に関する情報提供依頼に対し、ご対応いただいた際、ご尽力とプロフェッショナルな姿勢に深く感謝申し上げます。忍耐強く、的確なアドバイスをいただき、また、最終的に取引成立に至った割引のご提供にも深く感謝申し上げます。今回の最初の出会いで得た強い印象のおかげで、今後もThe Insight Partnersとの連携を心待ちにしております。
チジオケ博士 オニア マネージングディレクター, パインクレストヘルスケア株式会社購入理由
- 情報に基づいた意思決定
- 市場動向の理解
- 競合分析
- 顧客インサイト
- 市場予測
- リスク軽減
- 戦略計画
- 投資の正当性
- 新興市場の特定
- マーケティング戦略の強化
- 業務効率の向上
- 規制動向への対応


 無料サンプルを入手 - 工業用吸収剤市場