
オーバー・ザ・トップ(OTT)市場規模、成長、トレンド、2034年までの予測
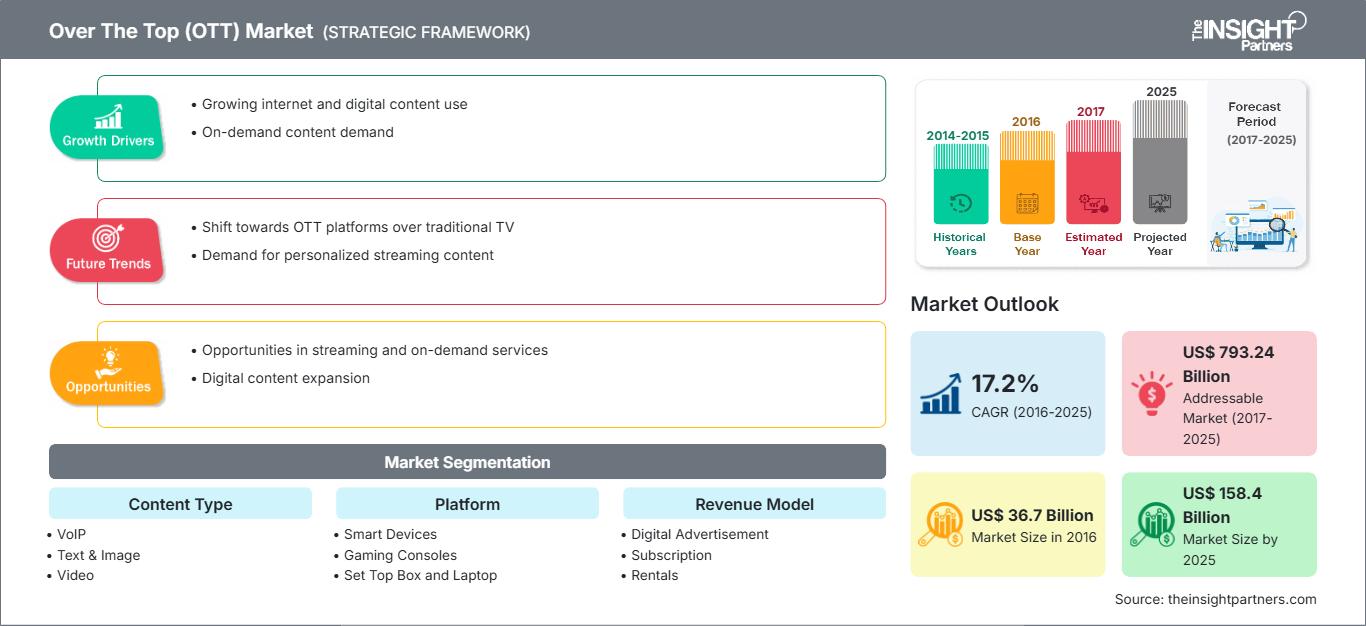
オーバーザトップ(OTT)市場の規模と予測(2021年 - 2034年)、世界および地域のシェア、トレンド、成長機会分析レポートの対象範囲:コンテンツタイプ(VoIP、テキストと画像、ビデオ)、プラットフォーム(スマートデバイス、ゲームコンソール、セットトップボックス、ラップトップ、タブレットとデスクトップ)、収益モデル(デジタル広告、サブスクリプション、レンタルなど)
- ステータス : 公開されたデータ
- レポートコード : TIPTE100000146
- カテゴリー : テクノロジー、メディア、通信
- ページ数 : 150
- 利用可能なレポート形式 :


- 最終更新日 : January 16, 2026

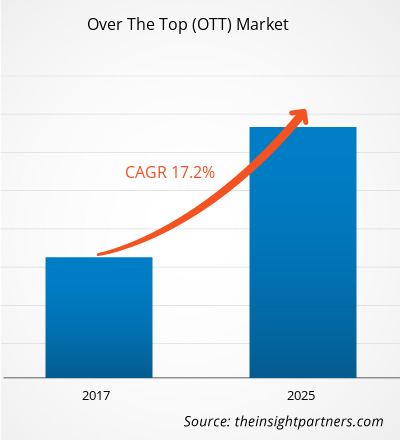
世界のオーバー・ザ・トップ(OTT)市場は、2025年に約1,384.9億米ドルと評価され、2034年までに5,226億米ドルに達すると予測されており、2026年から2034年にかけて約15.9%の複合年間成長率(CAGR)を記録します。
オーバー・ザ・トップ(OTT)市場分析
OTT 市場の成長は、高速インターネット接続の急速な普及、スマート デバイスの普及、オンデマンドで場所を選ばないメディア消費へと移行する消費者行動の進化によって推進されています。
5G対応ストリーミング、コネクテッドTV、没入型ライブコンテンツ(スポーツ、イベント)といった主要なイノベーションが、普及をさらに加速させています。市場は、配信コストの削減、コンテンツ制作(オリジナルコンテンツを含む)の増加、そしてプラットフォームを通じたグローバル展開の恩恵も受けています。
オーバー・ザ・トップ(OTT)市場の概要
OTTとは、従来のケーブルテレビや衛星テレビの配信を介さず、インターネット経由で視聴者に直接提供されるメディアおよびコンテンツ配信サービスを指します。これらのプラットフォームは、スマートデバイス、テレビ、ゲーム機、PCからアクセスできる動画、音声、テキスト、画像、その他のインタラクティブコンテンツを網羅しています。
柔軟なコンテンツ消費、パーソナライズされたエクスペリエンス、マルチデバイス アクセス、そして多くの場合従来の有料テレビよりも安価な代替手段を可能にすることで、OTT プラットフォームは現代のメディア消費モデルの中核コンポーネントになりつつあります。
要件に合わせてレポートをカスタマイズ
このレポートの一部、国レベルの分析、Excelデータパックなど、あらゆるレポートを無料でカスタマイズできます。また、スタートアップや大学向けのお得なオファーや割引もご利用いただけます。
オーバー・ザ・トップ(OTT)市場:戦略的洞察
-
このレポートの主要な市場動向を入手してください。この無料サンプルには、市場動向から見積もりや予測に至るまでのデータ分析が含まれます。
オーバー・ザ・トップ(OTT)市場の推進要因と機会
市場の推進要因:
- デバイスや地域を問わず、柔軟でオンデマンドなメディア消費に対する需要が高まっています。
- 高速ブロードバンドとモバイル インターネットの拡張により、より高品質なストリーミング (4K/HD) とライブ コンテンツが可能になります。
- インターネット接続可能なテレビやスマートデバイスの普及により、リビングルームなどでの OTT アクセスが容易になっています。
- コンテンツ制作者とプラットフォームは、オリジナル番組、ライブ イベント、没入型フォーマットに投資し、消費者のエンゲージメントと維持率を高めています。
市場機会:
- インターネットとスマートフォンの普及が進む新興市場、特にアジア太平洋、ラテンアメリカ、中東アフリカでは、大きなプラスの見込みがあります。
- 高度な分析、AI、機械学習を統合し、パーソナライズされたコンテンツの推奨、広告のターゲティング、ユーザー維持を実現します。
- ハイブリッド収益化モデル(サブスクリプション + 広告サポート)および通信会社またはデバイスメーカーとのバンドル。
- 新しいコンテンツ分野 (ゲーム、ライブスポーツ、インタラクティブコンテンツ) とデバイスプラットフォーム (コネクテッドカー、AR/VR) への拡大。
オーバー・ザ・トップ(OTT)市場レポート:セグメンテーション分析
OTT 市場は、複数のセグメンテーション レンズにわたって分析されます。
コンテンツタイプ別:
- ビデオ
- テキストと画像
- VoIP(ボイスオーバーIP)
プラットフォーム別:
- スマートデバイス(スマートフォン、タブレット)
- ゲーム機
- セットトップボックスとラップトップ
- タブレットとデスクトップ
収益モデル別:
- サブスクリプション(SVOD)
- デジタル広告(AVOD)
- レンタル
地理別:
- 北米
- ヨーロッパ
- アジア太平洋
- 南米と中央アメリカ
- 中東・アフリカ
オーバー・ザ・トップ(OTT)市場地域別インサイト
予測期間全体を通してオーバー・ザ・トップ(OTT)市場に影響を与える地域的なトレンドと要因は、The Insight Partnersのアナリストによって徹底的に解説されています。このセクションでは、北米、ヨーロッパ、アジア太平洋、中東・アフリカ、中南米におけるオーバー・ザ・トップ(OTT)市場のセグメントと地域についても解説します。
オーバー・ザ・トップ(OTT)市場レポートの範囲
| レポート属性 | 詳細 |
|---|---|
| 2025年の市場規模 | 1,384億9,000万米ドル |
| 2034年までの市場規模 | 5,226億米ドル |
| 世界のCAGR(2026年~2034年) | 約15.9% |
| 履歴データ | 2021-2024 |
| 予測期間 | 2026~2034年 |
| 対象セグメント |
コンテンツタイプ別
|
| 対象地域と国 |
北米
|
| 市場リーダーと主要企業の概要 |
|
オーバー・ザ・トップ(OTT)市場のプレーヤー密度:ビジネスダイナミクスへの影響を理解する
オーバー・ザ・トップ(OTT)市場は、消費者の嗜好の変化、技術の進歩、製品メリットへの認知度の向上といった要因によるエンドユーザーの需要増加に牽引され、急速に成長しています。需要の高まりに伴い、企業は提供内容を拡大し、消費者ニーズを満たすためのイノベーションを推進し、新たなトレンドを捉えることで、市場の成長をさらに加速させています。
- オーバー・ザ・トップ(OTT)市場の主要な主要プレーヤーの概要を入手
地域別オーバー・ザ・トップ(OTT)市場シェア分析
北米 – 強力なブロードバンド インフラストラクチャ、スマート デバイスの高い普及率、成熟したストリーミング エコシステムに支えられ、世界の OTT 市場で最大のシェアを占めています。
ヨーロッパ – 高度な規制枠組み、メディアに対する消費者の高額な支出、多言語地域プラットフォームの強力な存在により、大きな市場シェアが推進されています。
アジア太平洋 – インド、中国、東南アジアでのスマートフォン/インターネットの普及、地域コンテンツの成長、モバイルファーストの消費パターンにより、最も急速に成長している地域。
南米および中米 – OTT の採用、可処分所得の増加、モバイルの普及、多言語/地域コンテンツの需要が拡大している新興市場。
中東およびアフリカ – 高い成長の可能性を秘めた発展途上市場。デジタルインフラへの投資の増加、若年層の増加、ストリーミング サービスへの関心の高まり。
オーバー・ザ・トップ(OTT)市場のプレーヤー密度:ビジネスダイナミクスへの影響を理解する
OTT市場には、多数のグローバルプラットフォーム、デバイスメーカー、コンテンツ制作会社、そして地域/ニッチなプレーヤーが参入しており、激しい競争と急速なイノベーションが繰り広げられています。例えば、本レポートでは、Netflix、Amazon.com(Prime Video)、Apple、Facebook、Google LLC(YouTube)といった大手プレーヤーが取り上げられています。
プラットフォームは、差別化を図るために、以下の点に注力しています。
- オリジナルおよびローカライズされたコンテンツの制作。
- 優れたユーザー エクスペリエンス (UI/UX)、デバイスの互換性、ストリーミング品質。
- ユーザーの行動、離脱予測、コンテンツの推奨に関する高度な分析。
- 戦略的パートナーシップ(通信会社、スマートテレビメーカー)とバンドルモデル。
- ハイブリッド収益化(サブスクリプション + 広告)と、サービスが行き届いていない地域へのグローバル展開。
OTT市場で活動する主要企業
- Netflix 株式会社
- Amazon.com, Inc.
- アップル社
- フェイスブック社
- グーグルLLC
- Hulu LLC
- アカマイ・テクノロジーズ株式会社
- HBOナウ
- CBSコーポレーション
調査の過程で分析した他の企業:
- Roku株式会社
- 楽天株式会社
- iQIYI株式会社
- バイアコムCBS社
- ソニー株式会社
- アリババグループホールディングリミテッド
- スナップ株式会社
オーバー・ザ・トップ(OTT)市場のニュースと最近の動向
- 5Gテクノロジーの成長により、より高品質なストリーミング(4K/8K)と没入型ライブイベントストリーミングが可能になり、OTT市場の拡大が加速しています。
- コネクテッド TV の採用が急増しており、ストリーミング プラットフォームはリビングルームでの視聴やスマート TV インターフェース向けに最適化する必要に迫られています。
- サブスクリプションと広告を組み合わせたハイブリッドな収益化モデルが普及しつつあり、プラットフォームにさらなる収益機会をもたらしています。
オーバー・ザ・トップ(OTT)市場レポートの対象範囲と成果物
「オーバー・ザ・トップ(OTT)市場 – グローバル分析と予測(2021-2034年)」レポートでは、以下の情報を提供しています。
- 対象となるすべての主要セグメントについて、世界、地域、国レベルでの市場規模と予測。
- OTT 市場のトレンド、推進要因、制約、および主要な機会。
- 市場環境の詳細な PEST および SWOT 分析。
- 市場集中度、ヒートマップ分析、主要プレーヤー、最近の動向などの競争環境。
- OTT エコシステム全体の主要プレーヤーの詳細な企業プロファイル。

アンキタは、テクノロジー、メディア、ICT、エレクトロニクス・半導体の各分野で8年以上の経験を持つ、ダイナミックな市場調査およびコンサルティングのプロフェッショナルです。Microsoft、Oracle、NEC、SAP、KPMG、Expeditors Internationalといったグローバルクライアントに対し、100件以上のコンサルティングおよび調査案件を主導・遂行してきました。彼女のコアコンピテンシーは、市場評価、データ分析、予測、戦略策定、競合情報、レポート作成です。
アンキタは、販売前の提案書作成やクライアントとの協議から、販売後の実用的なインサイトの提供まで、プロジェクトサイクル全体を巧みに管理することに長けています。彼女は、部門横断的なチームの管理、複雑な調査モジュールの構築、そしてクライアント固有のビジネス目標に合わせたソリューションの調整に長けています。優れたコミュニケーション能力、リーダーシップ、そしてプレゼンテーション能力により、急速に変化する市場環境において、常に価値主導の成果を生み出しています。
- 包括的な市場規模および予測分析
- 詳細なセグメンテーション分析
- 市場動向(ダイナミクス)の徹底的な評価
- 地域および国別のインサイト
- 競争環境および企業ベンチマーク
- 戦略的ビジネスインテリジェンス
お客様の声
Insight PartnersのSCADAシステム市場レポートは包括的で、現在のトレンドと将来の予測に関する貴重な洞察が含まれています。チームは終始、非常にプロフェッショナルで、対応が早く、サポートも充実していました。私たちは彼らのサービスに非常に満足しており、強くお勧めします。
ラン・ケデム パートナー, レアリテクノロジーズ株式会社非常に特殊なソフトウェア市場に関するレポートを依頼したところ、チームは数日でレポートを作成してくれました。情報は非常に関連性が高く、分かりやすくまとめられていました。その後、レポートにいくつか修正と追加を依頼しましたが、チームは非常に迅速に対応し、1週間も経たないうちに最終レポートを受け取ることができました。
ジャン=エルヴェ・ジェン 会長, フューチャー・アナリティカ重要な市場調査と予測のために、The Insight Partnersと協力しました。彼らは機会とリスクに関する明確な洞察を提供し、私たちの計画策定に役立ちました。彼らの調査は使いやすく、確かなデータに基づいており、賢明で自信に満ちた意思決定に役立ちました。彼らを強くお勧めします。
ピユーシュ・ナグパル 上級副社長, ハイビームグローバルInsight Partnersは、深い専門知識に基づき、洞察力に富み、構造化された市場調査を提供しました。チームは終始プロフェッショナルで、対応力も抜群でした。ユーザーフレンドリーなウェブサイトにより、業界レポートへのアクセスもスムーズでした。信頼性の高い高品質な調査サービスをお探しなら、Insight Partnersを強くお勧めします。
安達幸彦 最高経営責任者(CEO), ディープブルーLLC。The Insight Partnersから市場レポートを購入するのは今回が初めてです。最初は不安でしたが、ウェブサイトを見て、リスクを負ってでも購入してみようという気持ちになりました。レポートの品質とカスタマーサービスには大変満足しています。最初のレポートにはいくつか質問やコメントがありましたが、アナリストとメールで何度かやり取りした結果、戦略策定プロセスへのインプットとして活用できるレポートが完成しました。貴重なお時間を割いていただき、貴重な体験をさせていただき、誠にありがとうございました。他の方にもぜひお勧めしたいですし、今後さらに市場データが必要になった際には、まずThe Insight Partnersにご連絡させていただきます。
ジョン・スズキ 社長兼最高経営責任者、取締役, BKテクノロジーズナイジェリアの感染症IVD市場に関する情報提供依頼に対し、ご対応いただいた際、ご尽力とプロフェッショナルな姿勢に深く感謝申し上げます。忍耐強く、的確なアドバイスをいただき、また、最終的に取引成立に至った割引のご提供にも深く感謝申し上げます。今回の最初の出会いで得た強い印象のおかげで、今後もThe Insight Partnersとの連携を心待ちにしております。
チジオケ博士 オニア マネージングディレクター, パインクレストヘルスケア株式会社購入理由
- 情報に基づいた意思決定
- 市場動向の理解
- 競合分析
- 顧客インサイト
- 市場予測
- リスク軽減
- 戦略計画
- 投資の正当性
- 新興市場の特定
- マーケティング戦略の強化
- 業務効率の向上
- 規制動向への対応


