2030年フォトニック設計自動化市場レポート - セグメント、地域、動向、最近の動向、戦略的洞察
過去データ : 2020-2021 | 基準年 : 2022 | 予測期間 : 2023-2030フォトニック設計自動化市場の規模と予測(2020年 - 2030年)、世界および地域のシェア、トレンド、成長機会分析レポートの対象範囲:コンポーネント(ソリューションとサービス)、展開(オンプレミスとクラウド)、組織規模(中小企業と大企業)、アプリケーション(学術研究と産業研究・製造)、および地域別
- ステータス : 出版
- レポートコード : TIPRE00033004
- カテゴリー : テクノロジー、メディア、通信
- ページ数 : 162
- 利用可能なレポート形式 :


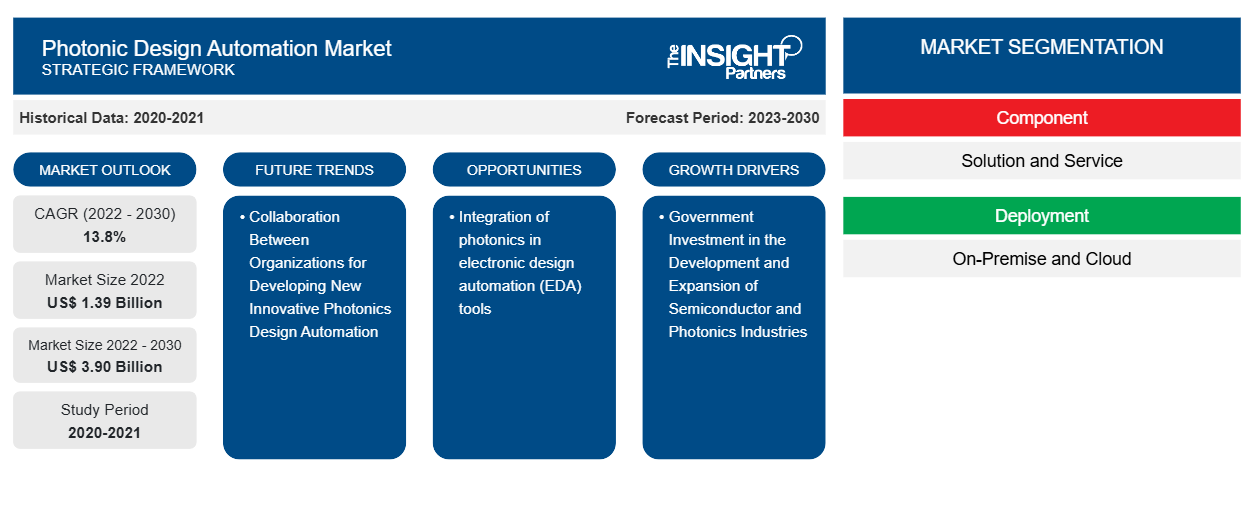
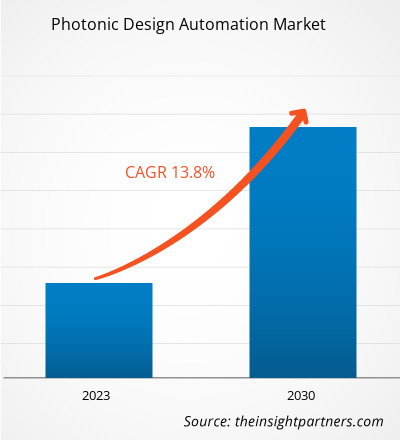
フォトニック設計自動化市場規模は、2022年の13億9,000万米ドルから2030年には39億米ドルに達すると予測されています。市場は2022年から2030年の間に13.8%のCAGRを記録すると予想されています。電子設計自動化(EDA)ツールへのフォトニクスの統合は、市場の主要なトレンドであり続けると思われます。
フォトニック設計自動化市場分析
革新的なフォトニクス設計自動化の開発に向けた組織間の連携と、効率性と精度に対するニーズの高まりが市場を牽引しています。自動化の需要が高まるため、予測期間中に市場は大幅なペースで拡大すると予測されています。さらに、半導体およびフォトニクス産業の発展と拡大に対する政府の投資、および高性能で環境に配慮したソリューションへの重点が、市場に有利な機会を生み出しています。
フォトニック設計自動化市場の概要
フォトニック設計自動化には、複雑な設計を機能的なチップやデバイスにうまく変換することで、フォトニックデバイスやシステムの設計と開発を容易にするソフトウェアツールと自動化技術が必要です。 フォトニック設計自動化は、エレクトロニクス業界の電気設計自動化 (EDA) と同様に、フォトニックコンポーネントとシステムの設計プロセスを迅速化および簡素化することを目的としています。設計者に、回路図、レイアウト、その他の設計コンポーネントを作成するためのソフトウェアツールと自動化された方法を提供します。 フォトニック設計自動化は、フォトニックデバイスとシステムの設計と開発における効率、精度、生産性の向上を目指しています。特定のアクティビティを自動化し、包括的なシミュレーションと分析機能を提供することで、設計者は複数の設計オプションを検討し、パフォーマンスを最大化し、市場投入までの時間を最小限に抑えることができます。 市場は、製造業を含むさまざまな業界で自動化の需要が高まっていることに応じて拡大しています。 生産性の向上、設計プロセスの簡素化、市場投入までの時間の短縮など、フォトニック設計自動化を使用する利点により、自動化の需要が高まっています。
要件に合わせてレポートをカスタマイズする
このレポートの一部、国レベルの分析、Excelデータパックなど、あらゆるレポートを無料でカスタマイズできます。また、スタートアップや大学向けのお得なオファーや割引もご利用いただけます。
フォトニック設計自動化市場:戦略的洞察
-
このレポートの主要な市場動向を入手してください。この無料サンプルには、市場動向から見積もりや予測に至るまでのデータ分析が含まれます。
フォトニック設計自動化市場の推進要因と機会
市場を有利にする革新的なフォトニクス設計自動化の開発に向けた組織間のコラボレーション
政府、産業界、学界は、American Institute for Manufacturing Photonics (AIM Photonics) などの組織を通じて、フォトニクス設計自動化の開発に協力しています。AIM Photonics は、電子フォトニクス設計自動化 (EPDA) におけるパートナーシップとイノベーションを促進することで、フォトニクス産業の発展を目指しています。たとえば、2023 年 5 月、AIM Photonics は最新のサービスであるオプトエレクトロニクス テスト サービスを発表しました。この新しいサービス スイートは、フォトニック集積回路 (PIC) と従来の電子集積回路 (IC) の両方をテストするための最先端のツールと機能を包括的に提供します。AIM Photonics のオプトエレクトロニクス テスト サービスは、集積回路の分野における高度なテスト ソリューションに対する高まる需要に応えます。これらのサービスにより、フォトニック IC と電子 IC の両方のパフォーマンス、信頼性、機能性を徹底的に評価および検証できます。
フォトニクス設計自動化市場の成長は、電子設計自動化 (EDA) 業界の進化によるものです。EDA ツールは当初、電子集積回路 (IC) の設計と検証に重点を置いていましたが、フォトニクス設計機能も含まれるように拡張されました。
半導体・フォトニクス産業の発展と拡大に対する政府投資
フォトニクス設計自動化市場は、フォトニクス技術の発展を支えるダイナミックな分野です。カナダ政府は、世界的なフォトニクス設計自動化産業の発展や、この分野における主要製品の提供などの取り組みを支援してきました。例えば、2022年2月、カナダ政府は半導体およびフォトニクス産業に2億4,000万米ドルという多額の投資を発表しました。この戦略的な動きは、これらの分野の成長と競争力を強化し、カナダを製造と技術革新の強化における世界的リーダーとして位置付けることを目的としています。この投資は、全国の半導体およびフォトニクス産業における最先端技術の開発、研究開発イニシアチブ、製造能力の拡大を支援します。産業界、学界、政府間の連携を促進し、イノベーションを推進し、新たな雇用機会を創出します。
フォトニックレポートセグメンテーション分析
フォトニック分析の導出に貢献した主要なセグメントは、コンポーネント、展開、組織規模、およびアプリケーションです。
- コンポーネントに基づいて、フォトニック設計自動化市場はソリューションとサービスに分かれています。ソリューションセグメントは2022年に大きな市場シェアを占めました。
- 展開別に見ると、市場はオンプレミスとクラウドに分かれています。オンプレミスセグメントは2022年に大きな市場シェアを占めました。
- 組織規模別に見ると、市場は中小企業と大企業に分かれており、2022年には大企業セグメントがより大きな市場シェアを占めました。
- アプリケーションに基づいて、フォトニック設計自動化市場は、学術研究と産業研究および製造に分類されます。産業研究および製造セグメントは、2022年に大きな市場シェアを占めました。
フォトニック設計自動化市場シェアの地域別分析
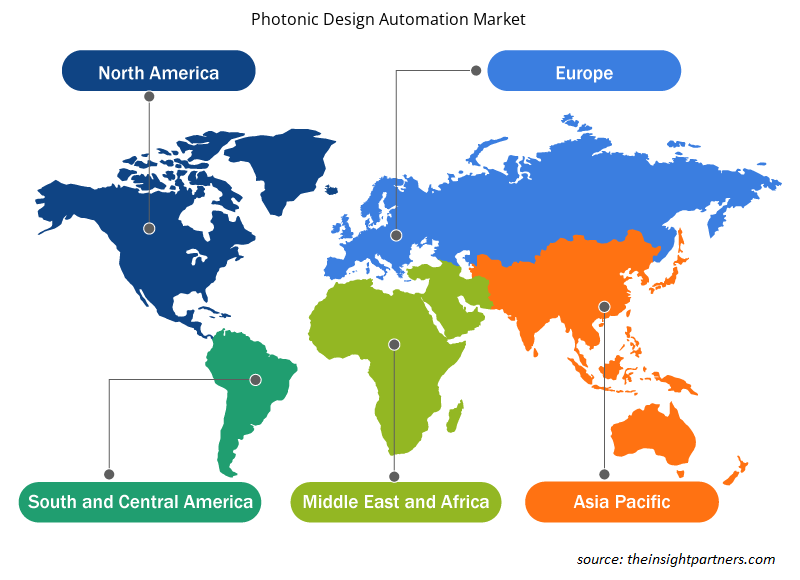
フォトニック設計自動化市場レポートの地理的範囲は、主に北米、アジア太平洋、ヨーロッパ、中東およびアフリカ、南米および中米の 5 つの地域に分かれています。
アジア太平洋地域の市場は、中国、韓国、日本、インドにフォトニクス産業が存在するため、予測期間中に拡大すると予測されています。韓国はフォトニクス産業で大きな存在感を示しており、情報通信技術における技術的進歩で知られています。これが、同国のフォトニクス設計自動化市場の成長に貢献しています。技術の進歩、コラボレーション、研究開発への投資が韓国の市場を牽引しています。製造部門での自動化の実装も、市場を牽引する役割を果たしています。フォトニクス設計自動化は、韓国の通信、データセンター、ヘルスケア、センシングなど、さまざまなアプリケーションにとって不可欠です。これにより、誘導電磁波の効率的な操作が可能になり、高度なフォトニックデバイスの開発に貢献します。
フォトニック設計自動化市場の地域別洞察
予測期間を通じてフォトニック設計自動化市場に影響を与える地域的な傾向と要因は、Insight Partners のアナリストによって徹底的に説明されています。このセクションでは、北米、ヨーロッパ、アジア太平洋、中東およびアフリカ、南米および中米にわたるフォトニック設計自動化市場のセグメントと地理についても説明します。
- フォトニック設計自動化市場の地域別データを入手
フォトニック設計自動化市場レポートの範囲
| レポート属性 | 詳細 |
|---|---|
| 2022年の市場規模 | 13億9千万米ドル |
| 2030年までの市場規模 | 39億ドル |
| 世界のCAGR(2022年 - 2030年) | 13.8% |
| 履歴データ | 2020-2021 |
| 予測期間 | 2023-2030 |
| 対象セグメント |
コンポーネント別
|
| 対象地域と国 |
北米
|
| 市場リーダーと主要企業プロフィール |
|
市場プレーヤーの密度:ビジネスダイナミクスへの影響を理解する
フォトニック設計自動化市場は、消費者の嗜好の変化、技術の進歩、製品の利点に対する認識の高まりなどの要因により、エンドユーザーの需要が高まり、急速に成長しています。需要が高まるにつれて、企業は提供を拡大し、消費者のニーズを満たすために革新し、新たなトレンドを活用し、市場の成長をさらに促進しています。
市場プレーヤー密度とは、特定の市場または業界内で活動している企業または会社の分布を指します。これは、特定の市場スペースに、その市場規模または総市場価値に対してどれだけの競合相手 (市場プレーヤー) が存在するかを示します。
フォトニック設計自動化市場で事業を展開している主要企業は次のとおりです。
- アンシス株式会社
- ライオンイックスインターナショナルBV
- VPlphotonics GmbH社
- オプティウェーブシステムズ株式会社
- ルセダフォトニクス
- ケイデンス・デザイン・システムズ
免責事項:上記の企業は、特定の順序でランク付けされていません。
- フォトニック設計自動化市場のトップキープレーヤーの概要を入手
フォトニック設計自動化市場のニュースと最近の動向
フォトニック設計自動化市場は、主要な企業出版物、協会データ、データベースなどの一次調査と二次調査後の定性的および定量的データを収集することによって評価されます。フォトニック設計自動化市場の動向のいくつかを以下に示します。
- Luceda Photonics は、世界初の統合フォトニクス アプリケーション向け Al2O3 ファウンドリである Aluvia Photonics とのコラボレーションを発表しました。このコラボレーションにより、設計者は Luceda Photonics 設計プラットフォーム内で高度なプロセス設計キット (PDK) を利用でき、Aluvia Photonics で今後実行されるマルチプロジェクト ウェーハ (MPW) にアクセスできるようになります。(出典: Luceda Photonics、企業 Web サイト、2023 年 8 月)。
- AIM Photonics は、フォトニック集積回路 (PIC) と従来の電子 IC の両方をテストするための高度なツール一式を備えた新しいオプトエレクトロニクス テスト サービスの開始を発表しました。(出典: AIM Photonics Inc、企業 Web サイト、2023 年 5 月)
フォトニック設計自動化市場レポートの対象範囲と成果物
「フォトニック設計自動化市場の規模と予測(2020〜2030年)」レポートでは、以下の分野をカバーする市場の詳細な分析を提供しています。
- スコープに含まれるすべての主要市場セグメントについて、世界、地域、国レベルでのフォトニック設計自動化市場の規模と予測
- フォトニック設計自動化市場の動向と、推進要因、制約、主要な機会などの市場動向
- 詳細なPEST/ポーターの5つの力とSWOT分析
- 主要な市場動向、世界および地域の枠組み、主要プレーヤー、規制、最近の市場動向を網羅したフォトニック設計自動化市場分析
- 市場集中、ヒートマップ分析、主要プレーヤー、フォトニック設計自動化市場の最近の動向を網羅した業界の状況と競争分析
- 詳細な企業プロフィール

アンキタは、テクノロジー、メディア、ICT、エレクトロニクス・半導体の各分野で8年以上の経験を持つ、ダイナミックな市場調査およびコンサルティングのプロフェッショナルです。Microsoft、Oracle、NEC、SAP、KPMG、Expeditors Internationalといったグローバルクライアントに対し、100件以上のコンサルティングおよび調査案件を主導・遂行してきました。彼女のコアコンピテンシーは、市場評価、データ分析、予測、戦略策定、競合情報、レポート作成です。
アンキタは、販売前の提案書作成やクライアントとの協議から、販売後の実用的なインサイトの提供まで、プロジェクトサイクル全体を巧みに管理することに長けています。彼女は、部門横断的なチームの管理、複雑な調査モジュールの構築、そしてクライアント固有のビジネス目標に合わせたソリューションの調整に長けています。優れたコミュニケーション能力、リーダーシップ、そしてプレゼンテーション能力により、急速に変化する市場環境において、常に価値主導の成果を生み出しています。
- 過去2年間の分析、基準年、CAGRによる予測(7年間)
- PEST分析とSWOT分析
- 市場規模価値/数量 - 世界、地域、国
- 業界と競争環境
- Excel データセット
お客様の声
Insight PartnersのSCADAシステム市場レポートは包括的で、現在のトレンドと将来の予測に関する貴重な洞察が含まれています。チームは終始、非常にプロフェッショナルで、対応が早く、サポートも充実していました。私たちは彼らのサービスに非常に満足しており、強くお勧めします。
ラン・ケデム パートナー, レアリテクノロジーズ株式会社非常に特殊なソフトウェア市場に関するレポートを依頼したところ、チームは数日でレポートを作成してくれました。情報は非常に関連性が高く、分かりやすくまとめられていました。その後、レポートにいくつか修正と追加を依頼しましたが、チームは非常に迅速に対応し、1週間も経たないうちに最終レポートを受け取ることができました。
ジャン=エルヴェ・ジェン 会長, フューチャー・アナリティカ重要な市場調査と予測のために、The Insight Partnersと協力しました。彼らは機会とリスクに関する明確な洞察を提供し、私たちの計画策定に役立ちました。彼らの調査は使いやすく、確かなデータに基づいており、賢明で自信に満ちた意思決定に役立ちました。彼らを強くお勧めします。
ピユーシュ・ナグパル 上級副社長, ハイビームグローバルInsight Partnersは、深い専門知識に基づき、洞察力に富み、構造化された市場調査を提供しました。チームは終始プロフェッショナルで、対応力も抜群でした。ユーザーフレンドリーなウェブサイトにより、業界レポートへのアクセスもスムーズでした。信頼性の高い高品質な調査サービスをお探しなら、Insight Partnersを強くお勧めします。
安達幸彦 最高経営責任者(CEO), ディープブルーLLC。The Insight Partnersから市場レポートを購入するのは今回が初めてです。最初は不安でしたが、ウェブサイトを見て、リスクを負ってでも購入してみようという気持ちになりました。レポートの品質とカスタマーサービスには大変満足しています。最初のレポートにはいくつか質問やコメントがありましたが、アナリストとメールで何度かやり取りした結果、戦略策定プロセスへのインプットとして活用できるレポートが完成しました。貴重なお時間を割いていただき、貴重な体験をさせていただき、誠にありがとうございました。他の方にもぜひお勧めしたいですし、今後さらに市場データが必要になった際には、まずThe Insight Partnersにご連絡させていただきます。
ジョン・スズキ 社長兼最高経営責任者、取締役, BKテクノロジーズナイジェリアの感染症IVD市場に関する情報提供依頼に対し、ご対応いただいた際、ご尽力とプロフェッショナルな姿勢に深く感謝申し上げます。忍耐強く、的確なアドバイスをいただき、また、最終的に取引成立に至った割引のご提供にも深く感謝申し上げます。今回の最初の出会いで得た強い印象のおかげで、今後もThe Insight Partnersとの連携を心待ちにしております。
チジオケ博士 オニア マネージングディレクター, パインクレストヘルスケア株式会社購入理由
- 情報に基づいた意思決定
- 市場動向の理解
- 競合分析
- 顧客インサイト
- 市場予測
- リスク軽減
- 戦略計画
- 投資の正当性
- 新興市場の特定
- マーケティング戦略の強化
- 業務効率の向上
- 規制動向への対応


 無料サンプルを入手 - フォトニック設計自動化市場