日射計市場の概要、成長、傾向、分析、調査レポート(2022-2030)
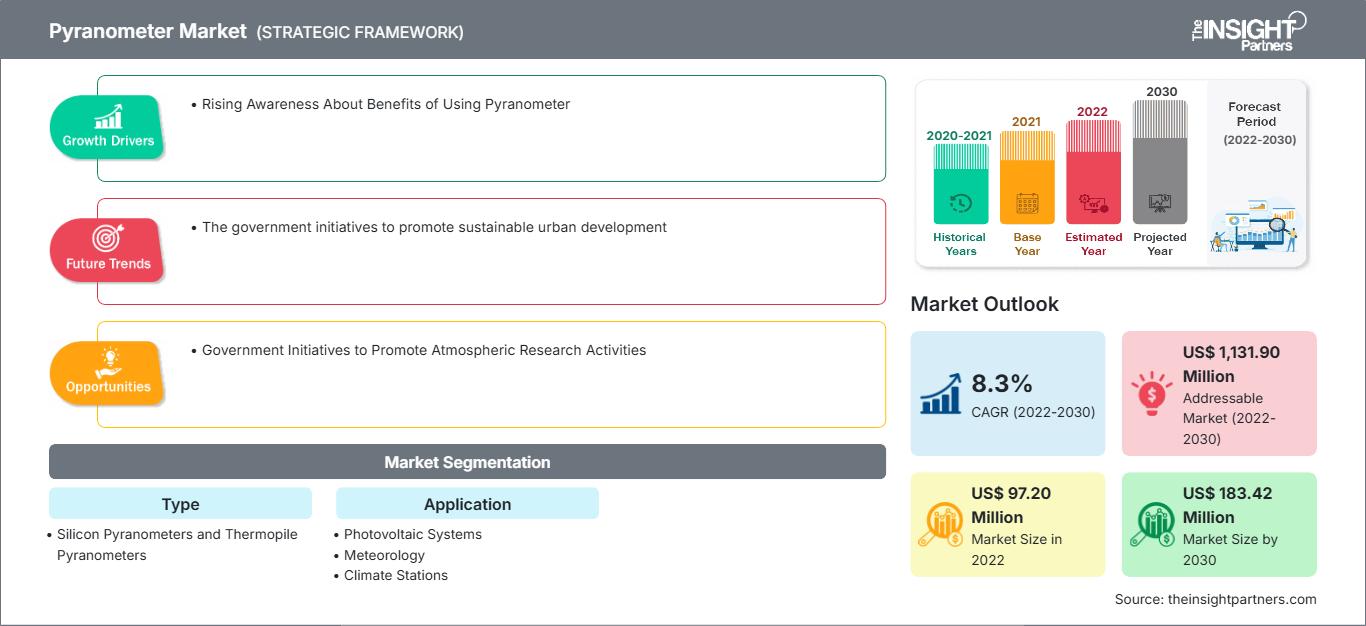
過去データ : 2020-2021 | 基準年 : 2022 | 予測期間 : 2022-2030全天日射計市場規模と予測(2020年 - 2030年)、世界および地域別シェア、トレンド、成長機会分析レポートの対象範囲:タイプ別(シリコン全天日射計およびサーモパイル全天日射計)およびアプリケーション別(太陽光発電システム、気象観測所、気候観測所)、および地理別
- ステータス : 出版
- レポートコード : TIPEL00002421
- カテゴリー : エレクトロニクスおよび半導体
- ページ数 : 141
- 利用可能なレポート形式 :


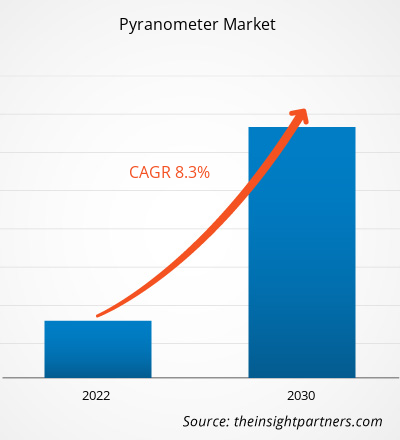
日射計市場規模は、2022年の9,720万米ドルから2030年には1億8,342万米ドルに拡大すると予想されており、2022年から2030年にかけて8.3%のCAGR(年平均成長率)を記録すると推定されています。持続可能な都市開発を促進するための政府の取り組みは、引き続き市場の主要なトレンドとなるでしょう。
日射計市場分析
日射計の使用によるメリットに対する認識の高まりと、太陽光発電システム、気象学、気候学、農業分野における日射計の用途拡大が、日射計市場規模の拡大を牽引しています。さらに、新しい太陽光発電所を建設するための政府の取り組みは、今後数年間の市場成長に有利な成長機会をもたらすと予想されています。技術革新への関心の高まりは、予測期間中、日射計市場のトレンドとなることが予想されます。
日射計市場概要
日射計は、一般的に気候学研究、気象観測網や温室における気象観測所の性能監視、ビルオートメーション、反射率研究、耐候性試験などに用いられる日射量測定装置です。日射計は、太陽エネルギーシステムにとって重要な入力となる太陽放射を測定します。発電、暖房、冷房における太陽エネルギーの利用増加が、日射計の需要を押し上げています。さらに、日射計は太陽放射を測定することで気象情報を取得するためにも使用されます。このデータを用いて、気候変動、気象パターン、その他の環境問題も研究されています。日射計は、建物の日射量を評価するのに使用され、これはエネルギー効率の高い建物の設計に重要です。持続可能な建物設計への関心の高まりが、日射計の需要を押し上げています。さらに、日射計は、環境モニタリング、調査研究、品質管理など、様々な用途にも使用されています。
要件に合わせてレポートをカスタマイズ
レポートの一部、国レベルの分析、Excelデータパックなどを含め、スタートアップ&大学向けに特別オファーや割引もご利用いただけます(無償)
日射計市場: 戦略的洞察
-
このレポートの主要な市場動向を入手してください。この無料サンプルには、市場動向から見積もりや予測に至るまでのデータ分析が含まれます。
日射計市場の推進要因と機会
市場を有利にするために日射計を使用する利点についての認識の高まり
日射計は、太陽放射を測定するために使用される放射照度センサーです。日射計は主に太陽光発電、気象学、農業に使用されます。太陽光発電では、日射計は太陽電池パネルが受ける太陽放射量を監視するために使用されます。これは、PVシステムの設計と太陽光発電所の連続運転に不可欠です。日射計は、太陽光発電所の運営者がプラントのパフォーマンス比率をリアルタイムで定量化することをサポートします。気象学では、日射計は一般的に気象観測所に設置され、地表で受信する太陽放射量を測定しさらに、農業では、日射計は作物が吸収する太陽放射の量を監視することで、農家が作物の発育を最大化し生産量を推定し、作物の病害状態を評価し、灌漑を最適化することを可能にしています。したがって、さまざまな目的で日射計を使用するこれらのすべての利点により、日射計の需要が高まり、日射計市場の成長が促進されます。
大気研究活動を促進する政府の取り組み
日射計は、雲量、大気汚染、太陽放射など、地表に到達する太陽エネルギーを変える可能性のある大気変数を研究者が調査するのに役立ちます。大気調査プロセス中にデータを収集できます。このデータは、太陽放射レベルを予測するための天気予報モデルでさらに利用され、屋外活動やエネルギー計画に役立ちます。大気汚染の増加は、政府が大気研究活動を促進する重要なイニシアチブを取ることを促し、それが市場に機会を生み出すと期待されます。たとえば、2023年7月の国立大気科学センター、航空機搭載大気測定施設(FAAM)航空機搭載実験室のデータによると、2023年9月、国立大気科学センターはデジタル航空研究技術センターで持続可能な航空機搭載研究および大気科学シンポジウムを主催しました。 このプログラムは、航空機搭載研究と革新の利点に関連する航空業界をサポートしています。 気候変動、危険な天候、大気汚染などの環境問題の責任ある解決に貢献します。 航空機搭載研究と革新の成長により、大気を監視するための全天日射計の需要が高まり、予測期間中に市場の成長機会が生まれます。
全天日射計市場レポートのセグメンテーション分析
全天日射計市場分析の導出に貢献した主要なセグメントは、タイプとアプリケーションです。
- タイプに基づいて、全天日射計市場はシリコン全天日射計とサーモパイル全天日射計に分けられます。シリコン製日射計セグメントは、予測期間中に大幅な成長が見込まれています。
- 用途別に見ると、市場は太陽光発電システム、気象観測、気象観測所の3つに分類されています。太陽光発電システムセグメントは、2022年に大きな市場シェアを占めました。
地域別日射計市場シェア分析
日射計市場レポートの地理的範囲は、主に北米、アジア太平洋、ヨーロッパ、中東・アフリカ、中南米の5つの地域に分かれています。
北米は、日射計市場で大きな成長を遂げています。日射計は、太陽エネルギー産業において、日射量の測定や太陽光発電の稼働状況の監視に利用されています。再生可能エネルギー発電のためのPV設備の急速な増加に伴い、日射計の採用が増加しています。太陽光発電所の効率は、太陽光発電所の実際の発電量と、日射計の測定値に基づく予測出力を比較することで評価できます。国立再生可能エネルギー研究所によると、アナリストは2023年の年間設置量が300GWを超え、2050年までに400GW以上を記録すると予測しています。2022年には、米国の新規発電容量に占める太陽光発電(PV)の割合は約46%で、2010年の4%から増加しました。2022年の夏季純発電容量はわずか9%、年間発電量は4.7%でした。さらに、2021年には、ネブラスカ大学リンカーン校自然資源学部の州気候局が、他州の研究グレード機器向けの気象観測所センサー校正サービスを開始しました。これにより、日射計の需要が高まり、日射計の需要増加が最終的に市場の成長を促進する可能性があります。
日射計市場の地域別分析
予測期間を通じて日射計市場に影響を与える地域的な傾向と要因については、The Insight Partnersのアナリストが詳細に解説しています。このセクションでは、北米、ヨーロッパ、アジア太平洋、中東・アフリカ、中南米における日射計市場のセグメントと地域についても解説しています。
日射計市場レポートの範囲
| レポート属性 | 詳細 |
|---|---|
| の市場規模 2022 | US$ 97.20 Million |
| 市場規模別 2030 | US$ 183.42 Million |
| 世界的なCAGR (2022 - 2030) | 8.3% |
| 過去データ | 2020-2021 |
| 予測期間 | 2022-2030 |
| 対象セグメント |
By タイプ
|
| 対象地域と国 |
北米
|
| 市場リーダーと主要企業の概要 |
|
日射計市場のプレーヤー密度:ビジネスダイナミクスへの影響を理解する
日射計市場は、消費者の嗜好の変化、技術の進歩、製品の利点に対する認知度の高まりといった要因によるエンドユーザーの需要増加に牽引され、急速に成長しています。需要の増加に伴い、企業は製品ラインナップの拡充、消費者ニーズへの対応、新たなトレンドの活用を進めており、これが市場の成長をさらに加速させています。
- 入手 日射計市場 主要プレーヤーの概要
日射計市場のニュースと最新動向
日射計市場は、主要な企業出版物、協会データ、データベースなどの一次調査および二次調査を経て、定性および定量データを収集することで評価されます。日射計市場におけるいくつかの動向を以下に示します。
- Delta OHM SrIは、太陽放射測定をより高度なレベルに引き上げる新しい日射計シリーズ、PYRAsenseを発売しました。モデルに応じて、ISO 9060:2018およびWMOの推奨事項に従って、PYRAsense10-スペクトルフラットクラスA、PYRAsense02-スペクトルフラットクラスB、およびPYRAsense03-スペクトルフラットクラスCに分類されます。(出典:Delta OHM SrI、企業ウェブサイト、2023年6月)。
- 2023年1月、EKO InstrumentsのMS-80SH全天日射計は、PV Magazineの2022 Awardsでシステムバランス(BOS)部門の最優秀賞を受賞しました。高効率のドーム加熱システムや5年ごとの校正間隔などの高度な機能は、進化する全天日射計市場における精度と持続可能性の重視を浮き彫りにしています。(出典:EKO Instruments、企業ウェブサイト、2023年1月)。
- 2022年8月、EKO Instrumentsは、クラスA全天日射計のMS-80シリーズの最新製品であるMS-80SHを発表しました。この革新的な日射計は、結露や霜に耐えるよう設計されたドーム型加熱システムを内蔵しており、太陽光発電システムの監視や科学研究における性能を向上させます。業界をリードする効率を誇り、消費電力は1.4W未満です。EKO Instrumentsは、この高度なセンサーによって太陽光発電システムの精度と全体的な価値の向上に努めています。(出典:EKO Instruments、企業ウェブサイト、2022年8月)。
日射計市場レポートの対象範囲と成果物
「日射計市場規模と予測(2020~2030年)」このレポートでは、以下の分野を網羅した市場の詳細な分析を提供しています。
- 調査対象となるすべての主要市場セグメントの世界、地域、国レベルでの日射計市場規模と予測
- 日射計市場の動向、および推進要因、制約、主要な機会などの市場動向
- 詳細なPEST / Porterの5つの力とSWOT分析
- 主要な市場動向、世界および地域の枠組み、主要プレーヤー、規制、および最近の市場動向を網羅した日射計市場分析
- 市場集中、ヒートマップ分析、主要プレーヤー、および日射計市場の最近の動向を網羅した業界の状況と競争分析
- 詳細な企業プロファイル

Naveenは、カスタム、シンジケート、コンサルティングの各プロジェクトにおいて9年以上の実績を持つ、経験豊富な市場調査およびコンサルティングのプロフェッショナルです。現在はアソシエイトバイスプレジデントを務め、プロジェクトバリューチェーン全体にわたるステークホルダー管理を成功させ、100件以上の調査レポートと30件以上のコンサルティング案件を執筆しています。産業および政府機関のプロジェクトに幅広く携わり、クライアントの成功とデータに基づく意思決定に大きく貢献しています。
Naveenは、カルナータカ州VTUで電子通信工学の学位を取得し、マニパル大学でマーケティング&オペレーションズのMBAを取得しています。IEEEの会員として9年間活動し、会議や技術シンポジウムへの参加、セクションレベルおよび地域レベルでのボランティア活動に積極的に取り組んでいます。現職以前は、IndustryARCでアソシエイト戦略コンサルタント、Hewlett Packard(HP Global)で産業用サーバーコンサルタントを務めていました。
- 過去2年間の分析、基準年、CAGRによる予測(7年間)
- PEST分析とSWOT分析
- 市場規模価値/数量 - 世界、地域、国
- 業界と競争環境
- Excel データセット
お客様の声
Insight PartnersのSCADAシステム市場レポートは包括的で、現在のトレンドと将来の予測に関する貴重な洞察が含まれています。チームは終始、非常にプロフェッショナルで、対応が早く、サポートも充実していました。私たちは彼らのサービスに非常に満足しており、強くお勧めします。
ラン・ケデム パートナー, レアリテクノロジーズ株式会社非常に特殊なソフトウェア市場に関するレポートを依頼したところ、チームは数日でレポートを作成してくれました。情報は非常に関連性が高く、分かりやすくまとめられていました。その後、レポートにいくつか修正と追加を依頼しましたが、チームは非常に迅速に対応し、1週間も経たないうちに最終レポートを受け取ることができました。
ジャン=エルヴェ・ジェン 会長, フューチャー・アナリティカ重要な市場調査と予測のために、The Insight Partnersと協力しました。彼らは機会とリスクに関する明確な洞察を提供し、私たちの計画策定に役立ちました。彼らの調査は使いやすく、確かなデータに基づいており、賢明で自信に満ちた意思決定に役立ちました。彼らを強くお勧めします。
ピユーシュ・ナグパル 上級副社長, ハイビームグローバルInsight Partnersは、深い専門知識に基づき、洞察力に富み、構造化された市場調査を提供しました。チームは終始プロフェッショナルで、対応力も抜群でした。ユーザーフレンドリーなウェブサイトにより、業界レポートへのアクセスもスムーズでした。信頼性の高い高品質な調査サービスをお探しなら、Insight Partnersを強くお勧めします。
安達幸彦 最高経営責任者(CEO), ディープブルーLLC。The Insight Partnersから市場レポートを購入するのは今回が初めてです。最初は不安でしたが、ウェブサイトを見て、リスクを負ってでも購入してみようという気持ちになりました。レポートの品質とカスタマーサービスには大変満足しています。最初のレポートにはいくつか質問やコメントがありましたが、アナリストとメールで何度かやり取りした結果、戦略策定プロセスへのインプットとして活用できるレポートが完成しました。貴重なお時間を割いていただき、貴重な体験をさせていただき、誠にありがとうございました。他の方にもぜひお勧めしたいですし、今後さらに市場データが必要になった際には、まずThe Insight Partnersにご連絡させていただきます。
ジョン・スズキ 社長兼最高経営責任者、取締役, BKテクノロジーズナイジェリアの感染症IVD市場に関する情報提供依頼に対し、ご対応いただいた際、ご尽力とプロフェッショナルな姿勢に深く感謝申し上げます。忍耐強く、的確なアドバイスをいただき、また、最終的に取引成立に至った割引のご提供にも深く感謝申し上げます。今回の最初の出会いで得た強い印象のおかげで、今後もThe Insight Partnersとの連携を心待ちにしております。
チジオケ博士 オニア マネージングディレクター, パインクレストヘルスケア株式会社購入理由
- 情報に基づいた意思決定
- 市場動向の理解
- 競合分析
- 顧客インサイト
- 市場予測
- リスク軽減
- 戦略計画
- 投資の正当性
- 新興市場の特定
- マーケティング戦略の強化
- 業務効率の向上
- 規制動向への対応


 無料サンプルを入手 - 日射計市場