일사계 시장 개요, 성장, 동향, 분석, 연구 보고서(2022-2030)
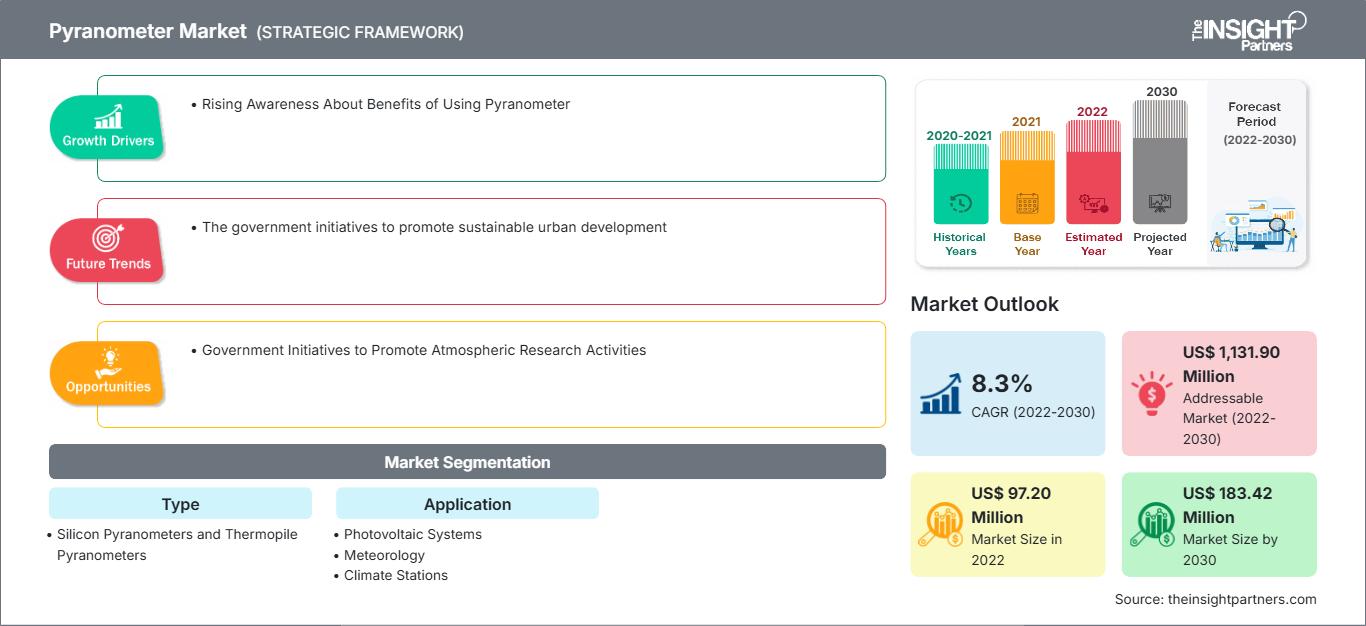
이전 데이터 : 2020-2021 | 기준 연도 : 2022 | 예측 기간 : 2022-2030파이라노미터 시장 규모 및 예측(2020-2030), 글로벌 및 지역별 점유율, 추세 및 성장 기회 분석 보고서 범위: 유형별(실리콘 파이라노미터 및 열전퇴 파이라노미터) 및 응용 분야별(태양광 시스템, 기상 및 기후 관측소), 지역별
- 상태 : 게시됨
- 보고서 코드 : TIPEL00002421
- 범주 : 전자 및 반도체
- 페이지 수 : 141
- 사용 가능한 보고서 형식 :


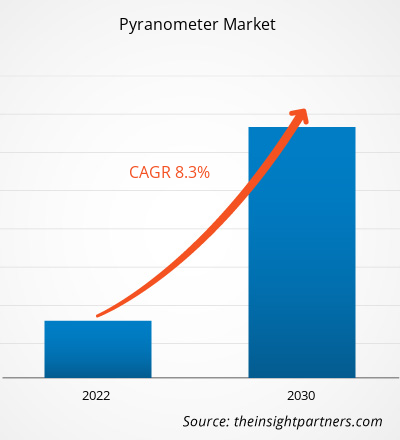
일사계 시장 규모는 2022년 9,720만 달러에서 2030년 1억 8,342만 달러로 성장할 것으로 예상되며, 2022년부터 2030년까지 연평균 성장률 8.3%를 기록할 것으로 예상됩니다. 지속 가능한 도시 개발을 촉진하기 위한 정부 정책은 시장의 주요 트렌드로 남을 것으로 보입니다.
일사계 시장 분석
일사계 사용의 이점에 대한 인식이 높아지고 태양광 시스템, 기상, 기후, 농업 분야에서 일사계 적용이 증가함에 따라 일사계 시장 규모도 확대되고 있습니다. 또한, 정부의 신규 태양광 발전소 건설 정책은 향후 시장 성장에 수익성 있는 성장 기회를 제공할 것으로 예상됩니다. 기술 발전에 대한 관심이 증가함에 따라 예측 기간 동안 일사계 시장이 트렌드를 보일 것으로 예상됩니다.
일사계 시장 개요
일사계는 일반적으로 기후 연구 또는 기상망 및 온실 내 기상 관측소 성능 모니터링, 건물 자동화, 반사율 연구, 풍화 작용 등에 사용되는 태양 복사 측정 장치입니다. 일사계는 태양 에너지 시스템의 중요한 입력 요소인 태양 복사량을 측정합니다. 발전, 난방 및 냉방에 태양 에너지 사용이 증가함에 따라 일사계 수요가 증가하고 있습니다. 또한, 일사계는 태양 복사량을 측정하여 기상 정보를 얻는 데 사용됩니다. 기후 변화, 기상 패턴 및 기타 환경 문제도 이 데이터를 사용하여 연구됩니다. 일사계는 건물의 일사량 측정에 사용되며, 이는 에너지 효율적인 건물 설계에 중요합니다. 지속 가능한 건물 설계에 대한 관심이 증가함에 따라 일사계 수요가 증가하고 있습니다. 또한, 파이라노미터는 환경 모니터링, 연구, 품질 관리 등 다양한 다른 응용 분야에서도 사용됩니다.
요구 사항에 맞게 이 보고서를 사용자 정의하십시오.
이 보고서의 일부, 국가 수준 분석, Excel 데이터 팩을 포함하여 모든 보고서에 대한 사용자 정의를 무료로 받을 수 있을 뿐만 아니라 스타트업 및 대학을 위한 훌륭한 제안 및 할인을 이용할 수 있습니다
피라노미터 마켓: 전략적 통찰력
-
이 보고서의 주요 주요 시장 동향을 확인하세요.이 무료 샘플에는 시장 동향부터 추정 및 예측에 이르기까지 데이터 분석이 포함됩니다.
일사계 시장 성장 동력 및 기회
일사계 사용의 이점에 대한 인식 제고로 시장 활성화
일사계는 태양 복사량 측정에 사용되는 조도 센서입니다. 일사계는 주로 태양 에너지 생산, 기상학, 농업에 사용됩니다. 태양 에너지 생산에서 일사계는 태양광 패널이 받는 태양 복사량을 모니터링하는 데 사용되며, 이는 태양광 발전 시스템 설계 및 모든 태양광 발전소의 연속 운영에 매우 중요합니다. 일사계는 태양광 발전소 운영자가 발전소 성능 비율을 실시간으로 정량화할 수 있도록 지원합니다. 기상학에서 일사계는 일반적으로 기상 관측소에 설치되어 지표면에서 받는 입사 태양 복사량을 측정합니다. 지표면에서 반사되는 태양 복사량은 기후 조건과 지구 단파 에너지 균형을 이해하는 데 중요한 매개변수입니다. 또한 농업 분야에서 일사계는 작물이 흡수하는 태양 복사량을 모니터링하여 농부들이 작물 생장을 극대화하고 생산량을 예측하며, 작물 병충해 상태를 평가하고 관개를 최적화할 수 있도록 지원합니다. 따라서 다양한 용도로 사용되는 일사계는 이러한 모든 이점을 통해 수요를 증가시키고, 이는 일사계 시장 성장을 촉진합니다.
대기 연구 활동 촉진을 위한 정부 정책
일사계는 연구자들이 구름량, 대기 오염, 태양 복사 등 지구 표면에 도달하는 태양 에너지를 변화시킬 수 있는 대기 변수를 조사하는 데 도움을 줍니다. 대기 조사 과정에서 데이터를 수집할 수 있습니다. 이 데이터는 기상 예측 모델에서 태양 복사량을 예측하는 데 활용되며, 이는 야외 활동 및 에너지 계획에 유용합니다. 오염 증가는 정부가 대기 연구 활동을 촉진하는 중요한 정책을 추진하도록 장려하고 있으며, 이는 시장 기회를 창출할 것으로 예상됩니다. 예를 들어, 국립 대기과학센터(National Centre for Atmospheric Science)의 2023년 7월 자료에 따르면, 2023년 9월, 국립 대기과학센터는 디지털 항공 연구 기술 센터에서 지속 가능한 항공 연구 및 대기 과학 심포지엄을 개최했습니다. 이 프로그램은 항공 연구 및 혁신의 이점과 관련하여 항공 산업을 지원하며, 기후 변화, 악천후, 대기 오염과 같은 환경 문제의 책임 있는 해결에 기여합니다. 항공 연구 및 혁신의 성장은 대기 모니터링을 위한 일사계에 대한 수요를 증가시켜 예측 기간 동안 시장의 성장 기회를 창출합니다.
일사계 시장 보고서 세분화 분석
일사계 시장 분석 도출에 기여한 주요 부문은 유형과 응용 분야입니다.
- 일사계 시장은 유형에 따라 실리콘 일사계와 열전퇴 일사계로 구분됩니다. 실리콘 일사계 부문은 예측 기간 동안 상당한 속도로 확장될 것으로 예상됩니다.
- 응용 분야 측면에서 시장은 태양광 시스템, 기상 관측소, 기상 관측소로 세분화됩니다. 태양광 시스템 부문은 2022년에 더 큰 시장 점유율을 차지했습니다.
지역별 일사계 시장 점유율 분석
일사계 시장 보고서의 지리적 범위는 주로 북미, 아시아 태평양, 유럽, 중동 및 기타 5개 지역으로 나뉩니다. 아프리카, 남미 및 중미.
북미는 일사계 시장에서 상당한 성장을 경험하고 있습니다. 일사계는 태양 에너지 산업에서 태양 복사량을 측정하거나 태양광 발전 시스템의 작동을 모니터링하는 데 사용됩니다. 재생에너지 발전을 위한 태양광 발전 설비의 급속한 성장으로 일사계 도입이 증가하고 있습니다. 태양광 발전소의 효율은 태양광 발전소의 실제 발전량과 일사계 측정값을 기반으로 한 예상 출력을 비교하여 평가할 수 있습니다. 미국 국립재생에너지연구소(NREL)에 따르면, 분석가들은 2023년 연간 설치량이 300GW를 넘어설 것으로 예상하고 있으며, 2050년에는 400GW를 넘어설 것으로 예상합니다. 2022년 태양광 발전은 미국 신규 발전 용량의 약 46%를 차지했는데, 이는 2010년 4%에 비해 증가한 수치입니다. 태양광 발전은 2022년 여름 순 용량의 9%, 연간 발전량의 4.7%에 불과했습니다. 또한, 2021년 네브래스카-링컨 대학교 자연자원대학 산하 주 기후 사무소는 다른 주의 연구용 장비에 대한 기상 관측소 센서 교정 서비스를 제공하기 시작했습니다. 이는 일사계 수요 증가로 이어질 수 있으며, 이러한 수요 증가는 궁극적으로 시장 성장을 촉진할 수 있습니다.
피라노미터 시장 지역별 통찰력
The Insight Partners의 분석가들은 예측 기간 동안 피라노미터 시장에 영향을 미치는 지역별 동향과 요인들을 면밀히 설명했습니다. 이 섹션에서는 북미, 유럽, 아시아 태평양, 중동 및 아프리카, 그리고 중남미 지역의 피라노미터 시장 세분화 및 지역별 분포도 살펴봅니다.
피라노미터 시장 보고서 범위
| 보고서 속성 | 세부 |
|---|---|
| 시장 규모 2022 | US$ 97.20 Million |
| 시장규모별 2030 | US$ 183.42 Million |
| 글로벌 CAGR (2022 - 2030) | 8.3% |
| 이전 데이터 | 2020-2021 |
| 예측 기간 | 2022-2030 |
| 다루는 세그먼트 |
By 유형
|
| 포함된 지역 및 국가 |
북미
|
| 시장 선도 기업 및 주요 회사 프로필 |
|
피라노미터 시장 참여자 밀도: 비즈니스 역학에 미치는 영향 이해
피라노미터 시장은 소비자 선호도 변화, 기술 발전, 그리고 제품 효능에 대한 인식 제고 등의 요인으로 인한 최종 사용자 수요 증가에 힘입어 빠르게 성장하고 있습니다. 수요가 증가함에 따라 기업들은 제품 라인업을 확장하고, 소비자 니즈를 충족하기 위한 혁신을 추진하며, 새로운 트렌드를 적극 활용하고 있으며, 이는 시장 성장을 더욱 가속화하고 있습니다.
- 을 얻으세요 피라노미터 마켓 주요 주요 플레이어 개요
일사계 시장 뉴스 및 최근 동향
일사계 시장은 1차 및 2차 조사 후 주요 기업 간행물, 협회 데이터, 데이터베이스 등 정성적 및 정량적 데이터를 수집하여 평가합니다. 일사계 시장의 몇 가지 동향은 다음과 같습니다.
- Delta OHM SrI는 태양 복사 측정을 한 단계 더 발전시킨 새로운 일사계 제품군인 PYRAsense를 출시했습니다. 모델에 따라 ISO 9060:2018 및 WMO 권장 사항에 따라 PYRAsense10-Spectrally Flat Class A, PYRAsense02-Spectrally Flat Class B, PYRAsense03-Spectrally Flat Class C로 분류됩니다. (출처: Delta OHM SrI, 회사 웹사이트, 2023년 6월).
- 2023년 1월, EKO Instruments의 MS-80SH 일사계는 PV Magazine의 2022 Awards에서 시스템 균형(BOS) 부문에서 최고상을 수상했습니다. 고효율 돔 가열 시스템과 5년 교정 간격을 포함한 고급 기능은 정밀성과 지속가능성을 중시하는 변화하는 일사계 시장을 잘 보여줍니다. (출처: EKO Instruments, 회사 웹사이트, 2023년 1월).
- 2022년 8월, EKO Instruments는 Class A 일사계 MS-80 시리즈의 최신 제품인 MS-80SH를 출시했습니다. 이 혁신적인 일사계는 이슬과 서리를 방지하도록 설계된 통합 돔 가열 시스템을 갖추고 있어 태양광 시스템 모니터링 및 과학 연구 성능을 향상시킵니다. 이 장치는 1.4W 미만의 낮은 전력 소비로 업계 최고의 효율을 자랑합니다. EKO Instruments는 이 첨단 센서를 통해 태양광 시스템의 정확도와 전반적인 가치를 지속적으로 향상시키고 있습니다. (출처: EKO Instruments, 회사 웹사이트, 2022년 8월)
일사계 시장 보고서 범위 및 결과
“일사계 시장 규모 및 예측(2020~2030)” 보고서는 다음 영역을 포괄하는 시장에 대한 자세한 분석을 제공합니다.
- 범위에 포함된 모든 주요 시장 부문에 대한 글로벌, 지역 및 국가 수준의 일사계 시장 규모 및 예측
- 동력, 제약 및 주요 기회와 같은 일사계 시장 동향 및 시장 역학
- 자세한 PEST/포터의 5가지 힘 및 SWOT 분석
- 주요 시장 동향, 글로벌 및 지역 프레임워크, 주요 업체, 규정 및 최근 시장 동향을 포괄하는 일사계 시장 분석
- 시장 집중도, 히트맵 분석, 주요 업체 및 일사계 시장의 최근 동향을 포괄하는 산업 환경 및 경쟁 분석
- 자세한 회사 프로필

나빈은 맞춤형, 신디케이트 및 컨설팅 프로젝트 전반에 걸쳐 9년 이상의 전문 지식을 보유한 시장 조사 및 컨설팅 전문가입니다. 현재 부사장으로 재직 중이며, 프로젝트 가치 사슬 전반의 이해관계자들을 성공적으로 관리해 왔으며, 100편 이상의 연구 보고서와 30건 이상의 컨설팅 업무를 수행했습니다. 그는 산업 및 정부 프로젝트 전반에 걸쳐 다양한 업무를 수행하며 고객 성공과 데이터 기반 의사 결정에 크게 기여하고 있습니다.
나빈은 카르나타카주 VTU에서 전자통신 공학 학위를, 마니팔 대학교에서 마케팅 및 운영 MBA를 취득했습니다. 그는 9년 동안 IEEE 회원으로 활발하게 활동하며 컨퍼런스, 기술 심포지엄에 참여하고 지역 및 지역 차원에서 자원봉사 활동을 해왔습니다. 현재 직책을 맡기 전에는 IndustryARC에서 준전략 컨설턴트로, 휴렛팩커드(HP Global)에서 산업용 서버 컨설턴트로 근무했습니다.
- 과거 분석(2년), 기준 연도, CAGR을 포함한 예측(7년)
- PEST 및 SWOT 분석
- 시장 규모 가치/거래량 - 글로벌, 지역, 국가
- 산업 및 경쟁 환경
- Excel 데이터세트
사용 후기
Insight Partners의 SCADA 시스템 시장 보고서는 포괄적이며, 현재 동향과 미래 전망에 대한 귀중한 통찰력을 제공합니다. 팀은 매우 전문적이고, 신속하게 대응하며, 처음부터 끝까지 지원해 주었습니다. 저희는 매우 만족하며 Insight Partners의 서비스를 적극 추천합니다.
란 케뎀 파트너, Reali Technologies LTDs아주 구체적인 소프트웨어 시장에 대한 보고서를 요청했는데, 팀에서 며칠 만에 보고서를 작성해 주셨습니다. 정보는 매우 관련성이 높고 잘 정리되어 있었습니다. 그 후 보고서에 몇 가지 수정과 추가 사항을 요청했습니다. 팀원들의 응답도 매우 빨랐고, 일주일도 채 되지 않아 최종 보고서를 받았습니다.
장-에르브 젠 의장, 퓨처 애널리티카The Insight Partners와 함께 중요한 시장 조사 및 예측 작업을 진행했습니다. Insight Partners는 기회와 위험에 대한 명확한 통찰력을 제공하여 계획을 세우는 데 큰 도움이 되었습니다. The Insight Partners의 조사는 사용하기 쉬웠고, 탄탄한 데이터를 기반으로 했습니다. 덕분에 현명하고 자신 있는 결정을 내릴 수 있었습니다. The Insight Partners를 강력 추천합니다.
피유시 나그팔 수석 부사장, 하이빔 글로벌Insight Partners는 탄탄한 분야 전문성을 바탕으로 통찰력 있고 체계적인 시장 조사를 제공했습니다. Insight Partners 팀은 처음부터 끝까지 전문적이고 신속하게 대응했습니다. 사용자 친화적인 웹사이트 덕분에 업계 보고서에 쉽게 접근할 수 있었습니다. 신뢰할 수 있고 고품질의 조사 서비스를 원하신다면 Insight Partners를 강력 추천합니다.
아다치 유키히코 대표이사, 딥블루 주식회사The Insight Partners에서 시장 보고서를 구매한 것은 이번이 처음입니다. 처음에는 확신이 없었지만, 웹사이트를 방문하고 나서 위험을 감수하고 시장 보고서를 구매하는 것이 더 편하다는 것을 알게 되었습니다. 보고서의 품질과 고객 서비스에 매우 만족합니다. 처음 보고서를 보고 몇 가지 질문과 의견이 있었지만, 분석가와 이메일로 몇 차례 대화를 나눈 후, 전략 기획 과정에 참고할 수 있는 보고서를 확보했다고 생각합니다. 시간을 내어 긍정적인 경험을 선사해 주셔서 정말 감사합니다. 다른 사람들에게도 귀사의 서비스를 적극 추천할 것이며, 추가적인 시장 데이터가 필요할 때면 가장 먼저 귀사에 연락하겠습니다.
존 스즈키 사장 겸 최고 경영자, 이사회 이사, BK 테크놀로지스나이지리아 감염성 질환 IVD 시장 관련 정보 요청에 응해 주신 귀사의 지원과 전문성에 감사드립니다. 귀사의 인내심과 지도, 그리고 할인 혜택을 기꺼이 제공해 주셔서 결국 계약을 성사시킬 수 있었습니다. 첫 만남을 통해 귀사가 저에게 심어주신 좋은 인상을 바탕으로 앞으로도 The Insight Partners와 함께할 수 있기를 기대합니다.
치지오케 박사 오니아 전무이사, 파인크레스트 헬스케어 유한회사구매 이유
- 정보에 기반한 의사 결정
- 시장 역학 이해
- 경쟁 분석
- 고객 인사이트
- 시장 예측
- 위험 완화
- 전략 기획
- 투자 타당성 분석
- 신흥 시장 파악
- 마케팅 전략 강화
- 운영 효율성 향상
- 규제 동향에 발맞춰 대응


 무료 샘플 받기 - 피라노미터 마켓