Pyranometer-Marktübersicht, Wachstum, Trends, Analyse, Forschungsbericht (2022-2030)
Historische Daten : 2020-2021 | Basisjahr : 2022 | Prognosezeitraum : 2022-2030Marktgröße und Prognose für Pyranometer (2020 – 2030), Bericht über globale und regionale Anteile, Trends und Wachstumschancenanalyse: Nach Typ (Silizium-Pyranometer und Thermosäulen-Pyranometer) und Anwendung (Photovoltaiksysteme, Meteorologie und Klimastationen) sowie Geografie
- Status : Veröffentlicht
- Berichtscode : TIPEL00002421
- Kategorie : Elektronik und Halbleiter
- Anzahl der Seiten : 141
- Verfügbare Berichtsformate :


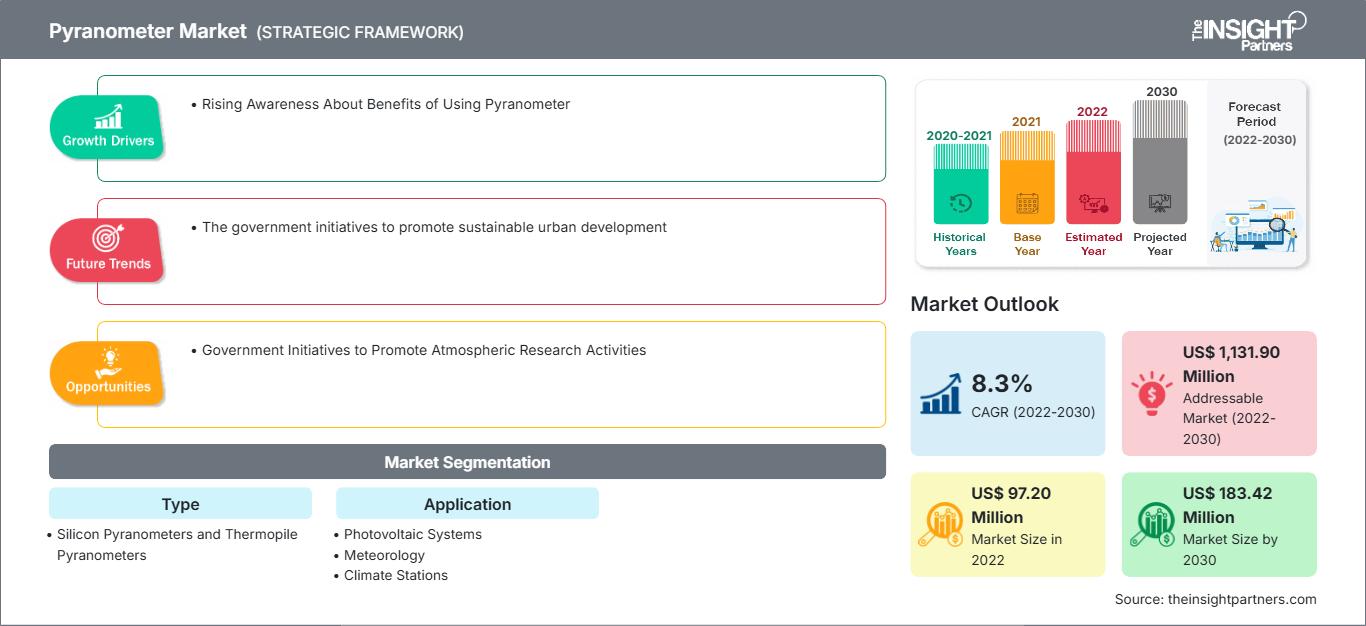
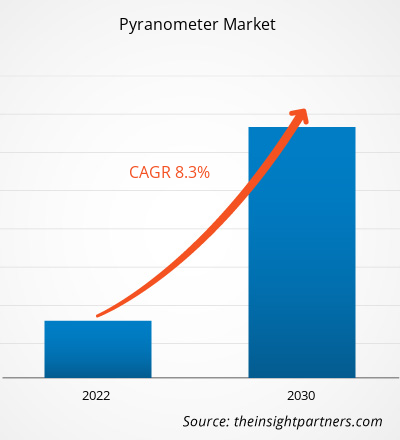
Der Pyranometer-Markt soll von 97,20 Millionen US-Dollar im Jahr 2022 auf 183,42 Millionen US-Dollar im Jahr 2030 wachsen; von 2022 bis 2030 wird eine durchschnittliche jährliche Wachstumsrate (CAGR) von 8,3 % erwartet. Die staatlichen Initiativen zur Förderung einer nachhaltigen Stadtentwicklung dürften weiterhin wichtige Markttrends bleiben.
Pyranometer-Marktanalyse
Das wachsende Bewusstsein für die Vorteile von Pyranometern und deren zunehmende Anwendung in Photovoltaikanlagen, der Meteorologie, Klimatologie und der Landwirtschaft treiben das Wachstum des Pyranometer-Marktes voran. Darüber hinaus dürften staatliche Initiativen zum Bau neuer Solarkraftwerke in den kommenden Jahren lukrative Wachstumschancen für das Marktwachstum bieten. Der zunehmende Fokus auf technologischen Fortschritt wird im Prognosezeitraum voraussichtlich ein Trend auf dem Pyranometermarkt sein.
Marktübersicht Pyranometer
Ein Pyranometer ist ein Gerät zur Messung der Sonneneinstrahlung, das im Allgemeinen in der Klimaforschung oder zur Überwachung der Leistung von Wetterstationen in meteorologischen Netzwerken und Gewächshäusern, der Gebäudeautomation, für Reflexionsstudien, Bewitterung usw. eingesetzt wird. Pyranometer messen die Sonnenstrahlung, einen wichtigen Input für Solarenergiesysteme. Die zunehmende Nutzung von Solarenergie zur Stromerzeugung, Heizung und Kühlung treibt die Nachfrage nach Pyranometern. Darüber hinaus werden Pyranometer verwendet, um durch Messung der Sonneneinstrahlung meteorologische Informationen zu gewinnen. Auch Klimawandel, Wettermuster und andere Umweltprobleme werden anhand dieser Daten untersucht. Pyranometer werden verwendet, um die Sonneneinstrahlung von Gebäuden zu beurteilen, was für die Planung energieeffizienter Gebäude wichtig ist. Der zunehmende Fokus auf nachhaltiges Gebäudedesign treibt die Nachfrage nach Pyranometern. Darüber hinaus werden Pyranometer auch in verschiedenen anderen Anwendungen eingesetzt, beispielsweise in der Umweltüberwachung, in Forschungsstudien und in der Qualitätskontrolle.
Passen Sie diesen Bericht Ihren Anforderungen an
Sie erhalten kostenlos Anpassungen an jedem Bericht, einschließlich Teilen dieses Berichts oder einer Analyse auf Länderebene, eines Excel-Datenpakets sowie tolle Angebote und Rabatte für Start-ups und Universitäten.
Pyranometer-Markt: Strategische Einblicke
-
Holen Sie sich die wichtigsten Markttrends aus diesem Bericht.Dieses KOSTENLOSE Beispiel umfasst Datenanalysen, die von Markttrends bis hin zu Schätzungen und Prognosen reichen.
Markttreiber und -chancen für Pyranometer
Steigendes Bewusstsein für die Vorteile des Pyranometereinsatzes zur Marktförderung
Ein Pyranometer ist ein Bestrahlungsstärkesensor zur Messung der Sonneneinstrahlung. Pyranometer werden hauptsächlich zur Solarenergieerzeugung, Meteorologie und Landwirtschaft eingesetzt. Bei der Solarenergieerzeugung überwachen Pyranometer die von Solarmodulen empfangene Sonnenstrahlungsmenge, was für die Auslegung von PV-Systemen und den Dauerbetrieb jedes Solarkraftwerks entscheidend ist. Pyranometer unterstützen Betreiber von Solaranlagen bei der Quantifizierung der Anlagenleistung in Echtzeit. In der Meteorologie werden Pyranometer üblicherweise an Wetterstationen installiert, um die Menge der auf die Erdoberfläche treffenden Sonnenstrahlung zu messen. Die vom Boden reflektierte Sonnenstrahlung ist ein entscheidender Parameter zum Verständnis der Klimabedingungen und der globalen Kurzwellenenergiebilanz. In der Landwirtschaft überwachen Pyranometer außerdem die von Nutzpflanzen absorbierte Sonnenstrahlungsmenge. So können Landwirte das Pflanzenwachstum maximieren, den Ertrag abschätzen, den Krankheitszustand der Pflanzen beurteilen und die Bewässerung optimieren. All diese Vorteile von Pyranometern für zahlreiche Zwecke erhöhen daher die Nachfrage nach Pyranometern, was das Wachstum des Pyranometermarktes ankurbelt.
Regierungsinitiativen zur Förderung der Atmosphärenforschung
Pyranometer helfen Forschern, atmosphärische Variablen wie Wolkendecke, Luftverschmutzung und Sonneneinstrahlung zu untersuchen, die die Sonnenenergie, die die Erdoberfläche erreicht, verändern können. Sie können während des Atmosphärenuntersuchungsprozesses Daten sammeln. Diese Daten werden weiter in Wettervorhersagemodellen verwendet, um die Sonneneinstrahlung vorherzusagen, was für Outdoor-Aktivitäten und Energieplanung nützlich ist. Die steigende Umweltverschmutzung ermutigt die Regierung, bedeutende Initiativen zur Förderung der Atmosphärenforschung zu ergreifen, was voraussichtlich Marktchancen schaffen wird. Beispielsweise veranstaltete das National Centre for Atmospheric Science im September 2023 laut Daten des National Centre for Atmospheric Science, Facility for Airborne Atmospheric Measurements (FAAM) Airborne Laboratory, im Digital Aviation Research and Technology Centre ein Symposium zu nachhaltiger luftgestützter Forschung und Atmosphärenwissenschaft. Dieses Programm unterstützt die Luftfahrtindustrie im Zusammenhang mit den Vorteilen luftgestützter Forschung und Innovation. Es trägt zur verantwortungsvollen Lösung von Umweltproblemen wie Klimawandel, gefährlichen Wetterbedingungen und Luftverschmutzung bei. Das Wachstum luftgestützter Forschung und Innovation erhöht die Nachfrage nach Pyranometern zur Überwachung der Atmosphäre und schafft im Prognosezeitraum Wachstumschancen für den Markt.
Segmentierungsanalyse des Pyranometer-Marktberichts
Schlüsselsegmente, die zur Ableitung der Pyranometer-Marktanalyse beigetragen haben, sind Typ und Anwendung.
- Basierend auf dem Typ ist der Pyranometer-Markt in Silizium-Pyranometer und Thermosäulen-Pyranometer unterteilt. Das Segment der Silizium-Pyranometer wird im Prognosezeitraum voraussichtlich stark wachsen.
- In Bezug auf die Anwendung ist der Markt in Photovoltaikanlagen, Meteorologie und Klimastationen segmentiert. Das Segment Photovoltaikanlagen hatte 2022 einen größeren Marktanteil.
Pyranometer-Marktanteilsanalyse nach Geografie
Der geografische Umfang des Pyranometer-Marktberichts ist hauptsächlich in fünf Regionen unterteilt: Nordamerika, Asien-Pazifik, Europa, Naher Osten und Afrika sowie Süd- und Mittelamerika.
Nordamerika erlebt ein signifikantes Wachstum auf dem Pyranometer-Markt. Pyranometer werden in der Solarenergiebranche eingesetzt, um die Sonneneinstrahlung zu messen oder den Betrieb der PV-Stromerzeugung zu überwachen. Die Einführung von Pyranometern nimmt aufgrund des schnellen Wachstums von PV-Installationen zur Stromerzeugung aus erneuerbaren Energien zu. Die Effizienz eines PV-Kraftwerks kann durch Vergleich der tatsächlichen Stromerzeugung eines PV-Kraftwerks mit der prognostizierten Leistung basierend auf einem Pyranometerwert beurteilt werden. Laut dem National Renewable Energy Laboratory prognostizieren Analysten, dass die jährlichen Installationen im Jahr 2023 300 GW übersteigen und bis 2050 mehr als 400 GW erreichen werden. Im Jahr 2022 machte Photovoltaik etwa 46 % der neuen Stromerzeugungskapazität in den USA aus, verglichen mit 4 % im Jahr 2010. Solarenergie stellte nur 9 % der Netto-Sommerkapazität und 4,7 % der jährlichen Erzeugung im Jahr 2022. Darüber hinaus begann das State Climate Office der School of Natural Resources der University of Nebraska-Lincoln im Jahr 2021, Kalibrierungsdienste für Wetterstationssensoren für Forschungsgeräte in anderen Bundesstaaten anzubieten. Dies kann die Nachfrage nach Pyranometern erhöhen, und die steigende Nachfrage nach Pyranometern kann letztendlich das Marktwachstum ankurbeln.
Pyranometer
Regionale Einblicke in den PyranometermarktDie Analysten von The Insight Partners haben die regionalen Trends und Faktoren, die den Pyranometer-Markt im Prognosezeitraum beeinflussen, ausführlich erläutert. In diesem Abschnitt werden auch die Marktsegmente und die geografische Lage in Nordamerika, Europa, dem asiatisch-pazifischen Raum, dem Nahen Osten und Afrika sowie Süd- und Mittelamerika erörtert.
Umfang des Pyranometer-Marktberichts
| Berichtsattribut | Einzelheiten |
|---|---|
| Marktgröße in 2022 | US$ 97.20 Million |
| Marktgröße nach 2030 | US$ 183.42 Million |
| Globale CAGR (2022 - 2030) | 8.3% |
| Historische Daten | 2020-2021 |
| Prognosezeitraum | 2022-2030 |
| Abgedeckte Segmente |
By Typ
|
| Abgedeckte Regionen und Länder |
Nordamerika
|
| Marktführer und wichtige Unternehmensprofile |
|
Dichte der Pyranometer-Marktakteure: Verständnis ihrer Auswirkungen auf die Geschäftsdynamik
Der Pyranometer-Markt wächst rasant, angetrieben durch die steigende Endverbrauchernachfrage aufgrund von Faktoren wie sich entwickelnden Verbraucherpräferenzen, technologischem Fortschritt und einem stärkeren Bewusstsein für die Produktvorteile. Mit steigender Nachfrage erweitern Unternehmen ihr Angebot, entwickeln Innovationen, um den Verbraucherbedürfnissen gerecht zu werden, und nutzen neue Trends, was das Marktwachstum weiter ankurbelt.
- Holen Sie sich die Pyranometer-Markt Übersicht der wichtigsten Akteure
Neuigkeiten und aktuelle Entwicklungen zum Pyranometer-Markt
Der Pyranometer-Markt wird durch die Erhebung qualitativer und quantitativer Daten aus Primär- und Sekundärforschung bewertet, die wichtige Unternehmenspublikationen, Verbandsdaten und Datenbanken einbeziehen. Einige der Entwicklungen auf dem Pyranometer-Markt sind unten aufgeführt:
- Delta OHM SrI hat ein neues PYRAsense auf den Markt gebracht, eine neue Pyranometer-Familie, die die Messung der Sonneneinstrahlung auf ein höheres Niveau bringt. Je nach Modell und gemäß ISO 9060:2018 und den Empfehlungen der WMO werden sie als PYRAsense10-Spectrally Flat Class A, PYRAsense02-Spectrally Flat Class B und PYRAsense03-Spectrally Flat Class C klassifiziert. (Quelle: Delta OHM SrI, Unternehmenswebsite, Juni 2023).
- Im Januar 2023 sicherte sich das Pyranometer MS-80SH von EKO Instruments bei den 2022 Awards des PV Magazine die höchste Auszeichnung in der Kategorie Balance of System (BOS). Seine fortschrittlichen Funktionen, darunter ein hocheffizientes Kuppelheizsystem und ein 5-Jahres-Kalibrierungsintervall, unterstreichen den Schwerpunkt des sich entwickelnden Pyranometermarktes auf Präzision und Nachhaltigkeit. (Quelle: EKO Instruments, Unternehmenswebsite, Januar 2023).
- Im August 2022 stellte EKO Instruments das MS-80SH vor, die neueste Ergänzung seiner MS-80-Serie von Pyranometern der Klasse A. Dieses innovative Pyranometer verfügt über ein integriertes, tau- und frostbeständiges Kuppelheizsystem, das seine Leistung bei der Überwachung von Photovoltaikanlagen und in der wissenschaftlichen Forschung verbessert. Das Gerät zeichnet sich durch branchenführende Effizienz bei einem geringen Stromverbrauch von unter 1,4 W aus. EKO Instruments verbessert mit diesem fortschrittlichen Sensor weiterhin die Genauigkeit und den Gesamtwert von PV-Anlagen. (Quelle: EKO Instruments, Unternehmenswebsite, August 2022).
Bericht zum Pyranometer-Markt: Abdeckung und Ergebnisse
Der „Pyranometer-Markt: Größe und Prognose (2020–2030)“ Der Bericht bietet eine detaillierte Analyse des Marktes und deckt die folgenden Bereiche ab:
- Marktgröße und Prognose für Pyranometer auf globaler, regionaler und Länderebene für alle abgedeckten wichtigen Marktsegmente
- Markttrends und Marktdynamiken für Pyranometer wie Treiber, Einschränkungen und wichtige Chancen
- Detaillierte PEST/Porters Five Forces- und SWOT-Analyse
- Marktanalyse für Pyranometer mit wichtigen Markttrends, globalen und regionalen Rahmenbedingungen, wichtigen Akteuren, Vorschriften und aktuellen Marktentwicklungen
- Branchenlandschaft und Wettbewerbsanalyse mit Marktkonzentration, Heatmap-Analyse, prominenten Akteuren und aktuellen Entwicklungen für den Pyranometer-Markt
- Detaillierte Unternehmensprofile

Naveen ist ein erfahrener Marktforschungs- und Beratungsexperte mit über 9 Jahren Erfahrung in kundenspezifischen, syndizierten und Beratungsprojekten. In seiner aktuellen Funktion als Associate Vice President hat er erfolgreich Stakeholder entlang der gesamten Projektwertschöpfungskette gemanagt und ist Autor von über 100 Forschungsberichten und über 30 Beratungsaufträgen. Seine Arbeit erstreckt sich auf Industrie- und Regierungsprojekte und trägt maßgeblich zum Kundenerfolg und zur datengesteuerten Entscheidungsfindung bei.
Naveen hat einen Ingenieursabschluss in Elektronik und Kommunikation von der VTU, Karnataka, und einen MBA in Marketing und Operations von der Manipal University. Er ist seit 9 Jahren aktives IEEE-Mitglied und nimmt an Konferenzen und technischen Symposien teil und engagiert sich ehrenamtlich auf Sektions- und regionaler Ebene. Vor seiner aktuellen Position arbeitete er als Associate Strategic Consultant bei IndustryARC und als Industrial Server Consultant bei Hewlett Packard (HP Global).
- Historische Analyse (2 Jahre), Basisjahr, Prognose (7 Jahre) mit CAGR
- PEST- und SWOT-Analyse
- Marktgröße Wert/Volumen – Global, Regional, Land
- Branchen- und Wettbewerbslandschaft
- Excel-Datensatz
Erfahrungsberichte
Der SCADA-Systemmarktbericht von Insight Partners ist umfassend und bietet wertvolle Einblicke in aktuelle Trends und Zukunftsprognosen. Das Team war durchweg hochprofessionell, reaktionsschnell und hilfsbereit. Wir sind sehr zufrieden und können die Dienstleistungen wärmstens empfehlen.
RAN KEDEM Partner, Reali Technologies LTDsIch habe einen Bericht über einen sehr spezifischen Softwaremarkt angefordert, und das Team hat ihn innerhalb weniger Tage erstellt. Die Informationen waren sehr relevant und gut präsentiert. Anschließend habe ich einige Änderungen und Ergänzungen zum Bericht angefordert. Das Team reagierte erneut sehr schnell, und ich erhielt den Abschlussbericht in weniger als einer Woche.
JEAN-HERVE JENN Vorsitzende, Future AnalyticaWir haben mit The Insight Partners für eine wichtige Marktstudie und Prognose zusammengearbeitet. Sie gaben uns klare Einblicke in Chancen und Risiken, die uns bei der Gestaltung unserer Pläne halfen. Ihre Recherchen waren benutzerfreundlich und basierten auf soliden Daten. Sie halfen uns, kluge und sichere Entscheidungen zu treffen. Wir können sie wärmstens empfehlen.
PIYUSH NAGPAL Sr. Vizepräsident, Fernlicht GlobalDie Insight Partners lieferten aufschlussreiche, gut strukturierte Marktforschung mit fundierter Fachkompetenz. Ihr Team war durchweg professionell und reaktionsschnell. Die benutzerfreundliche Website ermöglichte den Zugriff auf Branchenberichte. Wir empfehlen sie wärmstens für zuverlässige und hochwertige Forschungsdienstleistungen.
YUKIHIKO ADACHI Geschäftsführer, Deep Blue, LLC.Dies ist das erste Mal, dass ich einen Marktbericht von The Insight Partners erworben habe. Obwohl ich zunächst unsicher war, besuchte ich die Website und fühlte mich dann sicherer, das Risiko einzugehen und einen Marktbericht zu kaufen. Ich bin mit der Qualität des Berichts und dem Kundenservice rundum zufrieden. Ich hatte einige Fragen und Anmerkungen zum ersten Bericht, aber nach einigen E-Mail-Gesprächen mit dem Analysten bin ich überzeugt, dass ich einen Bericht habe, den ich als Input für unseren strategischen Planungsprozess verwenden kann. Vielen Dank, dass Sie sich die Zeit genommen und dies zu einer positiven Erfahrung gemacht haben. Ich werde Ihren Service auf jeden Fall weiterempfehlen und Sie werden meine erste Anlaufstelle sein, wenn wir weitere Marktdaten benötigen.
JOHN SUZUKI Präsident und Chief Executive Officer, Vorstandsmitglied, BK TechnologiesIch möchte mich für Ihre Unterstützung und die Professionalität bedanken, die Sie bei der Bearbeitung meiner Informationsanfrage zum IVD-Markt für Infektionskrankheiten in Nigeria gezeigt haben. Ich schätze Ihre Geduld, Ihre Beratung und die Tatsache, dass Sie bereit waren, einen Rabatt anzubieten, der uns schließlich den Abschluss eines Geschäfts ermöglichte. Ich freue mich darauf, The Insight Partners in Zukunft wieder zu beauftragen, dank des Eindrucks, den Sie bei dieser ersten Begegnung bei mir hinterlassen haben.
DR. CHIJIOKE ONYIA GESCHÄFTSFÜHRERIN, PineCrest Healthcare Ltd.Grund zum Kauf
- Fundierte Entscheidungsfindung
- Marktdynamik verstehen
- Wettbewerbsanalyse
- Kundeneinblicke
- Marktprognosen
- Risikominimierung
- Strategische Planung
- Investitionsbegründung
- Identifizierung neuer Märkte
- Verbesserung von Marketingstrategien
- Steigerung der Betriebseffizienz
- Anpassung an regulatorische Trends


Exklusive Berichtsrabatte freischalten
Jetzt anfragen


 Kostenlose Probe anfordern für - Pyranometer-Markt