レーダーシミュレーター市場の分析と予測 - 規模、シェア、成長、トレンド 2031 年
過去データ : 2021-2022 | 基準年 : 2023 | 予測期間 : 2024-2031レーダーシミュレータ市場の規模と予測(2021年 - 2031年)、世界および地域のシェア、トレンド、成長機会分析レポートの対象範囲:コンポーネント(ハードウェアとソフトウェア)、システム(システムテストとオペレータトレーニング)、アプリケーション(軍事および商業)、および地域別
- ステータス : 公開されたデータ
- レポートコード : TIPRE00005422
- カテゴリー : 航空宇宙および防衛
- ページ数 : 150
- 利用可能なレポート形式 :


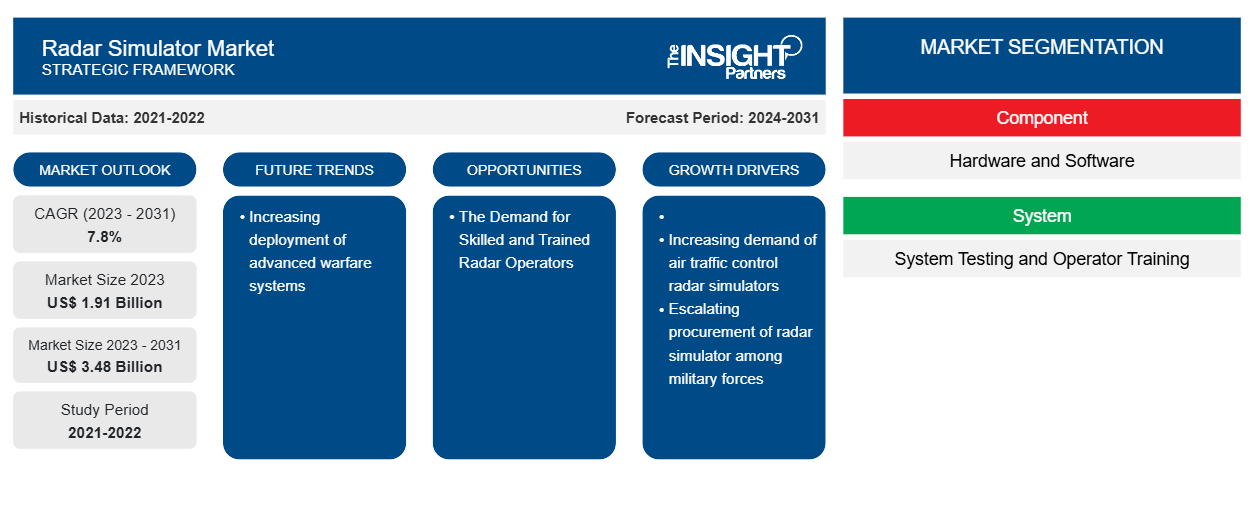
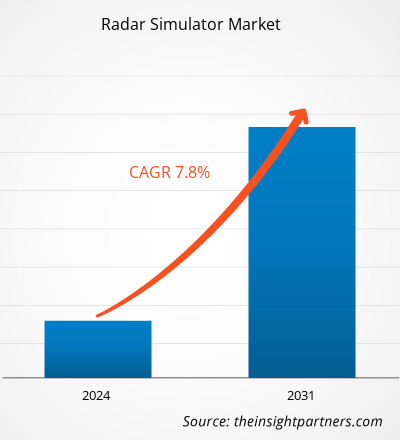
レーダーシミュレーターの市場規模は、2023年の19億1,000万米ドルから2031年には34億8,000万米ドルに達すると予測されています。市場は2023年から2031年の間に7.8%のCAGRを記録すると予想されています。高度な戦闘システムの導入の増加は、引き続き市場の主要なトレンドとなると思われます。
レーダーシミュレータ市場分析
世界のレーダー シミュレータ市場のエコシステムにおける主要な利害関係者には、原材料およびコンポーネント プロバイダー、レーダー シミュレータの製造元および開発者、システム インテグレーター、エンド ユーザーが含まれます。コンポーネントおよびハードウェア プロバイダーは、レーダー シミュレータ製造元に多数の部品とコンポーネントを提供しています。レーダー シミュレータの製造には、アンテナ、受信機、波形発生器、マイクロ コントローラーなど、さまざまな種類のコンポーネントが使用されます。これらすべてのコンポーネントをタイムリーに供給することは、レーダー シミュレータ製造工場全体の効率的な運用に不可欠です。したがって、これらのコンポーネント プロバイダーに対する運用上の影響は、レーダー シミュレータ市場に直接影響します。
レーダーシミュレータ市場の概要
バリュー チェーンの主な利害関係者は、レーダー シミュレーターの製造元とソフトウェア開発者です。これらの企業は、最終統合製品をエンド ユーザー セクターに提供します。市場で活動している主要なプレーヤーには、Collins Aerospace、L3Harris Technologies、Inc.、Mercury Systems、Inc.、Ultra Electronics Holdings plc、ARI Simulation などがあります。市場で活動しているシステム インテグレーターは、ハードウェアとソフトウェアのソリューションを統合して、世界のレーダー シミュレーター市場のエンド ユーザーに最終製品を提供します。
要件に合わせてレポートをカスタマイズする
このレポートの一部、国レベルの分析、Excelデータパックなど、あらゆるレポートを無料でカスタマイズできます。また、スタートアップや大学向けのお得なオファーや割引もご利用いただけます。
レーダーシミュレータ市場:戦略的洞察
-
このレポートの主要な市場動向を入手してください。この無料サンプルには、市場動向から見積もりや予測に至るまでのデータ分析が含まれます。
レーダーシミュレータ市場の推進要因と機会
軍隊におけるレーダーシミュレータの調達の拡大
公共の場、国境、陸上、軍港、空軍基地におけるセキュリティに関する懸念は、世界中で継続的に高まっています。レーダー システムの助けを借りて空中、海上、または地上の脅威を効果的に管理および制御することは、世界中のあらゆる地域の軍隊およびセキュリティ当局にとって重要なパラダイムになっています。レーダー システムとレーダー シミュレーターは、軍事作戦と人員の安全を確保するため、およびレーダー操作員の効率的なトレーニングのために、ますます採用が進んでいます。レーダー シミュレーターは、頻繁に発生する高度な空爆の脅威に対抗できるように操作員をトレーニングするために、それぞれの軍隊を強化するために、米国、中国、インド、日本、オーストラリア、カナダ、ドイツ、フランス、英国などの多くの国で調達されています。レーダー シミュレーターはさらに、軍関係者が未確認の脅威からの攻撃に備えて対抗計画を立案するのに役立ちます。レーダー シミュレータの調達はさまざまな国の軍事部門で増加しており、これらの国の政府は軍事および防衛部門がより高度なレーダー システムとレーダー シミュレータを調達できるように、軍事支出予算の増額を提案しています。
熟練した訓練を受けたレーダーオペレーターの需要
現代の航空管制塔と高度な軍事技術の台頭により、現代の地上航空機関連機器と軍事技術を操作できるオペレーターの需要が高まっています。レーダーシミュレーターは、未処理の大量のレーダー信号データを処理して、未確認の空中脅威、海上脅威、または定義された境界内にあるその他の物体を発見します。さまざまな国の軍隊や防衛軍の間でレーダーシミュレーターの採用が増加しており、レーダーシミュレーション技術の開発と研究への多額の投資が引き起こされています。これにより、空港、空軍基地、海軍艦艇、軍用貨物船、海軍港で高度なスキルと訓練を受けたレーダーオペレーターの需要が高まっています。この需要が今後数年間で増加すると予想されるという事実は、今後数年間のレーダーシミュレーター市場全体だけでなく、主要な市場プレーヤーにとっても大きな成長の機会となります。航空宇宙および防衛部門は予測期間中に成長すると見込まれるため、各国の空域、水路、国境を守るために、熟練した訓練を受けた経験豊富なレーダーオペレーターの需要がさらに高まると予想されます。したがって、海軍と陸軍に加え、商業航空部門と防衛航空部門全体で熟練した訓練を受けたレーダーオペレーターの需要が高まり、近い将来にレーダーシミュレーター市場が拡大すると予想されます。
レーダーシミュレータ市場レポートのセグメンテーション分析
レーダー シミュレータ市場分析の導出に貢献した主要なセグメントは、コンポーネント、システム、およびアプリケーションです。
- コンポーネントに基づいて、レーダーシミュレーター市場はハードウェアとソフトウェアに分割されています。ハードウェアセグメントは2023年に大きな市場シェアを占めました。
- システムに基づいて、レーダーシミュレーター市場はシステムテストとオペレータートレーニングに分類されます。オペレータートレーニングセグメントは2023年に大きな市場シェアを占めました。
- 用途に基づいて、レーダーシミュレーター市場は軍事用と商用に分かれています。2023年には商用セグメントがより大きな市場シェアを占めました。
地域別レーダーシミュレータ市場シェア分析
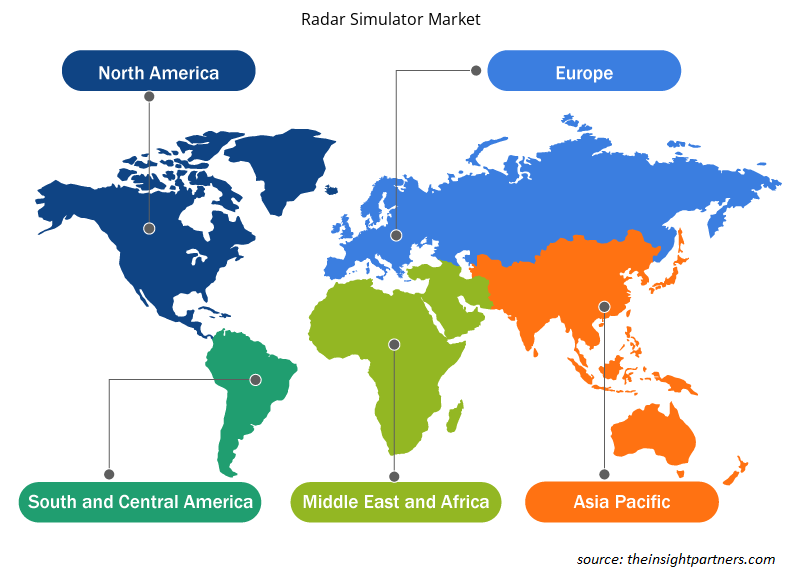
レーダーシミュレータ市場レポートの地理的範囲は、主に北米、ヨーロッパ、アジア太平洋、中東およびアフリカ、南米の 5 つの地域に分かれています。
2023年には北米が市場を支配し、その後にヨーロッパとアジア太平洋地域が続きます。さらに、アジア太平洋地域も今後数年間で最高のCAGRを記録する可能性があります。 2023年には米国が北米のレーダーシミュレーター市場を支配しました。これは主に、レーダーシミュレーター技術の早期導入によるものです。さらに、米国は世界最大の防衛予算を持ち、多額の予算がアップグレードされた兵器システムの導入と調達に充てられています。これは、全国のレーダーシミュレーターの需要に貢献しています。米国空軍と軍隊全体の航空機数の増加も、国内の市場成長を支える要因となっています。米国全土の実際の地形や気象パターン、ターゲットを正確にシミュレートするためのレーダーシミュレーターの利用が増えていることも、国内の市場成長を牽引しています。米国での新しい高度なレーダーシミュレーターの需要の高まりは、市場の成長を牽引する大きな要因です。また、気象レーダーシミュレーションの機能を備えたレーダーシミュレーターも米国で人気が高まっています。パイロットや航空支援スタッフの商業訓練や教育目的でのレーダー シミュレーターの幅広い使用が、国内で増加しています。さらに、複雑なマルチレーダー、マルチターゲット シミュレーションを作成するためのレーダー シミュレーターの採用により、システムのレーダー データ テストが可能になり、米国での市場成長も促進されています。Cambridge Pixel Ltd (米国)、Harris Corporation (米国)、Buffalo Computer Graphics (米国)、Mercury Systems, Inc. (米国)、Textron Systems (米国)、Rockwell Collins (米国) など、さまざまな主要市場プレーヤーの存在が、この国の市場成長を後押ししています。
レーダーシミュレータ市場の地域別分析
予測期間を通じてレーダー シミュレーター市場に影響を与える地域的な傾向と要因は、Insight Partners のアナリストによって徹底的に説明されています。このセクションでは、北米、ヨーロッパ、アジア太平洋、中東、アフリカ、南米、中米にわたるレーダー シミュレーター市場のセグメントと地理についても説明します。
- レーダーシミュレータ市場の地域別データを入手
レーダーシミュレータ市場レポートの範囲
| レポート属性 | 詳細 |
|---|---|
| 2023年の市場規模 | 19億1000万米ドル |
| 2031年までの市場規模 | 34億8千万米ドル |
| 世界のCAGR(2023年~2031年) | 7.8% |
| 履歴データ | 2021-2022 |
| 予測期間 | 2024-2031 |
| 対象セグメント |
コンポーネント別
|
| 対象地域と国 |
北米
|
| 市場リーダーと主要企業プロフィール |
|
市場プレーヤーの密度:ビジネスダイナミクスへの影響を理解する
レーダー シミュレーター市場は、消費者の嗜好の変化、技術の進歩、製品の利点に対する認識の高まりなどの要因により、エンド ユーザーの需要が高まり、急速に成長しています。需要が高まるにつれて、企業は提供内容を拡大し、消費者のニーズを満たすために革新を起こし、新たなトレンドを活用し、市場の成長をさらに促進しています。
市場プレーヤー密度とは、特定の市場または業界内で活動している企業または会社の分布を指します。これは、特定の市場スペースに、その規模または総市場価値と比較して、どれだけの競合相手 (市場プレーヤー) が存在するかを示します。
レーダーシミュレータ市場で事業を展開している主要企業は次のとおりです。
- アダセルテクノロジーズリミテッド
- ARIシミュレーション
- バッファローコンピュータグラフィックス
- ケンブリッジピクセル株式会社
- L3ハリステクノロジーズ株式会社
- マーキュリーシステムズ株式会社
免責事項:上記の企業は、特定の順序でランク付けされていません。
- レーダーシミュレーター市場のトップキープレーヤーの概要を入手
レーダーシミュレータ市場のニュースと最近の動向
レーダー シミュレータ市場は、主要な企業出版物、協会データ、データベースなどの一次調査と二次調査後の定性的および定量的データを収集することによって評価されます。レーダー シミュレータ市場の動向のいくつかを以下に示します。
- COBRA レーダー環境シミュレーター (CRES) 契約は、ドイツとフランスを代表して HENSOLDT Sensors GmbH と OCCAR の間で締結されました。(出典: OCCAR、プレスリリース、2021 年 6 月)
- Micro Nav は、NATS からアバディーン、グラスゴー、サウサンプトンの各空港に BEST タワーおよびレーダー シミュレーション機能を提供する契約を獲得したことを誇りに思います。契約には、アバディーン空港とグラスゴー空港の既存の BEST 2D タワー システムを 3D タワー シミュレーター機能にアップグレードし、サウサンプトン空港にまったく新しい BEST 3D タワー シミュレーターを提供することが含まれています。(出典: Micro Nav、プレス リリース、2023 年 8 月)
レーダーシミュレータ市場レポートの対象範囲と成果物
「レーダーシミュレーター市場規模と予測(2021〜2031年)」レポートでは、以下の分野をカバーする市場の詳細な分析を提供しています。
- レーダーシミュレーターの市場規模と予測、対象範囲に含まれるすべての主要市場セグメントの世界、地域、国レベルでの予測
- レーダーシミュレータ市場の動向、および推進要因、制約、主要な機会などの市場動向
- ポーターの5つの力の詳細な分析
- 主要な市場動向、世界および地域の枠組み、主要プレーヤー、規制、最近の市場動向を網羅したレーダーシミュレータ市場分析
- 市場集中、ヒートマップ分析、主要プレーヤー、レーダーシミュレータ市場の最近の動向を網羅した業界展望と競争分析
- 詳細な企業プロフィール

Naveenは、カスタム、シンジケート、コンサルティングの各プロジェクトにおいて9年以上の実績を持つ、経験豊富な市場調査およびコンサルティングのプロフェッショナルです。現在はアソシエイトバイスプレジデントを務め、プロジェクトバリューチェーン全体にわたるステークホルダー管理を成功させ、100件以上の調査レポートと30件以上のコンサルティング案件を執筆しています。産業および政府機関のプロジェクトに幅広く携わり、クライアントの成功とデータに基づく意思決定に大きく貢献しています。
Naveenは、カルナータカ州VTUで電子通信工学の学位を取得し、マニパル大学でマーケティング&オペレーションズのMBAを取得しています。IEEEの会員として9年間活動し、会議や技術シンポジウムへの参加、セクションレベルおよび地域レベルでのボランティア活動に積極的に取り組んでいます。現職以前は、IndustryARCでアソシエイト戦略コンサルタント、Hewlett Packard(HP Global)で産業用サーバーコンサルタントを務めていました。
- 過去2年間の分析、基準年、CAGRによる予測(7年間)
- PEST分析とSWOT分析
- 市場規模価値/数量 - 世界、地域、国
- 業界と競争環境
- Excel データセット
お客様の声
Insight PartnersのSCADAシステム市場レポートは包括的で、現在のトレンドと将来の予測に関する貴重な洞察が含まれています。チームは終始、非常にプロフェッショナルで、対応が早く、サポートも充実していました。私たちは彼らのサービスに非常に満足しており、強くお勧めします。
ラン・ケデム パートナー, レアリテクノロジーズ株式会社非常に特殊なソフトウェア市場に関するレポートを依頼したところ、チームは数日でレポートを作成してくれました。情報は非常に関連性が高く、分かりやすくまとめられていました。その後、レポートにいくつか修正と追加を依頼しましたが、チームは非常に迅速に対応し、1週間も経たないうちに最終レポートを受け取ることができました。
ジャン=エルヴェ・ジェン 会長, フューチャー・アナリティカ重要な市場調査と予測のために、The Insight Partnersと協力しました。彼らは機会とリスクに関する明確な洞察を提供し、私たちの計画策定に役立ちました。彼らの調査は使いやすく、確かなデータに基づいており、賢明で自信に満ちた意思決定に役立ちました。彼らを強くお勧めします。
ピユーシュ・ナグパル 上級副社長, ハイビームグローバルInsight Partnersは、深い専門知識に基づき、洞察力に富み、構造化された市場調査を提供しました。チームは終始プロフェッショナルで、対応力も抜群でした。ユーザーフレンドリーなウェブサイトにより、業界レポートへのアクセスもスムーズでした。信頼性の高い高品質な調査サービスをお探しなら、Insight Partnersを強くお勧めします。
安達幸彦 最高経営責任者(CEO), ディープブルーLLC。The Insight Partnersから市場レポートを購入するのは今回が初めてです。最初は不安でしたが、ウェブサイトを見て、リスクを負ってでも購入してみようという気持ちになりました。レポートの品質とカスタマーサービスには大変満足しています。最初のレポートにはいくつか質問やコメントがありましたが、アナリストとメールで何度かやり取りした結果、戦略策定プロセスへのインプットとして活用できるレポートが完成しました。貴重なお時間を割いていただき、貴重な体験をさせていただき、誠にありがとうございました。他の方にもぜひお勧めしたいですし、今後さらに市場データが必要になった際には、まずThe Insight Partnersにご連絡させていただきます。
ジョン・スズキ 社長兼最高経営責任者、取締役, BKテクノロジーズナイジェリアの感染症IVD市場に関する情報提供依頼に対し、ご対応いただいた際、ご尽力とプロフェッショナルな姿勢に深く感謝申し上げます。忍耐強く、的確なアドバイスをいただき、また、最終的に取引成立に至った割引のご提供にも深く感謝申し上げます。今回の最初の出会いで得た強い印象のおかげで、今後もThe Insight Partnersとの連携を心待ちにしております。
チジオケ博士 オニア マネージングディレクター, パインクレストヘルスケア株式会社購入理由
- 情報に基づいた意思決定
- 市場動向の理解
- 競合分析
- 顧客インサイト
- 市場予測
- リスク軽減
- 戦略計画
- 投資の正当性
- 新興市場の特定
- マーケティング戦略の強化
- 業務効率の向上
- 規制動向への対応


 無料サンプルを入手 - レーダーシミュレータ市場