
リモートセンシングサービス市場の成長、規模、シェア、傾向、主要プレーヤーの分析、2031年までの予測
リモートセンシングサービス市場の規模と予測(2021年 - 2031年)、世界および地域のシェア、トレンド、成長機会分析レポートの対象範囲:解像度(スペクトル、空間、放射測定、時間)、プラットフォームタイプ(航空機、UAV、衛星、地上)、エンドユーザー(商用および防衛)および地域
- ステータス : 公開されたデータ
- レポートコード : TIPAD00002464
- カテゴリー : 航空宇宙および防衛
- ページ数 : 150
- 利用可能なレポート形式 :


- 最終更新日 : February 15, 2025

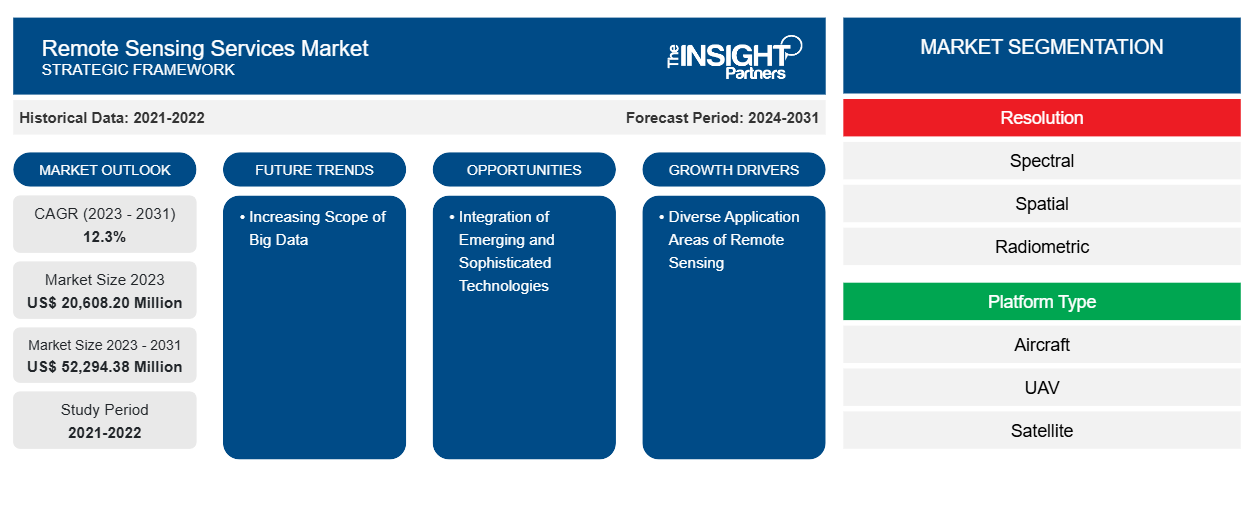
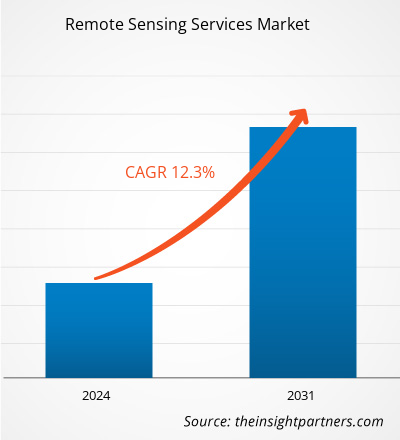
リモートセンシングサービスの市場規模は、2023年の206億820万米ドルから2031年には522億9438万米ドルに達すると予測されています。市場は2023年から2031年の間に12.3%のCAGRを記録すると予想されています。リモートセンシングサービスにおけるビッグデータの範囲の拡大は、今後も市場の重要なトレンドであり続けると思われます。
リモートセンシングサービス市場分析
リモート センシング技術の開発者は、地球表面の物理的特性の監視、マッピング、検出を目的とした技術を開発します。その後、衛星、地上設備、無人航空機を含むシステム インテグレーターの部分が続きます。最終的なリモート センシング技術はセンサーに統合され、前述のシステム インテグレーターによって国のさまざまな場所で最終的に使用されます。この製品は、AABSyS IT などのサービス プロバイダーの支援を受けて、商業市場と防衛市場のニーズに応えるために提供されています。商業市場には、気象、林業、農業などが含まれます。
リモートセンシングサービス市場の概要
リモート センシング サービス市場は、主にセンサー製造業者、リモート センシング技術開発者、システム インテグレーター、サービス プロバイダー、およびエンド ユーザーで構成されています。センサー製造業者は、電磁スペクトルの赤外線、可視光線、マイクロ波部分、および熱赤外線で動作するリモート センシング アプリケーションで使用されるアクティブ センサーとパッシブ センサーを製造しています。
要件に合わせてレポートをカスタマイズする
このレポートの一部、国レベルの分析、Excelデータパックなど、あらゆるレポートを無料でカスタマイズできます。また、スタートアップや大学向けのお得なオファーや割引もご利用いただけます。
リモートセンシングサービス市場:戦略的洞察
-
このレポートの主要な市場動向を入手してください。この無料サンプルには、市場動向から見積もりや予測に至るまでのデータ分析が含まれます。
リモートセンシングサービス市場の推進要因と機会
リモートセンシングの多様な応用分野が市場を有利にする
リモート センシング サービスのユーザーとしては、軍隊、農業部門、森林部門、天気予報部門などが挙げられます。軍隊では、諜報活動、地図作成、地形分析、戦場管理、軍事施設管理、テロ活動の監視など、さまざまな用途で衛星画像とリモート センシングを使用しています。軍隊における前述の用途が適切に機能するように、リモート センシングの使用は拡大すると予想されます。
新興技術と高度な技術の導入
農業におけるロットの応用、自動化、コンピューターイメージング、ロボット工学、リモートセンシングなどのハイエンド技術の実装が拡大しています。 IoTベースのリモートセンシングでは、気象ステーションなどの農場に設置されたセンサーを使用してデータを収集し、分析ツールに送信して分析します。 センサーを通じて、農家は分析ダッシュボードから作物を監視し、収集された情報に基づいて決定を下すことができます。 以下は、リモートセンシングによって提供される機能の一部です。 農家はデジタル環境によってよりつながりを持つようになっているため、ロット、クラウド、リモートセンシング技術の最先端の使用は、農家がオープンな農業エコシステムを採用するのに役立ちます。 ハイエンド技術を活用することで、増加する作物生産の需要を世界的に満たす可能性が高まります。 高度な技術を統合するこの側面は、リモートセンシングの範囲を拡大し、それによって市場の発展に貢献します。
リモートセンシングサービス市場レポートのセグメンテーション分析
リモート センシング サービス市場分析の導出に貢献した主要なセグメントは、解像度、プラットフォーム タイプ、エンド ユーザーです。
- 解像度に基づいて、リモートセンシングサービス市場はスペクトル、空間、放射、および時間に分類されます。空間セグメントは2023年に大きな市場シェアを占めました。
- プラットフォームの種類に基づいて、リモートセンシングサービス市場は航空機、UAV、衛星、地上に分かれています。衛星セグメントは2023年に大きな市場シェアを占めました。
- エンドユーザーに基づいて、リモートセンシングサービス市場は商業用と防衛用に分かれています。商業用セグメントは2023年に大きな市場シェアを占めました。
リモートセンシングサービス市場シェア分析(地域別)
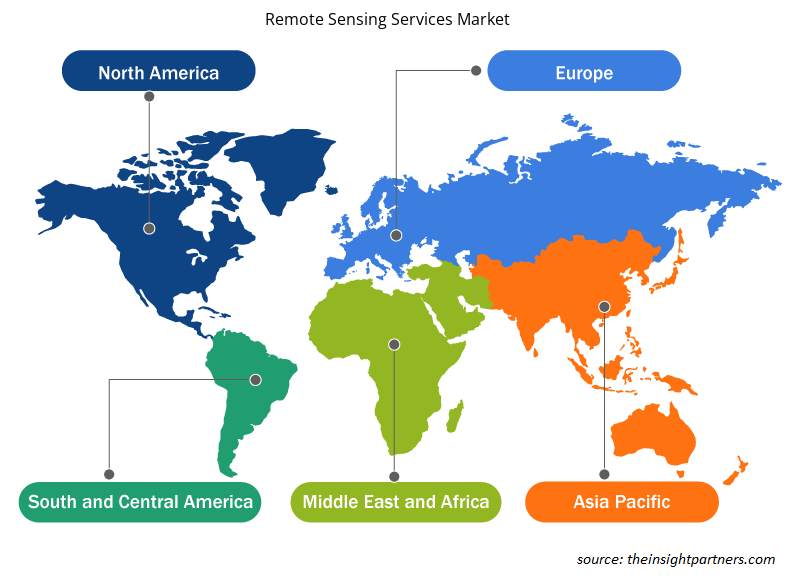
リモートセンシング サービス市場レポートの地理的範囲は、主に北米、アジア太平洋、ヨーロッパ、中東およびアフリカ、南米および中米の 5 つの地域に分かれています。
リモートセンシングサービス市場レポートの対象範囲は、北米(米国、カナダ、メキシコ)、欧州(ロシア、英国、フランス、ドイツ、イタリア、その他の欧州)、アジア太平洋(韓国、インド、オーストラリア、日本、中国、その他のアジア太平洋)、中東およびアフリカ(サウジアラビア、南アフリカ、UAE、その他の中東およびアフリカ)、南米および中米(アルゼンチン、ブラジル、その他の南米および中米)です。収益面では、2023年に北米がリモートセンシングサービス市場シェアを独占しました。ヨーロッパは世界のリモートセンシングサービス市場への2番目に大きな貢献者であり、アジア太平洋がそれに続きます。
リモートセンシングサービス市場の地域別分析
予測期間を通じてリモート センシング サービス市場に影響を与える地域的な傾向と要因は、Insight Partners のアナリストによって徹底的に説明されています。このセクションでは、北米、ヨーロッパ、アジア太平洋、中東およびアフリカ、南米および中米にわたるリモート センシング サービス市場のセグメントと地理についても説明します。
- リモートセンシングサービス市場の地域別データを入手
リモートセンシングサービス市場レポートの範囲
| レポート属性 | 詳細 |
|---|---|
| 2023年の市場規模 | 206億820万米ドル |
| 2031年までの市場規模 | 522億9,438万米ドル |
| 世界のCAGR(2023年~2031年) | 12.3% |
| 履歴データ | 2021-2022 |
| 予測期間 | 2024-2031 |
| 対象セグメント |
決議により
|
| 対象地域と国 |
北米
|
| 市場リーダーと主要企業プロフィール |
|
リモートセンシングサービス市場のプレーヤー密度:ビジネスダイナミクスへの影響を理解する
リモート センシング サービス市場は、消費者の嗜好の変化、技術の進歩、製品の利点に対する認識の高まりなどの要因により、エンド ユーザーの需要が高まり、急速に成長しています。需要が高まるにつれて、企業は提供内容を拡大し、消費者のニーズを満たすために革新を起こし、新たなトレンドを活用し、市場の成長をさらに促進しています。
市場プレーヤー密度とは、特定の市場または業界内で活動している企業または会社の分布を指します。これは、特定の市場スペースに、その市場規模または総市場価値に対してどれだけの競合相手 (市場プレーヤー) が存在するかを示します。
リモートセンシングサービス市場で事業を展開している主要企業は次のとおりです。
- アントリックス株式会社
- サイバースウィフトインフォテック株式会社
- ジオセンスSDN.BHD.
- マロンテクノロジー
- エコファストバSL
- サテライトイメージングコーポレーション
免責事項:上記の企業は、特定の順序でランク付けされていません。
- リモートセンシングサービス市場のトップキープレーヤーの概要を入手
リモートセンシングサービス市場のニュースと最近の動向
リモート センシング サービス市場は、主要な企業出版物、協会データ、データベースなどの一次調査と二次調査後の定性的および定量的データを収集することによって評価されます。リモート センシング サービス市場の動向のいくつかを以下に示します。
- マロン テクノロジーは、GO アワード 北アイルランド 2020 のベスト サービス カテゴリー賞を受賞しました。この賞は、同社が提供する優れた顧客サービスが評価されたものです。(出典: マロン テクノロジー、プレスリリース、2020 年 3 月)
- NorthStar Earth & Space Inc. は、包括的なハイパースペクトル画像サービスを提供するため、ネバダ州リノの SpecTIR Hyperspectral & Remote Sensing Solutions との戦略的ビジネス パートナーシップを発表しました。SpecTIR の空中ハイパースペクトル画像サービスは、地球、地球環境、近宇宙を監視する世界初のグローバル情報プラットフォームである NorthStar が提供する宇宙ベースのハイパースペクトル画像サービスを補完するものです。(出典: SpecTIR、プレス リリース、2019 年 1 月)
リモートセンシングサービス市場レポートの対象範囲と成果物
「リモートセンシングサービス市場規模と予測(2021〜2031年)」レポートでは、以下の分野をカバーする市場の詳細な分析を提供しています。
- リモートセンシングサービスの市場規模と予測(対象範囲に含まれるすべての主要市場セグメントについて、世界、地域、国レベルで)
- リモートセンシングサービス市場の動向、推進要因、制約、主要な機会などの市場動向
- 詳細なPESTおよびSWOT分析
- 主要な市場動向、世界および地域の枠組み、主要プレーヤー、規制、最近の市場動向を網羅したリモートセンシングサービス市場分析
- 市場集中、ヒートマップ分析、主要プレーヤー、リモートセンシングサービス市場の最近の動向を網羅した業界の状況と競争分析
- 詳細な企業プロフィール

Naveenは、カスタム、シンジケート、コンサルティングの各プロジェクトにおいて9年以上の実績を持つ、経験豊富な市場調査およびコンサルティングのプロフェッショナルです。現在はアソシエイトバイスプレジデントを務め、プロジェクトバリューチェーン全体にわたるステークホルダー管理を成功させ、100件以上の調査レポートと30件以上のコンサルティング案件を執筆しています。産業および政府機関のプロジェクトに幅広く携わり、クライアントの成功とデータに基づく意思決定に大きく貢献しています。
Naveenは、カルナータカ州VTUで電子通信工学の学位を取得し、マニパル大学でマーケティング&オペレーションズのMBAを取得しています。IEEEの会員として9年間活動し、会議や技術シンポジウムへの参加、セクションレベルおよび地域レベルでのボランティア活動に積極的に取り組んでいます。現職以前は、IndustryARCでアソシエイト戦略コンサルタント、Hewlett Packard(HP Global)で産業用サーバーコンサルタントを務めていました。
- 包括的な市場規模および予測分析
- 詳細なセグメンテーション分析
- 市場動向(ダイナミクス)の徹底的な評価
- 地域および国別のインサイト
- 競争環境および企業ベンチマーク
- 戦略的ビジネスインテリジェンス
お客様の声
Insight PartnersのSCADAシステム市場レポートは包括的で、現在のトレンドと将来の予測に関する貴重な洞察が含まれています。チームは終始、非常にプロフェッショナルで、対応が早く、サポートも充実していました。私たちは彼らのサービスに非常に満足しており、強くお勧めします。
ラン・ケデム パートナー, レアリテクノロジーズ株式会社非常に特殊なソフトウェア市場に関するレポートを依頼したところ、チームは数日でレポートを作成してくれました。情報は非常に関連性が高く、分かりやすくまとめられていました。その後、レポートにいくつか修正と追加を依頼しましたが、チームは非常に迅速に対応し、1週間も経たないうちに最終レポートを受け取ることができました。
ジャン=エルヴェ・ジェン 会長, フューチャー・アナリティカ重要な市場調査と予測のために、The Insight Partnersと協力しました。彼らは機会とリスクに関する明確な洞察を提供し、私たちの計画策定に役立ちました。彼らの調査は使いやすく、確かなデータに基づいており、賢明で自信に満ちた意思決定に役立ちました。彼らを強くお勧めします。
ピユーシュ・ナグパル 上級副社長, ハイビームグローバルInsight Partnersは、深い専門知識に基づき、洞察力に富み、構造化された市場調査を提供しました。チームは終始プロフェッショナルで、対応力も抜群でした。ユーザーフレンドリーなウェブサイトにより、業界レポートへのアクセスもスムーズでした。信頼性の高い高品質な調査サービスをお探しなら、Insight Partnersを強くお勧めします。
安達幸彦 最高経営責任者(CEO), ディープブルーLLC。The Insight Partnersから市場レポートを購入するのは今回が初めてです。最初は不安でしたが、ウェブサイトを見て、リスクを負ってでも購入してみようという気持ちになりました。レポートの品質とカスタマーサービスには大変満足しています。最初のレポートにはいくつか質問やコメントがありましたが、アナリストとメールで何度かやり取りした結果、戦略策定プロセスへのインプットとして活用できるレポートが完成しました。貴重なお時間を割いていただき、貴重な体験をさせていただき、誠にありがとうございました。他の方にもぜひお勧めしたいですし、今後さらに市場データが必要になった際には、まずThe Insight Partnersにご連絡させていただきます。
ジョン・スズキ 社長兼最高経営責任者、取締役, BKテクノロジーズナイジェリアの感染症IVD市場に関する情報提供依頼に対し、ご対応いただいた際、ご尽力とプロフェッショナルな姿勢に深く感謝申し上げます。忍耐強く、的確なアドバイスをいただき、また、最終的に取引成立に至った割引のご提供にも深く感謝申し上げます。今回の最初の出会いで得た強い印象のおかげで、今後もThe Insight Partnersとの連携を心待ちにしております。
チジオケ博士 オニア マネージングディレクター, パインクレストヘルスケア株式会社購入理由
- 情報に基づいた意思決定
- 市場動向の理解
- 競合分析
- 顧客インサイト
- 市場予測
- リスク軽減
- 戦略計画
- 投資の正当性
- 新興市場の特定
- マーケティング戦略の強化
- 業務効率の向上
- 規制動向への対応


