スリップおよびティアシート市場分析と予測 - 規模、シェア、成長、トレンド 2031 年
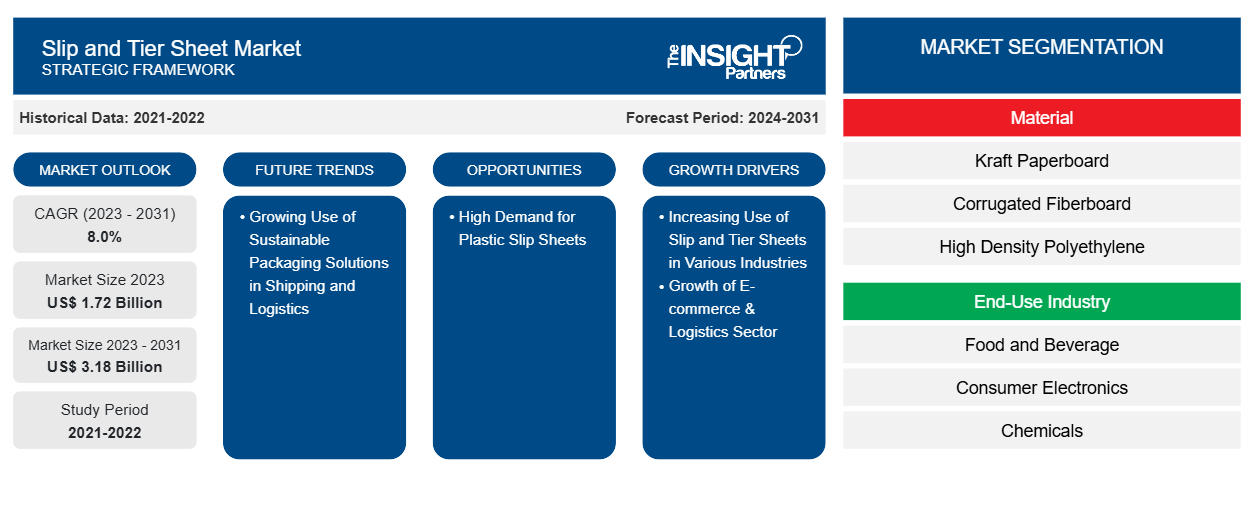
過去データ : 2021-2022 | 基準年 : 2023 | 予測期間 : 2024-2031スリップシートおよびティアシート市場の規模と予測(2021年 - 2031年)、世界および地域のシェア、トレンド、成長機会分析レポートの対象範囲:材質別(クラフト紙、段ボール、高密度ポリエチレンなど)および最終用途産業別(食品・飲料、家電製品、化学薬品、医薬品、小売など)
- ステータス : 出版
- レポートコード : TIPRE00029774
- カテゴリー : 化学薬品および材料
- ページ数 : 245
- 利用可能なレポート形式 :


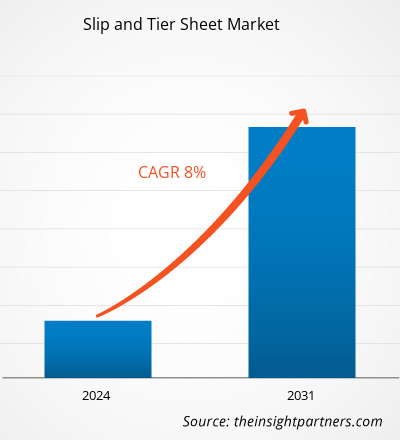
スリップおよびティアシート市場は、2023年の17億2,000万米ドルから2031年までに31億8,000万米ドルに成長すると予想されており、2023年から2031年にかけて8.0%のCAGRを記録すると推定されています。
市場洞察とアナリストの見解:
スリップシートとティアシートは、木製パレットの手頃な代替品です。これらのシートは木製パレットよりも場所を取らず、より多くのトラックを輸送できるため、企業の物流費用を節約できます。スリップシートとティアシートは、通常、クラフト紙、段ボール、高密度ポリエチレン、ポリプロピレンで作られています。メーカーは、積載装置に接続するリップ延長部の数に基づいてスリップシートを設計します。スリップシートの 2 つの基本的なタイプは、シングルリップとマルチリップです。段ボール製のスリップシートは、接着剤または糊で接着された波形の内側を持つ 2 つのライナー表面で構成されています。板紙で製造されたスリップシートは、ベース重量と密度が高くなっています。複数の層がラミネートされて製造され、この接着により、異なる温度環境でシートを複数回使用できます。プラスチック製スリップシートは、熱可塑性または熱硬化性ポリマーで作られています。プラスチック製スリップシートとティアシートは、手頃で強度が高く、重い材料の取り扱いに適しており、製品に強力な構造サポートを提供するため、ますます人気が高まっています。企業は、長さ、幅、厚さの寸法が指定されたスリップシートを提供しています。ティアシートはさまざまなサイズで入手できます。さらに、市場で事業を展開している企業は、スリップシートとティアシートをあらゆるカスタムサイズで提供しています。
成長の原動力と課題:
さまざまな業界でスリップシートとティアシートの使用が増えていることが、スリップシートとティアシートの市場規模の拡大につながっています。スリップシートは、木製パレットに代わる薄くて軽量な代替品です。スリップシートはパレットよりもはるかに軽量で、輸送や保管に使用するのがはるかに簡単です。従来のパレットに比べてスペースを節約できるため、ユーザーはより多くの製品を輸出できます。したがって、保管スペースの削減とスリップシートの軽量設計は、輸送コストの削減に役立ちます。スリップシートは木製パレットよりも輸送が軽いため、燃料排出量の削減にも役立ちます。簡単にリサイクルでき、環境に優しく、用途が広く、寒くて湿気の多い環境でも使用できます。木製パレットには、げっ歯類の侵入や汚染のリスクが高くなります。しかし、スリップシートは薄いため、げっ歯類がその下の領域を占拠することはなく、倉庫がより清潔になります。ユーザーは簡単にスリップシートを捨てることができ、時間の経過とともに汚染が蓄積するのを防ぐことができます。また、企業が投資収益の可能性に気付くにつれて、スリップシートの人気が高まっています。このように、パレットよりもスリップシートを使用する利点は、さまざまな最終用途産業で製品需要の増加につながっています。さらに、ティアシートは100%リサイクル紙で作られています。これらのシートは、あらゆる種類のパレットと互換性のあるさまざまなサイズで利用できます。ティアシートは耐久性に優れ、過酷な条件でも使用できます。ティアシートの利点により、飲料ボトル、缶、容器、消費財、工業製品および部品、加工食品、乳製品、塩、穀物、原材料などの乾物などの包装で、このようなシートの使用が増えています。スリップシートとティアシートの市場動向には、輸送と物流における持続可能な包装ソリューションの使用の増加が含まれます。
スリップシートの使用には、いくつかの欠点があります。標準のフォークリフトは機能しないため、顧客はスリップシートを扱うために別の機器を購入またはレンタルする必要があります。スリップシートをパレットの直接の代替品として使用する場合、リフトトラック用のプッシュ/プルアタッチメントが必要になり、これは高価です。また、このようなアタッチメントを安全に取り扱うには、専門知識と適切なトレーニングが必要です。さらに、ある程度、スリップシートは重量のある製品を支えることができません。スリップシートが提供する構造的サポートはパレットが提供するサポートよりも低く、パレットほどの重量を支えることができません。その結果、重い製品を出荷する企業には適した選択肢ではありません。さらに、波形スリップシートは水や湿気に触れると弱くなるため、冷蔵サプライチェーンには適していません。スリップシートの使用に関連するこれらの欠点は、世界のスリップシートおよびティアシート市場の成長を抑制しています。
要件に合わせてレポートをカスタマイズする
このレポートの一部、国レベルの分析、Excelデータパックなど、あらゆるレポートを無料でカスタマイズできます。また、スタートアップや大学向けのお得なオファーや割引もご利用いただけます。
スリップおよびティアシート市場:戦略的洞察
-
このレポートの主要な市場動向を入手してください。この無料サンプルには、市場動向から見積もりや予測に至るまでのデータ分析が含まれます。
レポートのセグメンテーションと範囲:
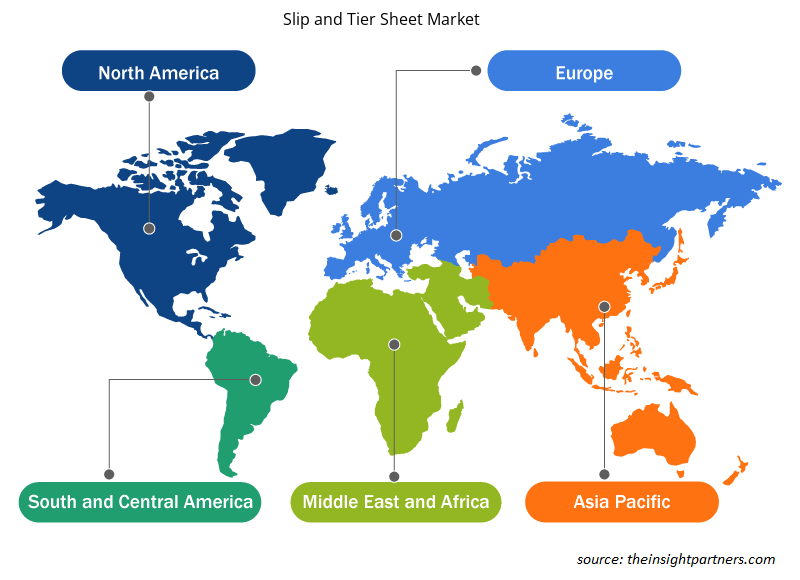
「グローバル スリップおよびティア シート市場分析」は、材料、最終用途産業、および地理のセグメントを考慮して実施されました。材料に基づいて、市場はクラフト ペーパーボード、段ボール、高密度ポリエチレン、およびその他のセグメントに分割されています。最終用途産業では、市場は食品および飲料、消費者向け電子機器、化学薬品、医薬品、小売、およびその他のセグメントに分割されています。スリップおよびティア シート市場レポートの地理的範囲は、北米 (米国、カナダ、メキシコ)、ヨーロッパ (ドイツ、フランス、イタリア、英国、ロシア、その他のヨーロッパ)、アジア太平洋 (オーストラリア、中国、日本、インド、韓国、その他のアジア太平洋)、中東およびアフリカ (南アフリカ、サウジアラビア、UAE、その他の中東およびアフリカ)、および南米および中米 (ブラジル、アルゼンチン、その他の南米および中米) に焦点を当てています。
セグメント分析:
材料に基づいて、スリップおよびティアシート市場は、クラフト板紙、段ボール、高密度ポリエチレン、その他に分類されます。材料に基づいて、クラフト板紙セグメントは、2031年までにスリップおよびティアシートの大きな市場シェアを占めると予想されます。クラフト板紙は、ポリエチレンまたは環境に優しいビチューメン層で裏打ちすることで防水性を高めています。コスト効率が良く軽量であるため、輸送中の製品の保護と梱包に使用されます。クラフト板紙シートは、箱詰めや袋詰めされたバルク製品をパレットの釘やデッキボードによる破れや穴から保護します。クラフト板紙は、ファーストフード店やPOSディスプレイの製造など、多くの用途に使用されています。段ボールも、スリップおよびティアシート市場の主要な材料の1つです。段ボールは、1枚以上の溝付き波形材料をライナーボードの1つ以上の平らな面に接着して形成されるサンドイッチ構造です。段ボール梱包は、用途が広く、経済的、軽量、頑丈、リサイクル可能、そしてダイナミックです。段ボールは通常、消費財の梱包に使用されます。圧縮力に対する耐性、曲げ剛性、耐湿性が向上しています。段ボールは通常、特定の顧客要件を満たすようにカスタム設計されます。
地域分析:
地理に基づいて、市場は北米、ヨーロッパ、アジア太平洋、南米および中米、中東およびアフリカの5つの主要地域に分割されています。収益の面では、北米が世界のスリップシートおよびティアシート市場シェアを独占しました。北米の市場は2023年に約6億5,000万米ドルを占めました。北米のスリップシートおよびティアシート市場は、主にさまざまな最終用途産業での使用の増加によって推進されています。運輸統計局によると、北米の国境を越えた貨物は、2021年8月と比較して2022年8月に24.1%増加しました。増加する国境を越えた貨物は、北米のスリップシートおよびティアシート市場を牽引する主要な要因の1つです。スリップシートおよびティアシートは薄い材料であり、パレットよりも大幅に少ないスペースを占有し、パレットよりもはるかに軽量です。したがって、運送会社と製造業者は木製ペレットよりもスリップシートおよびティアシートを好み、それがこの地域の市場成長を促進しています。
ヨーロッパはもう一つの大きな貢献者であり、世界市場シェアの30%以上を占めています。ヨーロッパのスリップアンドティアシート市場は、物流業界の成長と包装製品の需要の増加により、かなりの成長を遂げています。欧州委員会によると、2021年のヨーロッパの道路貨物輸送は2020年と比較して6.5%と大幅に増加しました。貿易活動の増加により、ヨーロッパ全体の包装資材の需要が促進されています。さらに、2019年から2021年の間に、医薬品の平均年間需要は、診断検査機器、医療消耗品、医療機器、防護服で最高でした。ヨーロッパの医薬品、農業、小売などの最終用途産業の大幅な成長は、ヨーロッパのスリップアンドティアシート市場の成長を促進しています。
スリップシートとティアシート市場の地域別分析
予測期間を通じてスリップおよびティアシート市場に影響を与える地域的な傾向と要因は、Insight Partners のアナリストによって徹底的に説明されています。このセクションでは、北米、ヨーロッパ、アジア太平洋、中東およびアフリカ、南米および中米にわたるスリップおよびティアシート市場のセグメントと地理についても説明します。
- スリップシートおよびティアシート市場の地域別データを入手
スリップおよびティアシート市場レポートの範囲
| レポート属性 | 詳細 |
|---|---|
| 2023年の市場規模 | 17億2千万米ドル |
| 2031年までの市場規模 | 31億8千万米ドル |
| 世界のCAGR(2023年~2031年) | 8.0% |
| 履歴データ | 2021-2022 |
| 予測期間 | 2024-2031 |
| 対象セグメント |
素材別
|
| 対象地域と国 |
北米
|
| 市場リーダーと主要企業プロフィール |
|
スリップとティアシート市場のプレーヤー密度:ビジネスダイナミクスへの影響を理解する
スリップおよびティアシート市場は、消費者の嗜好の変化、技術の進歩、製品の利点に対する認識の高まりなどの要因により、エンドユーザーの需要が高まり、急速に成長しています。需要が高まるにつれて、企業は提供を拡大し、消費者のニーズを満たすために革新し、新たなトレンドを活用し、市場の成長をさらに促進しています。
市場プレーヤー密度とは、特定の市場または業界内で活動している企業または会社の分布を指します。これは、特定の市場スペースに、その規模または総市場価値と比較して、どれだけの競合相手 (市場プレーヤー) が存在するかを示します。
スリップおよびティアシート市場で事業を展開している主要企業は次のとおりです。
- フレッシュパック株式会社
- インターナショナルペーパー社
- ジョージア・パシフィックLLC
- シグノード インダストリアル グループ LLC
- ウェストロック社
- デュラファイバーLLC
免責事項:上記の企業は、特定の順序でランク付けされていません。
- スリップおよびティアシート市場のトップキープレーヤーの概要を入手
業界の発展と将来の機会:
スリップシートおよびティアシート市場の予測は、関係者が成長戦略を計画するのに役立ちます。以下は、市場で活動している主要企業が行っている取り組みです。
- 2023年9月、ソノコプロダクツ社は、合弁パートナーのウェストロック社およびテネシー州チャタヌーガにあるウェストロック社の製紙工場1社からRTSパッケージング社の残りの株式を買収したことを発表しました。この買収により、ソノコ社の100%リサイクル繊維ベースのパッケージングソリューションがさらに強化・拡大し、成長する消費者向けワイン、スピリッツ、食品、美容、ヘルスケア市場にサービスを提供します。この買収により、ソノコ社は米国、メキシコ、南米に15の事業所と1,100人の従業員のネットワークを追加します。
- 2021 年 11 月、ウィスコンシン州フレドニアに本社を置くチップボード加工会社 Badger Paperboard は、テキサス州ヒューストンの Falcon Packaging の買収を発表しました。ヒューストンにある Falcon Packaging の完全な加工および倉庫施設の追加により、Badger の拠点と生産能力が拡大します。
競争環境と主要企業:
Fresh Pak Corp、International Paper Co、Georgia-Pacific LLC、Signode Industrial Group LLC、WestRock Co、Dura-Fibre LLC、Smurfit Kappa Group Plc、Crown Paper Converting、Eltete TPM Oy、およびSonoco Products Coは、スリップおよびティアシート市場レポートで紹介されている著名な企業の一部です。グローバル市場で活動している企業は、顧客の需要を満たすために高品質の製品を提供することに重点を置いています。また、スリップおよびティアシート市場で競争力を維持するために、新製品の発売、生産能力の拡大、パートナーシップ、コラボレーションなどのさまざまな戦略を採用することに重点を置いています。

- 過去2年間の分析、基準年、CAGRによる予測(7年間)
- PEST分析とSWOT分析
- 市場規模価値/数量 - 世界、地域、国
- 業界と競争環境
- Excel データセット
お客様の声
Insight PartnersのSCADAシステム市場レポートは包括的で、現在のトレンドと将来の予測に関する貴重な洞察が含まれています。チームは終始、非常にプロフェッショナルで、対応が早く、サポートも充実していました。私たちは彼らのサービスに非常に満足しており、強くお勧めします。
ラン・ケデム パートナー, レアリテクノロジーズ株式会社非常に特殊なソフトウェア市場に関するレポートを依頼したところ、チームは数日でレポートを作成してくれました。情報は非常に関連性が高く、分かりやすくまとめられていました。その後、レポートにいくつか修正と追加を依頼しましたが、チームは非常に迅速に対応し、1週間も経たないうちに最終レポートを受け取ることができました。
ジャン=エルヴェ・ジェン 会長, フューチャー・アナリティカ重要な市場調査と予測のために、The Insight Partnersと協力しました。彼らは機会とリスクに関する明確な洞察を提供し、私たちの計画策定に役立ちました。彼らの調査は使いやすく、確かなデータに基づいており、賢明で自信に満ちた意思決定に役立ちました。彼らを強くお勧めします。
ピユーシュ・ナグパル 上級副社長, ハイビームグローバルInsight Partnersは、深い専門知識に基づき、洞察力に富み、構造化された市場調査を提供しました。チームは終始プロフェッショナルで、対応力も抜群でした。ユーザーフレンドリーなウェブサイトにより、業界レポートへのアクセスもスムーズでした。信頼性の高い高品質な調査サービスをお探しなら、Insight Partnersを強くお勧めします。
安達幸彦 最高経営責任者(CEO), ディープブルーLLC。The Insight Partnersから市場レポートを購入するのは今回が初めてです。最初は不安でしたが、ウェブサイトを見て、リスクを負ってでも購入してみようという気持ちになりました。レポートの品質とカスタマーサービスには大変満足しています。最初のレポートにはいくつか質問やコメントがありましたが、アナリストとメールで何度かやり取りした結果、戦略策定プロセスへのインプットとして活用できるレポートが完成しました。貴重なお時間を割いていただき、貴重な体験をさせていただき、誠にありがとうございました。他の方にもぜひお勧めしたいですし、今後さらに市場データが必要になった際には、まずThe Insight Partnersにご連絡させていただきます。
ジョン・スズキ 社長兼最高経営責任者、取締役, BKテクノロジーズナイジェリアの感染症IVD市場に関する情報提供依頼に対し、ご対応いただいた際、ご尽力とプロフェッショナルな姿勢に深く感謝申し上げます。忍耐強く、的確なアドバイスをいただき、また、最終的に取引成立に至った割引のご提供にも深く感謝申し上げます。今回の最初の出会いで得た強い印象のおかげで、今後もThe Insight Partnersとの連携を心待ちにしております。
チジオケ博士 オニア マネージングディレクター, パインクレストヘルスケア株式会社購入理由
- 情報に基づいた意思決定
- 市場動向の理解
- 競合分析
- 顧客インサイト
- 市場予測
- リスク軽減
- 戦略計画
- 投資の正当性
- 新興市場の特定
- マーケティング戦略の強化
- 業務効率の向上
- 規制動向への対応


 無料サンプルを入手 - スリップシートとティアシート市場