合成モニタリング市場の成長、規模、シェア、傾向、主要プレーヤーの分析、2031年までの予測
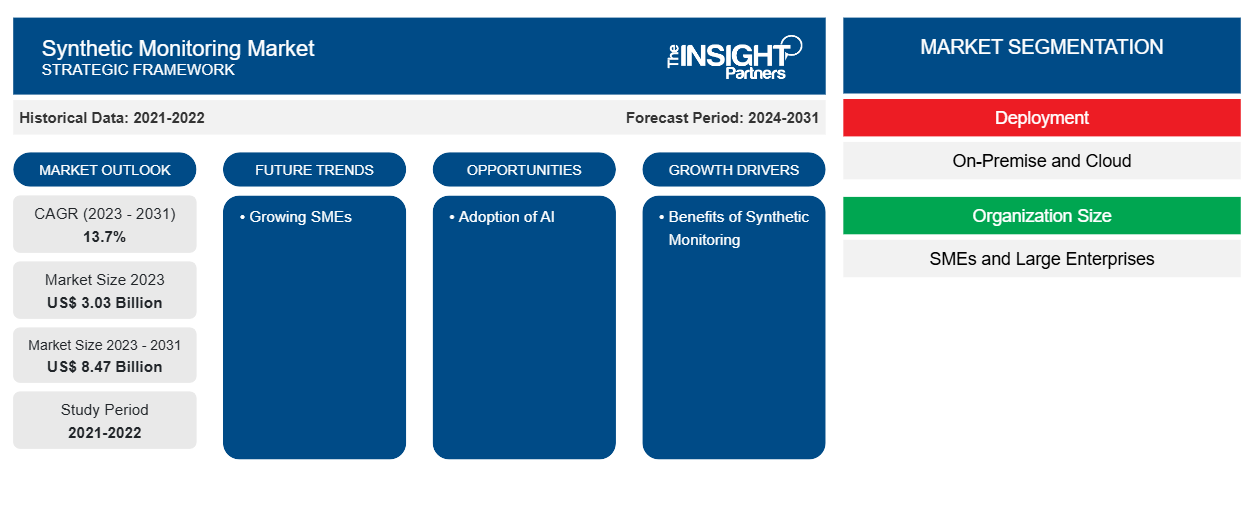
過去データ : 2021-2022 | 基準年 : 2023 | 予測期間 : 2024-2031合成モニタリング市場の規模と予測(2021年 - 2031年)、世界および地域のシェア、トレンド、成長機会分析レポートの対象範囲:展開(オンプレミスおよびクラウド)、組織規模(中小企業および大企業)、モニタリングタイプ(APIモニタリング、SaaSアプリケーションモニタリング、モバイルアプリケーションモニタリング、およびWebアプリケーションモニタリング)、業界(BFSI、政府機関、小売、ヘルスケア、ITおよび通信、およびその他の業界)、および地理
- ステータス : 公開されたデータ
- レポートコード : TIPRE00010358
- カテゴリー : テクノロジー、メディア、通信
- ページ数 : 150
- 利用可能なレポート形式 :


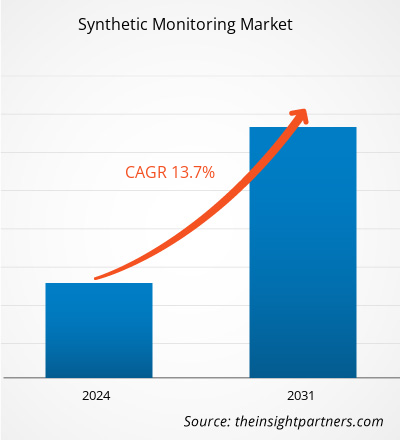
合成モニタリング市場規模は、2023 年の 30.3 億米ドルから 2031 年には 84.7 億米ドルに達すると予測されています。市場は 2023 年から 2031 年にかけて 13.7% の CAGR を記録すると予想されています。クラウド導入の増加とデジタル化の進展は、合成モニタリング市場の動向にとって引き続き重要な鍵となるでしょう。
合成モニタリング市場分析
財政援助、インセンティブ、イニシアチブの提供による中小企業のビジネス能力の向上に対する政府の支援は、合成監視ソリューションなどのソフトウェア ソリューションの採用に貢献できます。クラウド市場の成長は、合成監視市場を牽引する主な要因の 1 つです。クラウドはコスト効率の高いソリューションであり、多くの大企業や中小企業によるクラウドベースの合成監視ソリューションの採用につながり、合成監視市場をさらに牽引しています。
合成モニタリング市場の概要
合成モニタリングとは、ソフトウェアを使用してユーザーとシステムのやりとりをシミュレートすることです。シミュレートされたトランザクションから収集されたデータは、システムの動作を判断するために分析されます。たとえば、合成モニタリングを使用して、Web サイトが目的のページ読み込み、応答時間、および稼働時間を達成しているかどうかを判断できます。
要件に合わせてレポートをカスタマイズする
このレポートの一部、国レベルの分析、Excelデータパックなど、あらゆるレポートを無料でカスタマイズできます。また、スタートアップや大学向けのお得なオファーや割引もご利用いただけます。
合成モニタリング市場:戦略的洞察
-
このレポートの主要な市場動向を入手してください。この無料サンプルには、市場動向から見積もりや予測に至るまでのデータ分析が含まれます。
合成モニタリング市場の推進要因と機会
市場を有利にする合成モニタリングの利点
合成監視ソリューションを使用すると、エンドユーザーは、実際のユーザーがシステムとやり取りする前に、システムがユーザー要求にどのように応答するかを予測できます。合成監視を使用すると、エンドユーザーは、システムが実稼働前にパフォーマンスと可用性の要件を満たしているかどうかを検証できます。この点で、合成監視はプロアクティブな監視を可能にします。さらに、合成監視は、実際のユーザーが開始したトランザクションから収集されたデータではキャプチャされない可能性のある異常な要求や頻度の低い要求に対するシステムの応答を評価するのに役立ちます。したがって、合成監視は、システムのパフォーマンスを検証し、エンドユーザーのエクスペリエンスに影響を与える前に潜在的な問題を特定するのに役立ちます。合成監視により、プロアクティブな監視が可能になり、実稼働アプリケーションに支障が出る前にパフォーマンスと可用性の問題に対処できるため、エンドユーザーは顧客エクスペリエンスを向上させることができます。
成長する中小企業市場SMEs market
企業は合成監視ツールを使用してエンタープライズ アプリケーションを監視し、複数の顧客アクティビティをシミュレートすることで、重要なビジネス トランザクションの稼働時間と全体的なパフォーマンスに関する情報を提供します。これらのツールを使用すると、企業は全体的なエンド ユーザー エクスペリエンスに影響を与える可能性のあるパフォーマンス ギャップを埋めることができます。このように、デジタル化の拡大と中小企業に対する政府の支援により、中小企業はソフトウェア ソリューションを導入してワークフローの効率を高めることができます。さらに、全体的な運用効率とエンド ユーザー エクスペリエンスを向上させるデジタル変革のトレンドにより、今後さらに多くの中小企業が合成監視ソリューションを導入するでしょう。
合成モニタリング市場レポートのセグメンテーション分析
総合的な監視市場分析の導出に貢献した主要なセグメントは、インクの展開、組織の規模、監視の種類、および業界です。
- 展開別に見ると、市場はオンプレミスとクラウドに分かれています。クラウドセグメントは最も高い CAGR で成長すると予想されています。
- 組織規模に基づいて、市場は中小企業と大企業に分割されています。中小企業セグメントは、最も高い CAGR で成長すると予想されています。
- 監視タイプ別に見ると、市場は API 監視、SaaS アプリケーション監視、モバイル アプリケーション監視、Web アプリケーション監視に分類されます。2023 年には API 監視セグメントが最大の市場シェアを占めました。
- 業界別に見ると、市場は BFSI、政府、小売、ヘルスケア、IT および通信、その他の業界に分類されています。小売部門は最も高い CAGR で成長すると予想されています。
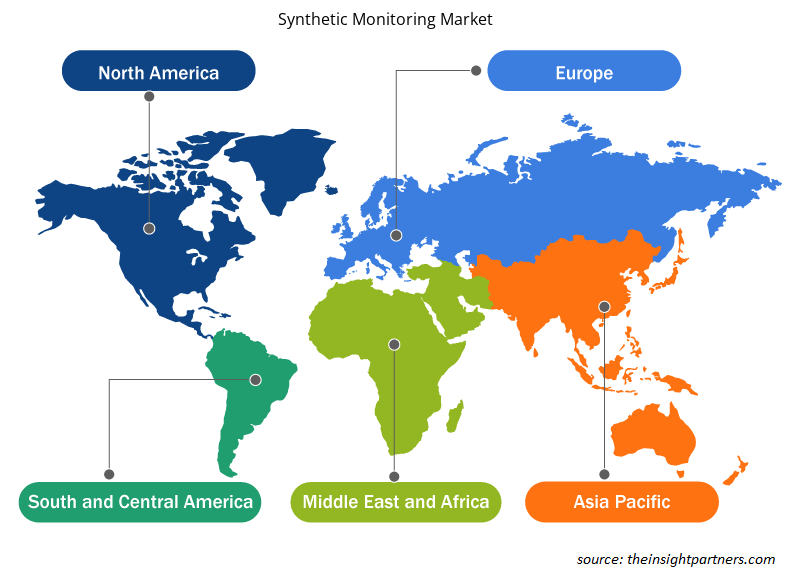
地域別の合成モニタリング市場シェア分析
合成モニタリング市場レポートの地理的範囲は、主に北米、アジア太平洋、ヨーロッパ、中東およびアフリカ、南米/中南米の 5 つの地域に分かれています。
アジア太平洋地域は、最も高い CAGR で成長すると予想されています。この地域でのクラウド テクノロジーの普及は、この地域の市場成長につながります。この地域の中小企業の成長は、この地域でのソフトウェア ソリューションの需要を刺激し、合成監視テクノロジーの使用を促進します。インドや中国などの新興経済国におけるデジタル変革は、さまざまなエンド ユーザー業界で合成監視ソリューションの採用につながります。
合成モニタリング市場の地域別洞察
予測期間を通じて合成モニタリング市場に影響を与える地域的な傾向と要因は、Insight Partners のアナリストによって徹底的に説明されています。このセクションでは、北米、ヨーロッパ、アジア太平洋、中東およびアフリカ、南米および中米にわたる合成モニタリング市場のセグメントと地理についても説明します。
- 合成モニタリング市場の地域別データを入手
合成モニタリング市場レポートの範囲
| レポート属性 | 詳細 |
|---|---|
| 2023年の市場規模 | 30億3千万米ドル |
| 2031年までの市場規模 | 84億7千万米ドル |
| 世界のCAGR(2023年~2031年) | 13.7% |
| 履歴データ | 2021-2022 |
| 予測期間 | 2024-2031 |
| 対象セグメント |
展開別
|
| 対象地域と国 |
北米
|
| 市場リーダーと主要企業プロフィール |
|
合成モニタリング市場のプレーヤー密度:ビジネスダイナミクスへの影響を理解する
合成モニタリング市場は、消費者の嗜好の変化、技術の進歩、製品の利点に対する認識の高まりなどの要因により、エンドユーザーの需要が高まり、急速に成長しています。需要が高まるにつれて、企業は提供を拡大し、消費者のニーズを満たすために革新し、新たなトレンドを活用し、市場の成長をさらに促進しています。
市場プレーヤー密度とは、特定の市場または業界内で活動している企業または会社の分布を指します。これは、特定の市場スペースに、その市場規模または総市場価値に対してどれだけの競合相手 (市場プレーヤー) が存在するかを示します。
合成モニタリング市場で事業を展開している主要企業は次のとおりです。
- アピカ
- AppDynamics LLC
- ブロードコム株式会社
- ダイナトレースLLC。
- eGイノベーションズ株式会社
- IBMコーポレーション
免責事項:上記の企業は、特定の順序でランク付けされていません。
- 合成モニタリング市場のトップキープレーヤーの概要を入手
合成モニタリング市場のニュースと最近の動向
合成モニタリング市場は、重要な企業出版物、協会データ、データベースを含む一次調査および二次調査後の定性的および定量的データを収集することによって評価されます。以下は、市場の動向の一覧です。
- 2023 年 7 月、Google は合成モニタリングを導入しました。これは、自動化された Node.js スクリプトを使用して、アプリケーションまたはサービスに対するユーザーのインタラクションをシミュレートする新しいプロアクティブなモニタリング機能です。これにより、実際のユーザーの視点から、Web アプリケーション、API、主要なビジネス ワークフローの可用性、一貫性、パフォーマンスを定期的にテストできます。2023 年 11 月、Google は合成モニタリングの一般提供を発表しました。さらに、このリリースでは、合成モニタリングの新機能も組み込まれました。(出典: Google、プレスリリース、2023 年)
- 2022 年 3 月、Synthetic API Monitoring により AppDynamics Synthetic Monitoring が拡張され、ITOps と DevOps が強化され、API のパフォーマンスと可用性の問題がビジネス成果とユーザー エクスペリエンスに与える影響を最小限に抑えられるようになりました。(出典: AppDynamics、プレス リリース、2022 年)
合成モニタリング市場レポートの対象範囲と成果物
「合成モニタリング市場規模と予測(2021〜2031年)」レポートでは、以下の分野をカバーする市場の詳細な分析を提供しています。
- 対象範囲に含まれるすべての主要市場セグメントの世界、地域、国レベルでの市場規模と予測
- 市場の動向(推進要因、制約、主要な機会など)
- 今後の主な動向
- 詳細なPEST/ポーターの5つの力とSWOT分析
- 主要な市場動向、主要プレーヤー、規制、最近の市場動向を網羅した世界および地域の市場分析
- 市場集中、ヒートマップ分析、主要プレーヤー、最近の動向を網羅した業界の状況と競争分析
- 詳細な企業プロフィール

アンキタは、テクノロジー、メディア、ICT、エレクトロニクス・半導体の各分野で8年以上の経験を持つ、ダイナミックな市場調査およびコンサルティングのプロフェッショナルです。Microsoft、Oracle、NEC、SAP、KPMG、Expeditors Internationalといったグローバルクライアントに対し、100件以上のコンサルティングおよび調査案件を主導・遂行してきました。彼女のコアコンピテンシーは、市場評価、データ分析、予測、戦略策定、競合情報、レポート作成です。
アンキタは、販売前の提案書作成やクライアントとの協議から、販売後の実用的なインサイトの提供まで、プロジェクトサイクル全体を巧みに管理することに長けています。彼女は、部門横断的なチームの管理、複雑な調査モジュールの構築、そしてクライアント固有のビジネス目標に合わせたソリューションの調整に長けています。優れたコミュニケーション能力、リーダーシップ、そしてプレゼンテーション能力により、急速に変化する市場環境において、常に価値主導の成果を生み出しています。
- 過去2年間の分析、基準年、CAGRによる予測(7年間)
- PEST分析とSWOT分析
- 市場規模価値/数量 - 世界、地域、国
- 業界と競争環境
- Excel データセット
お客様の声
Insight PartnersのSCADAシステム市場レポートは包括的で、現在のトレンドと将来の予測に関する貴重な洞察が含まれています。チームは終始、非常にプロフェッショナルで、対応が早く、サポートも充実していました。私たちは彼らのサービスに非常に満足しており、強くお勧めします。
ラン・ケデム パートナー, レアリテクノロジーズ株式会社非常に特殊なソフトウェア市場に関するレポートを依頼したところ、チームは数日でレポートを作成してくれました。情報は非常に関連性が高く、分かりやすくまとめられていました。その後、レポートにいくつか修正と追加を依頼しましたが、チームは非常に迅速に対応し、1週間も経たないうちに最終レポートを受け取ることができました。
ジャン=エルヴェ・ジェン 会長, フューチャー・アナリティカ重要な市場調査と予測のために、The Insight Partnersと協力しました。彼らは機会とリスクに関する明確な洞察を提供し、私たちの計画策定に役立ちました。彼らの調査は使いやすく、確かなデータに基づいており、賢明で自信に満ちた意思決定に役立ちました。彼らを強くお勧めします。
ピユーシュ・ナグパル 上級副社長, ハイビームグローバルInsight Partnersは、深い専門知識に基づき、洞察力に富み、構造化された市場調査を提供しました。チームは終始プロフェッショナルで、対応力も抜群でした。ユーザーフレンドリーなウェブサイトにより、業界レポートへのアクセスもスムーズでした。信頼性の高い高品質な調査サービスをお探しなら、Insight Partnersを強くお勧めします。
安達幸彦 最高経営責任者(CEO), ディープブルーLLC。The Insight Partnersから市場レポートを購入するのは今回が初めてです。最初は不安でしたが、ウェブサイトを見て、リスクを負ってでも購入してみようという気持ちになりました。レポートの品質とカスタマーサービスには大変満足しています。最初のレポートにはいくつか質問やコメントがありましたが、アナリストとメールで何度かやり取りした結果、戦略策定プロセスへのインプットとして活用できるレポートが完成しました。貴重なお時間を割いていただき、貴重な体験をさせていただき、誠にありがとうございました。他の方にもぜひお勧めしたいですし、今後さらに市場データが必要になった際には、まずThe Insight Partnersにご連絡させていただきます。
ジョン・スズキ 社長兼最高経営責任者、取締役, BKテクノロジーズナイジェリアの感染症IVD市場に関する情報提供依頼に対し、ご対応いただいた際、ご尽力とプロフェッショナルな姿勢に深く感謝申し上げます。忍耐強く、的確なアドバイスをいただき、また、最終的に取引成立に至った割引のご提供にも深く感謝申し上げます。今回の最初の出会いで得た強い印象のおかげで、今後もThe Insight Partnersとの連携を心待ちにしております。
チジオケ博士 オニア マネージングディレクター, パインクレストヘルスケア株式会社購入理由
- 情報に基づいた意思決定
- 市場動向の理解
- 競合分析
- 顧客インサイト
- 市場予測
- リスク軽減
- 戦略計画
- 投資の正当性
- 新興市場の特定
- マーケティング戦略の強化
- 業務効率の向上
- 規制動向への対応


 無料サンプルを入手 - 合成モニタリング市場