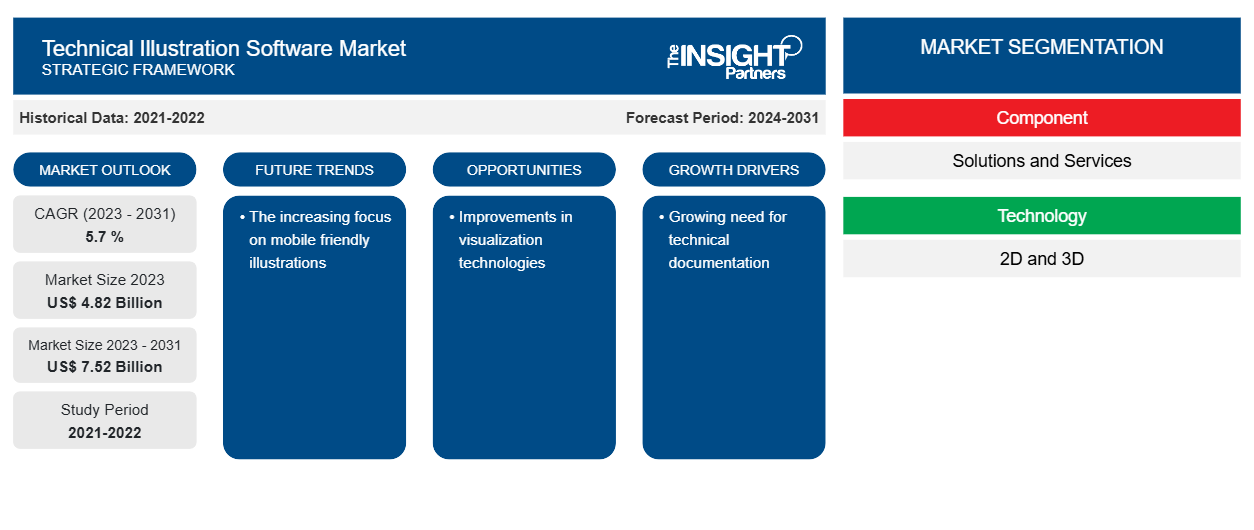
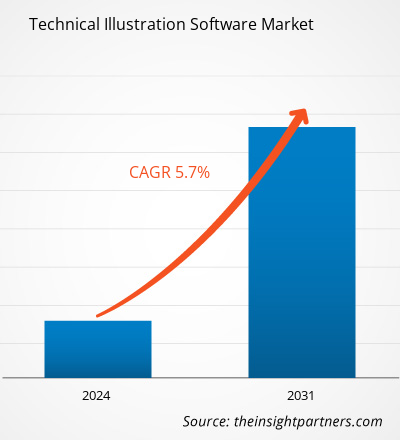
テクニカルイラストレーションソフトウェアの市場規模は、2023年の48億2,000万米ドルから2031年には75億2,000万米ドルに達すると予測されています。市場は2023年から2031年にかけて5.7%のCAGRを記録すると予想されています。モバイルフレンドリーなイラストレーションへの注目が高まることは、テクニカルイラストレーション ソフトウェア市場の主要なトレンドであり続けると思われます。
テクニカルイラストレーションソフトウェア市場分析
テクニカルイラストレーション用ソフトウェア この市場は、拡大するエンターテインメント業界と、さまざまな業界の起業家エコシステムの変化によって牽引されています。イラストレーターは、テクニカルイラストレーション ソフトウェアを使用することで、設定された時間制限内でテクノロジー製品をより簡単にデザインできます。さらに、多くのソフトウェア ベンダーは、通常リソースが限られている中小企業でも簡単に購入できる手頃な価格のオプションを提供しています。市場に無料ツールが豊富にあることが主な障害です。しかし、イラストレーターは複雑な技術製品をデザインするためにこれらの無料ツールを必要としますが、イラストレーターにはこれらのツールが要求する包括的な機能と能力が欠けています。そのため、企業は無料のソリューションが利用可能であるにもかかわらず、独自のソフトウェアの購入にお金を費やし続けています。
テクニカルイラストレーションソフトウェア市場の概要
テクニカル イラストレーション ソフトウェアには、科学や医学の技術図面や製品写真が含まれています。このプログラムには、イラストレーターが技術製品を開発するために必要な機能が多数備わっています。このプログラムは、2D と 3D の両方の設計開発に役立ちます。プロジェクトの設計と作成から技術文書の発行まで、複雑なテクニカル グラフィックスを完全な制御と精度で作成できます。このプログラムは主に、機械製造と医療機器の技術図面で使用されます。テクニカル イラストレーション ソフトウェアは、余分な詳細を排除します。さらに、このソフトウェアでは、イラストレーションの目的をさらに進めるために、いくつかのスタイル要素を芸術的に自由に適用できます。
要件に合わせてレポートをカスタマイズする
このレポートの一部、国レベルの分析、Excelデータパックなど、あらゆるレポートを無料でカスタマイズできます。また、スタートアップや大学向けのお得なオファーや割引もご利用いただけます。
- このレポートの主要な市場動向を入手してください。この無料サンプルには、市場動向から見積もりや予測に至るまでのデータ分析が含まれます。
テクニカルイラストレーションソフトウェア市場の推進要因と機会
技術文書の必要性の高まり
自動車、航空宇宙、防衛、製造、医療の各分野は、明確で正確な技術文書の必要性が高まっている多くの成長産業の 1 つです。技術マニュアル、組み立て手順書、ユーザー ガイドはすべて、テクニカル イラストレーション ソフトウェアを使用して作成された複雑な回路図、図表、画像から恩恵を受けることができます。
可視化技術の向上
3D レンダリング、拡張現実 (AR)、仮想現実 (VR) などの視覚化技術の絶え間ない進歩により、テクニカル イラストレーション ソフトウェアの需要が高まっています。これらの技術により、ユーザーはダイナミックで興味深い視覚化を作成し、複雑な技術プロセスのコミュニケーションと理解を向上させることができます。したがって、IoT の採用の増加により、予測期間中にテクニカル イラストレーション ソフトウェア市場のプレーヤーに新たな機会がもたらされると予想されます。
テクニカルイラストレーションソフトウェア市場レポートのセグメンテーション分析
テクニカルイラストレーション ソフトウェア市場分析の導出に貢献した主要なセグメントは、コンポーネントとエンド ユーザーです。
- コンポーネントに基づいて、テクニカルイラストレーション ソフトウェア市場はソリューションとサービスに分類されます。
- 組織規模別に見ると、市場は中小企業と大企業に分かれています。大企業セグメントは2023年に大きな市場シェアを占めました。
- テクノロジー別に見ると、市場は 2D と 3D に分かれています。
- エンドユーザー別に見ると、市場は製造、航空宇宙および防衛、自動車、ヘルスケア、エネルギーおよび電力、その他に分類されます。
テクニカルイラストレーションソフトウェアの地域別市場シェア分析
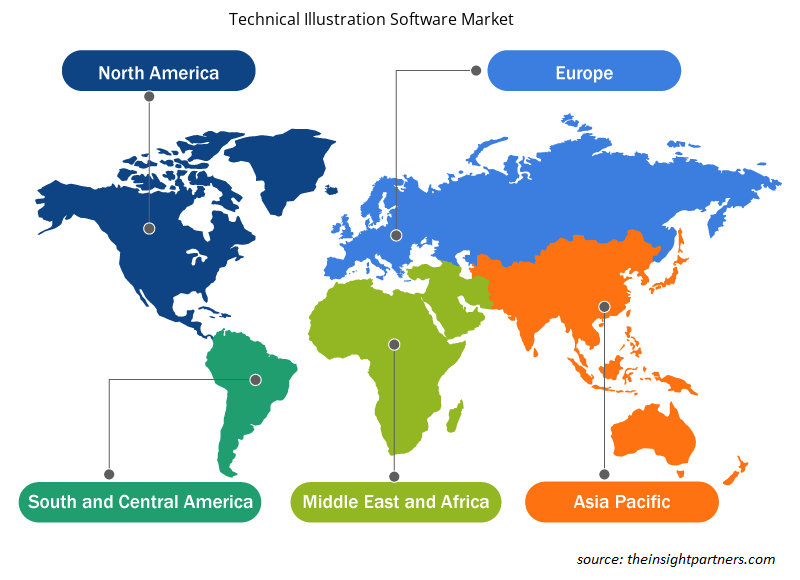
テクニカル イラストレーション ソフトウェア市場レポートの地理的範囲は、主に北米、アジア太平洋、ヨーロッパ、中東およびアフリカ、南米/中南米の 5 つの地域に分かれています。収益の面では、北米がテクニカル イラストレーション ソフトウェア市場で最大のシェアを占めています。航空宇宙および軍事、製造、ヘルスケア業界の企業による完全なテクニカル イラストレーション ソフトウェア ソリューションに対する継続的なニーズが、市場の拡大を推進する要因の 1 つです。
テクニカルイラストレーションソフトウェア市場の地域別分析
予測期間を通じてテクニカルイラストレーションソフトウェア市場に影響を与える地域的な傾向と要因は、Insight Partners のアナリストによって徹底的に説明されています。このセクションでは、北米、ヨーロッパ、アジア太平洋、中東およびアフリカ、南米および中米にわたるテクニカルイラストレーションソフトウェア市場のセグメントと地域についても説明します。

- テクニカルイラストレーションソフトウェア市場の地域別データを入手
テクニカルイラストレーションソフトウェア市場レポートの範囲
レポート属性 | 詳細 |
---|---|
2023年の市場規模 | 48.2億米ドル |
2031年までの市場規模 | 75億2千万米ドル |
世界のCAGR(2023年~2031年) | 5.7 % |
履歴データ | 2021-2022 |
予測期間 | 2024-2031 |
対象セグメント | コンポーネント別
|
対象地域と国 | 北米
|
市場リーダーと主要企業プロフィール |
|
テクニカルイラストレーションソフトウェア市場のプレーヤー密度:ビジネスダイナミクスへの影響を理解する
テクニカルイラストレーションソフトウェア市場は、消費者の嗜好の変化、技術の進歩、製品の利点に対する認識の高まりなどの要因により、エンドユーザーの需要が高まり、急速に成長しています。需要が高まるにつれて、企業は提供内容を拡大し、消費者のニーズを満たすために革新し、新たなトレンドを活用し、市場の成長をさらに促進しています。
市場プレーヤー密度とは、特定の市場または業界内で活動している企業または会社の分布を指します。これは、特定の市場スペースに、その規模または総市場価値と比較して、どれだけの競合相手 (市場プレーヤー) が存在するかを示します。
テクニカルイラストレーションソフトウェア市場で事業を展開している主要企業は次のとおりです。
- ASA コンピューター株式会社
- オートデスク株式会社
- キャンバスGFX株式会社
- コーレル株式会社
- サイエント株式会社
- ダッソー・システムズ
免責事項:上記の企業は、特定の順序でランク付けされていません。

- テクニカルイラストレーションソフトウェア市場のトップキープレーヤーの概要を入手
テクニカルイラストレーションソフトウェア市場のニュースと最近の動向
テクニカル イラストレーション ソフトウェア市場は、主要な企業出版物、協会データ、データベースなどの一次および二次調査後の定性的および定量的データを収集することによって評価されます。以下は、音声および言語障害と戦略の市場における動向の一覧です。
- 2021 年 1 月、Tech Soft 3D は、Canvas GFX が HOOPS プラットフォームを使用して、最新製品である Canvas X3 に 3D CAD モデル機能を追加すると発表しました。これは、すべての主要な 3D CAD パッケージで作成されたファイルを含む 90 を超えるファイル形式でデータをインポートできる強力な新製品です。(出典: Tech Soft 3D、プレスリリース)
- 2021 年 1 月、大手テクニカル イラストレーション ソフトウェア プロバイダーである Canvas GFX, Inc. は、最新製品である Canvas X3 CADComposer の商用リリースを発表しました。(出典: Canvas GFX, Inc、プレス リリース)
テクニカルイラストレーションソフトウェア市場レポートの対象範囲と成果物
「テクニカルイラストレーションソフトウェア市場の規模と予測(2021〜2031年)」レポートでは、以下の分野をカバーする市場の詳細な分析を提供しています。
- 対象範囲に含まれるすべての主要市場セグメントの世界、地域、国レベルでの市場規模と予測
- 市場の動向(推進要因、制約、主要な機会など)
- 今後の主な動向
- 詳細なPEST/ポーターの5つの力とSWOT分析
- 主要な市場動向、主要プレーヤー、規制、最近の市場動向を網羅した世界および地域の市場分析
- 市場集中、ヒートマップ分析、主要プレーヤー、最近の動向を網羅した業界の状況と競争分析
- 詳細な企業プロフィール
よくある質問
The global technical illustration software market was estimated to be US$ 4.82 billion in 2023 and is expected to grow at a CAGR of 5.7 % during the forecast period 2023 - 2031.
The growing need for technical documentation and improvements in visualization technologies are the major factors that propel the global technical illustration software market.
The increasing focus on mobile friendly illustrations is anticipated to play a significant role in the global technical illustration software market in the coming years.
The key players holding majority shares in the global technical illustration software market are ASA Computers, Inc., Autodesk, Inc., Canvas GFX, Inc., Corel Corporation, and Cyient Ltd.
The global technical illustration software market is expected to reach US$ 7.52 billion by 2031.
- 過去2年間の分析、基準年、CAGRによる予測(7年間)
- PEST分析とSWOT分析
- 市場規模価値/数量 - 世界、地域、国
- 業界と競争環境
- Excel データセット
お客様の声
購入理由
- 情報に基づいた意思決定
- 市場動向の理解
- 競合分析
- 新興市場の特定
- 顧客インサイト
- 市場予測
- リスク軽減
- 業務効率の向上
- 戦略計画
- 投資の正当性
- 業界イノベーションの追跡
- 規制動向への対応
はい!レポートの範囲(目次)、レポートの構成、そしてレポート全体の価値を評価するのに役立つ厳選されたインサイトを含む、レポートの無料サンプルをご提供しています。 「サンプルをダウンロード」ボタンをクリックするか、お問い合わせの上、サンプルをお送りください。
はい、アナリストによるサポートはパッケージに含まれています。ご購入後、アナリストにご連絡いただき、レポートの洞察や手法についてご説明したり、調査結果がお客様のビジネスニーズにどのように当てはまるかご相談いただけます。
ご注文が完了すると、確認メールと請求書が届きます。
• 公開済みレポートの場合:4~6営業時間以内に、セキュリティ保護されたメールがお客様のメールアドレスに送信されます。
• 近日公開予定レポートの場合:ご注文は事前予約として記録されます。リリース予定日については、担当チームからご連絡し、最新情報をお知らせいたします。レポートが公開され次第、ご登録いただいたメールアドレスに配信いたします。
お客様の特定の目的に合わせてレポートをカスタマイズするためのオプションをご用意しております。特定の地域、業界セグメント、競合他社の分析、データカットなど、より深い洞察が必要な場合でも、当社のリサーチチームがそれに応じてレポートをカスタマイズいたします。ご要望をお聞かせください。お客様に合わせたご提案やスコープを喜んでご提供いたします。
レポートは、選択したライセンスに応じて、PDF形式またはExcelデータセットで提供されます。
PDF版では、完全な分析とビジュアルがすぐに読める形式で提供されます。Excelデータセットには、すべてのデータテーブルが含まれており、簡単に操作して詳細な分析を行うことができます。
ご購入時にライセンスオプションをご確認ください。または、ご購入に含まれる形式を確認するには、お問い合わせください。
当社の決済プロセスは完全に安全で、PCI-DSSに準拠しています。
当社は、すべての取引が業界標準のSSL暗号化で保護されるよう、信頼性の高い暗号化された決済ゲートウェイを使用しています。お支払い情報は当社のサーバーに保存されることはありません。認定されたサードパーティの決済代行業者によって安全に処理されます。
お客様の個人情報と財務情報は当社で安全に保管されますので、安心してご購入いただけます。
はい、まとめ買いの場合は特別価格をご用意しております。
複数のレポートをご購入いただく場合は、お客様のニーズに合わせてカスタマイズされたバンドルオファーまたは数量ベースの割引をご提供いたします。ご検討中のレポートのリストを弊社の営業チームまでお送りください。お客様に合わせたお見積もりをお送りいたします。
はい、もちろんです。
弊社のチームが、お客様が十分な情報に基づいて意思決定できるようお手伝いいたします。レポートの範囲、方法論、カスタマイズオプション、最適なライセンスなど、ご質問がございましたら、お気軽にお問い合わせください。 sales@theinsightpartners.com までご連絡ください。担当者が速やかにご連絡いたします。
はい、ご購入が完了すると請求書が自動的に生成され、ご登録いただいたメールアドレスに送信されます。
特定の形式で請求書が必要な場合や、追加情報(会社名、GST、VAT情報など)が必要な場合は、お気軽にお問い合わせください。喜んでご対応させていただきます。
はい、もちろんです。
レポートへのアクセスや受信に問題が発生した場合は、サポートチームがサポートいたします。ご注文情報を添えて、メールまたはライブチャットでお問い合わせください。問題を迅速に解決し、お客様が中断することなくレポートにアクセスできるようお手伝いいたします。


The Insight Partners performs research in 4 major stages: Data Collection & Secondary Research, Primary Research, Data Analysis and Data Triangulation & Final Review.
- Data Collection and Secondary Research:
As a market research and consulting firm operating from a decade, we have published and advised several client across the globe. First step for any study will start with an assessment of currently available data and insights from existing reports. Further, historical and current market information is collected from Investor Presentations, Annual Reports, SEC Filings, etc., and other information related to company’s performance and market positioning are gathered from Paid Databases (Factiva, Hoovers, and Reuters) and various other publications available in public domain.
Several associations trade associates, technical forums, institutes, societies and organization are accessed to gain technical as well as market related insights through their publications such as research papers, blogs and press releases related to the studies are referred to get cues about the market. Further, white papers, journals, magazines, and other news articles published in last 3 years are scrutinized and analyzed to understand the current market trends.
- Primary Research:
The primarily interview analysis comprise of data obtained from industry participants interview and answers to survey questions gathered by in-house primary team.
For primary research, interviews are conducted with industry experts/CEOs/Marketing Managers/VPs/Subject Matter Experts from both demand and supply side to get a 360-degree view of the market. The primary team conducts several interviews based on the complexity of the markets to understand the various market trends and dynamics which makes research more credible and precise.
A typical research interview fulfils the following functions:
- Provides first-hand information on the market size, market trends, growth trends, competitive landscape, and outlook
- Validates and strengthens in-house secondary research findings
- Develops the analysis team’s expertise and market understanding
Primary research involves email interactions and telephone interviews for each market, category, segment, and sub-segment across geographies. The participants who typically take part in such a process include, but are not limited to:
- Industry participants: VPs, business development managers, market intelligence managers and national sales managers
- Outside experts: Valuation experts, research analysts and key opinion leaders specializing in the electronics and semiconductor industry.
Below is the breakup of our primary respondents by company, designation, and region:
Once we receive the confirmation from primary research sources or primary respondents, we finalize the base year market estimation and forecast the data as per the macroeconomic and microeconomic factors assessed during data collection.
- Data Analysis:
Once data is validated through both secondary as well as primary respondents, we finalize the market estimations by hypothesis formulation and factor analysis at regional and country level.
- Macro-Economic Factor Analysis:
We analyse macroeconomic indicators such the gross domestic product (GDP), increase in the demand for goods and services across industries, technological advancement, regional economic growth, governmental policies, the influence of COVID-19, PEST analysis, and other aspects. This analysis aids in setting benchmarks for various nations/regions and approximating market splits. Additionally, the general trend of the aforementioned components aid in determining the market's development possibilities.
- Country Level Data:
Various factors that are especially aligned to the country are taken into account to determine the market size for a certain area and country, including the presence of vendors, such as headquarters and offices, the country's GDP, demand patterns, and industry growth. To comprehend the market dynamics for the nation, a number of growth variables, inhibitors, application areas, and current market trends are researched. The aforementioned elements aid in determining the country's overall market's growth potential.
- Company Profile:
The “Table of Contents” is formulated by listing and analyzing more than 25 - 30 companies operating in the market ecosystem across geographies. However, we profile only 10 companies as a standard practice in our syndicate reports. These 10 companies comprise leading, emerging, and regional players. Nonetheless, our analysis is not restricted to the 10 listed companies, we also analyze other companies present in the market to develop a holistic view and understand the prevailing trends. The “Company Profiles” section in the report covers key facts, business description, products & services, financial information, SWOT analysis, and key developments. The financial information presented is extracted from the annual reports and official documents of the publicly listed companies. Upon collecting the information for the sections of respective companies, we verify them via various primary sources and then compile the data in respective company profiles. The company level information helps us in deriving the base number as well as in forecasting the market size.
- Developing Base Number:
Aggregation of sales statistics (2020-2022) and macro-economic factor, and other secondary and primary research insights are utilized to arrive at base number and related market shares for 2022. The data gaps are identified in this step and relevant market data is analyzed, collected from paid primary interviews or databases. On finalizing the base year market size, forecasts are developed on the basis of macro-economic, industry and market growth factors and company level analysis.
- Data Triangulation and Final Review:
The market findings and base year market size calculations are validated from supply as well as demand side. Demand side validations are based on macro-economic factor analysis and benchmarks for respective regions and countries. In case of supply side validations, revenues of major companies are estimated (in case not available) based on industry benchmark, approximate number of employees, product portfolio, and primary interviews revenues are gathered. Further revenue from target product/service segment is assessed to avoid overshooting of market statistics. In case of heavy deviations between supply and demand side values, all thes steps are repeated to achieve synchronization.
We follow an iterative model, wherein we share our research findings with Subject Matter Experts (SME’s) and Key Opinion Leaders (KOLs) until consensus view of the market is not formulated – this model negates any drastic deviation in the opinions of experts. Only validated and universally acceptable research findings are quoted in our reports.
We have important check points that we use to validate our research findings – which we call – data triangulation, where we validate the information, we generate from secondary sources with primary interviews and then we re-validate with our internal data bases and Subject matter experts. This comprehensive model enables us to deliver high quality, reliable data in shortest possible time.