
Informe de mercado de software de ilustración técnica 2031 por segmentos, geografía, dinámica, desarrollos recientes e ideas estratégicas
Informe sobre el tamaño y pronóstico del mercado de software de ilustración técnica (2021-2031), participación global y regional, tendencias y oportunidades de crecimiento. Cobertura: por componente (soluciones y servicios); tecnología (2D y 3D); tamaño de la organización (pymes y grandes empresas); usuario final (manufactura, aeroespacial y defensa, automoción, salud, energía y electricidad, entre otros) y geografía.
- Estado : Datos publicados
- Código de informe : TIPRE00007002
- Categoría : Tecnología, medios y telecomunicaciones
- Número de páginas : 150
- Formatos de informe disponibles :


- Fecha de última actualización : February 15, 2025

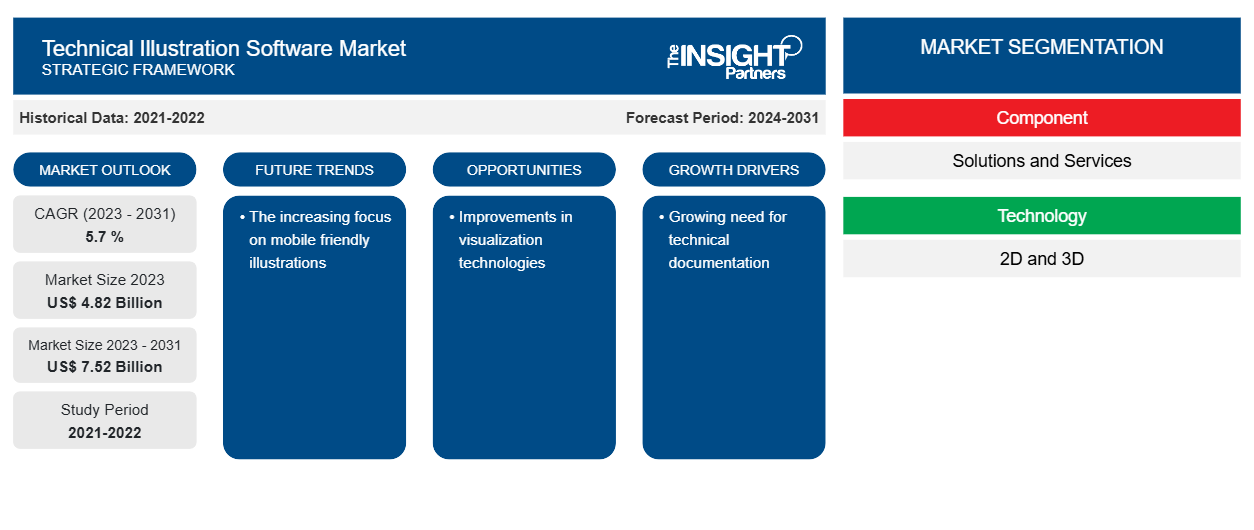
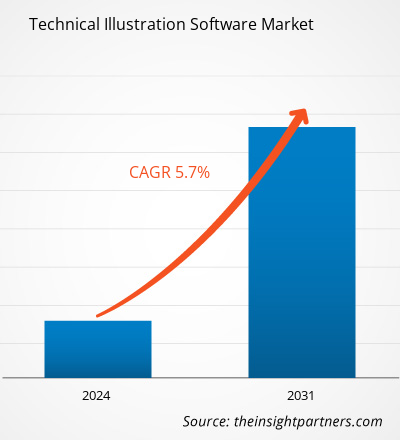
Se proyecta que el tamaño del mercado de software de ilustración técnica alcance los 7.520 millones de dólares estadounidenses para 2031, desde los 4.820 millones de dólares estadounidenses en 2023. Se espera que el mercado registre una CAGR del 5,7 % entre 2023 y 2031.Es probable que el enfoque creciente en ilustraciones adaptadas a dispositivos móviles siga siendo una tendencia clave en el mercado del software de ilustración técnica.
Análisis del mercado de software de ilustración técnica
Software para ilustración técnica El mercado está impulsado por la expansión de los sectores verticales del entretenimiento y el cambiante ecosistema empresarial de los diferentes sectores verticales. Los ilustradores pueden diseñar más fácilmente productos tecnológicos en un plazo determinado utilizando software de ilustración técnica. Además, muchos proveedores de software ofrecen opciones asequibles que las pequeñas y medianas empresas, que normalmente tienen recursos limitados, pueden comprar fácilmente. La abundancia de herramientas gratuitas en el mercado es el principal obstáculo. Sin embargo, los ilustradores necesitan estas herramientas gratuitas para diseñar productos técnicos complicados y carecen de las funciones y capacidades integrales que estas herramientas exigen. Por lo tanto, las empresas siguen gastando dinero en la compra de software propietario incluso ante la disponibilidad de soluciones gratuitas.
Descripción general del mercado de software de ilustración técnica
Los dibujos técnicos y las imágenes de productos para la ciencia y la medicina se incluyen en el software de ilustración técnica. El programa tiene una serie de características que los ilustradores necesitan para desarrollar artículos tecnológicos. El programa ayuda al desarrollo de diseños tanto en 2D como en 3D. Desde el diseño y la creación de proyectos hasta la publicación de documentación técnica, permite la creación de gráficos técnicos complejos con un control y una precisión completos. El programa se utiliza principalmente en la fabricación de máquinas y en los dibujos técnicos de equipos médicos. El software de ilustración técnica elimina cualquier detalle adicional. Además, el software permite la libertad artística en la aplicación de varios elementos estilísticos para promover el objetivo de la ilustración.
Personalice este informe según sus necesidades
Obtendrá personalización en cualquier informe, sin cargo, incluidas partes de este informe o análisis a nivel de país, paquete de datos de Excel, así como también grandes ofertas y descuentos para empresas emergentes y universidades.
Mercado de software de ilustración técnica: perspectivas estratégicas
-
Obtenga las principales tendencias clave del mercado de este informe.Esta muestra GRATUITA incluirá análisis de datos, desde tendencias del mercado hasta estimaciones y pronósticos.
Impulsores y oportunidades del mercado del software de ilustración técnica
Creciente necesidad de documentación técnica
Los sectores de la automoción, la aeronáutica , la defensa, la fabricación y la atención sanitaria se encuentran entre las numerosas industrias en expansión que han experimentado un aumento de la necesidad de documentación técnica clara y precisa. Los manuales técnicos, las instrucciones de montaje y las guías de usuario pueden beneficiarse de los esquemas, diagramas e imágenes complejos creados con el uso de software de ilustración técnica.
Mejoras en las tecnologías de visualización
Los avances constantes en la tecnología de visualización, como la representación 3D, la realidad aumentada (RA) y la realidad virtual (RV), están impulsando la demanda de software de ilustración técnica. Estas tecnologías permiten a los usuarios crear visualizaciones dinámicas e interesantes que mejoran la comunicación y la comprensión de procesos tecnológicos complejos. Por lo tanto, se prevé que la creciente adopción de IoT presente nuevas oportunidades para los actores del mercado de software de ilustración técnica durante el período de pronóstico.
Informe de mercado de software de ilustración técnica Análisis de segmentación
Los segmentos clave que contribuyeron a la derivación del análisis del mercado del software de ilustración técnica son los componentes y los usuarios finales.
- Según el componente, el mercado de software de ilustración técnica se segmenta en soluciones y servicios.
- Por tamaño de organización, el mercado se segmenta en pymes y grandes empresas. El segmento de grandes empresas tuvo una mayor participación de mercado en 2023.
- Por tecnología, el mercado está segmentado en 2D y 3D.
- Por usuario final, el mercado está segmentado en manufactura, aeroespacial y defensa, automotriz, atención médica, energía y electricidad, y otros.
Análisis de la cuota de mercado del software de ilustración técnica por geografía
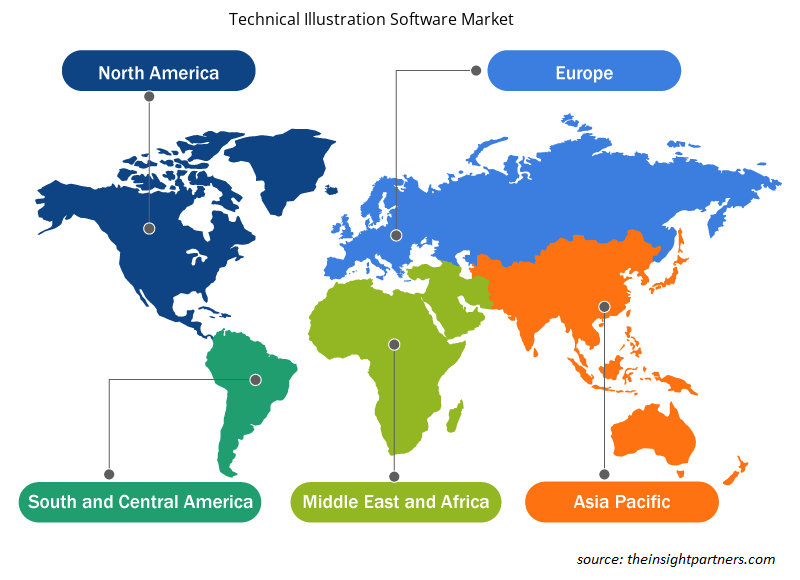
El alcance geográfico del informe de mercado de software de ilustración técnica se divide principalmente en cinco regiones: América del Norte, Asia Pacífico, Europa, Oriente Medio y África, y América del Sur/América del Sur y Central. En términos de ingresos, América del Norte representó la mayor participación de mercado de software de ilustración técnica. La necesidad constante de soluciones completas de software de ilustración técnica por parte de las empresas de los sectores aeroespacial y militar, manufacturero y sanitario es uno de los factores que impulsan la expansión del mercado.
Perspectivas regionales del mercado de software de ilustración técnica
Los analistas de Insight Partners explicaron en detalle las tendencias y los factores regionales que influyen en el mercado de software de ilustración técnica durante el período de pronóstico. Esta sección también analiza los segmentos y la geografía del mercado de software de ilustración técnica en América del Norte, Europa, Asia Pacífico, Oriente Medio y África, y América del Sur y Central.
- Obtenga datos regionales específicos para el mercado de software de ilustración técnica
Alcance del informe de mercado de software de ilustración técnica
| Atributo del informe | Detalles |
|---|---|
| Tamaño del mercado en 2023 | 4.820 millones de dólares estadounidenses |
| Tamaño del mercado en 2031 | 7.520 millones de dólares estadounidenses |
| CAGR global (2023 - 2031) | 5,7 % |
| Datos históricos | 2021-2022 |
| Período de pronóstico | 2024-2031 |
| Segmentos cubiertos |
Por componente
|
| Regiones y países cubiertos |
América del norte
|
| Líderes del mercado y perfiles de empresas clave |
|
Densidad de actores del mercado de software de ilustración técnica: comprensión de su impacto en la dinámica empresarial
El mercado de software de ilustración técnica está creciendo rápidamente, impulsado por la creciente demanda de los usuarios finales debido a factores como la evolución de las preferencias de los consumidores, los avances tecnológicos y una mayor conciencia de los beneficios del producto. A medida que aumenta la demanda, las empresas amplían sus ofertas, innovan para satisfacer las necesidades de los consumidores y aprovechan las tendencias emergentes, lo que impulsa aún más el crecimiento del mercado.
La densidad de actores del mercado se refiere a la distribución de las empresas o firmas que operan dentro de un mercado o industria en particular. Indica cuántos competidores (actores del mercado) están presentes en un espacio de mercado determinado en relación con su tamaño o valor total de mercado.
Las principales empresas que operan en el mercado de software de ilustración técnica son:
- Computadoras ASA, Inc.
- Autodesk, Inc
- Lienzo GFX, Inc.
- Corporación Corel
- Compañía: Cyient Ltd.
- Dassault Sistemas
Descargo de responsabilidad : Las empresas enumeradas anteriormente no están clasificadas en ningún orden particular.
- Obtenga una descripción general de los principales actores clave del mercado de software de ilustración técnica
Noticias y desarrollos recientes del mercado de software de ilustración técnica
El mercado de software de ilustración técnica se evalúa mediante la recopilación de datos cualitativos y cuantitativos posteriores a la investigación primaria y secundaria, que incluye publicaciones corporativas importantes, datos de asociaciones y bases de datos. A continuación, se incluye una lista de los avances en el mercado de los trastornos del habla y el lenguaje y las estrategias:
- En enero de 2021, Tech Soft 3D anunció que Canvas GFX está utilizando la plataforma HOOPS para agregar la funcionalidad de modelo CAD 3D a su producto más reciente, Canvas X3, un nuevo y poderoso producto con la capacidad de importar datos en más de 90 formatos de archivo, incluidos archivos creados en todos los paquetes CAD 3D líderes. (Fuente: Tech Soft 3D, comunicado de prensa)
- En enero de 2021, Canvas GFX, Inc., el proveedor líder de software de ilustración técnica, anunció el lanzamiento comercial de su producto más nuevo, Canvas X3 CADComposer. (Fuente: Canvas GFX, Inc, comunicado de prensa)
Informe sobre el mercado de software de ilustración técnica: cobertura y resultados
El informe “Tamaño y pronóstico del mercado de software de ilustración técnica (2021-2031)” proporciona un análisis detallado del mercado que cubre las siguientes áreas:
- Tamaño del mercado y pronóstico a nivel global, regional y nacional para todos los segmentos clave del mercado cubiertos bajo el alcance
- Dinámica del mercado, como impulsores, restricciones y oportunidades clave
- Principales tendencias futuras
- Análisis detallado de las cinco fuerzas de Porter y PEST y FODA
- Análisis del mercado global y regional que cubre las tendencias clave del mercado, los principales actores, las regulaciones y los desarrollos recientes del mercado.
- Análisis del panorama de la industria y de la competencia que abarca la concentración del mercado, el análisis de mapas de calor, los actores destacados y los desarrollos recientes
- Perfiles detallados de empresas

Ankita es una profesional dinámica en investigación de mercados y consultoría con más de 8 años de experiencia en los sectores de tecnología, medios de comunicación, TIC, electrónica y semiconductores. Ha liderado y ejecutado con éxito más de 100 proyectos de consultoría e investigación para clientes globales como Microsoft, Oracle, NEC Corporation, SAP, KPMG y Expeditors International. Sus principales competencias incluyen la evaluación de mercado, el análisis de datos, la previsión, la formulación de estrategias, la inteligencia competitiva y la redacción de informes.
Ankita es experta en la gestión de ciclos completos de proyecto, desde el diseño de propuestas de preventa y las conversaciones con los clientes hasta la entrega de información práctica posventa. Es experta en la gestión de equipos multifuncionales, la estructuración de módulos de investigación complejos y la alineación de soluciones con los objetivos de negocio específicos del cliente. Sus excelentes habilidades de comunicación, liderazgo y presentación le han permitido obtener constantemente resultados orientados al valor en entornos de mercado dinámicos y en constante evolución.
- Análisis exhaustivo del tamaño del mercado y previsiones
- Análisis detallado de la segmentación
- Evaluación en profundidad de la dinámica del mercado
- Información a nivel regional y nacional
- Panorama competitivo y análisis comparativo de empresas
- Inteligencia empresarial estratégica
Testimonios
El informe de mercado de sistemas SCADA de Insight Partners es completo y ofrece información valiosa sobre las tendencias actuales y las previsiones futuras. El equipo fue altamente profesional, receptivo y me brindó un gran apoyo en todo momento. Estamos muy satisfechos y recomendamos ampliamente sus servicios.
RAN KEDEM Socio, Reali Technologies LTDsSolicité un informe sobre un mercado de software muy específico y el equipo lo elaboró en pocos días. La información era muy relevante y estaba bien presentada. Posteriormente, solicité algunos cambios y adiciones al informe. El equipo fue muy receptivo y recibí el informe final en menos de una semana.
JEAN-HERVE JENN Presidente, Future AnalyticaTrabajamos con The Insight Partners para un importante estudio y pronóstico de mercado. Nos brindaron una visión clara de las oportunidades y los riesgos, lo que nos ayudó a definir nuestros planes. Su investigación fue fácil de usar y se basó en datos sólidos. Nos ayudó a tomar decisiones inteligentes y seguras. Los recomendamos ampliamente.
PIYUSH NAGPAL Vicepresidente Sénior, , High Beam GlobalThe Insight Partners realizó una investigación de mercado profunda y bien estructurada con una sólida experiencia en el sector. Su equipo fue profesional y receptivo en todo momento. El sitio web, fácil de usar, facilitó el acceso a los informes del sector. Los recomendamos ampliamente por sus servicios de investigación confiables y de alta calidad.
YUKIHIKO ADACHI Director Ejecutivo, , Deep Blue, LLCEsta es la primera vez que compro un informe de mercado de The Insight Partners. Aunque al principio tenía dudas, visité su sitio web y me sentí más cómodo al arriesgarme y comprarlo. Estoy completamente satisfecho con la calidad del informe y el servicio al cliente. Tenía varias preguntas y comentarios sobre el informe inicial, pero después de un par de conversaciones por correo electrónico con su analista, creo que tengo un informe que puedo usar como base para nuestro proceso de planificación estratégica. Muchas gracias por tomarse el tiempo y hacer de esta una experiencia positiva. Sin duda, recomendaré sus servicios y serán mi primera opción cuando necesitemos más datos de mercado.
JOHN SUZUKI Presidente y Director Ejecutivo, Director de la Junta Directiva, BK TechnologiesAgradezco su apoyo y la profesionalidad que demostraron al atender mi solicitud de información sobre el mercado de diagnóstico in vitro (IVD) para enfermedades infecciosas en Nigeria. Agradezco su paciencia, su orientación y su disposición a ofrecerme un descuento, lo que finalmente nos permitió cerrar un trato. Espero poder colaborar con The Insight Partners en el futuro, gracias a la impresión que me causó este primer encuentro.
DRA. CHIJIOKE ONYIA, DIRECTORA GENERAL, PineCrest Healthcare Ltd.Razón para comprar
- Toma de decisiones informada
- Comprensión de la dinámica del mercado
- Análisis competitivo
- Información sobre clientes
- Pronósticos del mercado
- Mitigación de riesgos
- Planificación estratégica
- Justificación de la inversión
- Identificación de mercados emergentes
- Mejora de las estrategias de marketing
- Impulso de la eficiencia operativa
- Alineación con las tendencias regulatorias


