Rapporto sul mercato del software di illustrazione tecnica 2031 per segmenti, geografia, dinamiche, sviluppi recenti e approfondimenti strategici
Dati storici : 2021-2022 | Anno base : | Periodo di previsione :Dimensioni e previsioni del mercato del software di illustrazione tecnica (2021-2031), quota globale e regionale, trend e opportunità di crescita. Copertura del rapporto di analisi: per componente (soluzioni e servizi); tecnologia (2D e 3D); dimensioni dell'organizzazione (PMI e grandi imprese); utente finale (produzione, aerospaziale e difesa, automobilistico, sanità, energia e potenza e altri) e geografia.
- Stato : Dati rilasciati
- Codice del report : TIPRE00007002
- Categoria : Tecnologia, media e telecomunicazioni
- Numero di pagine : 150
- Formati di report disponibili :


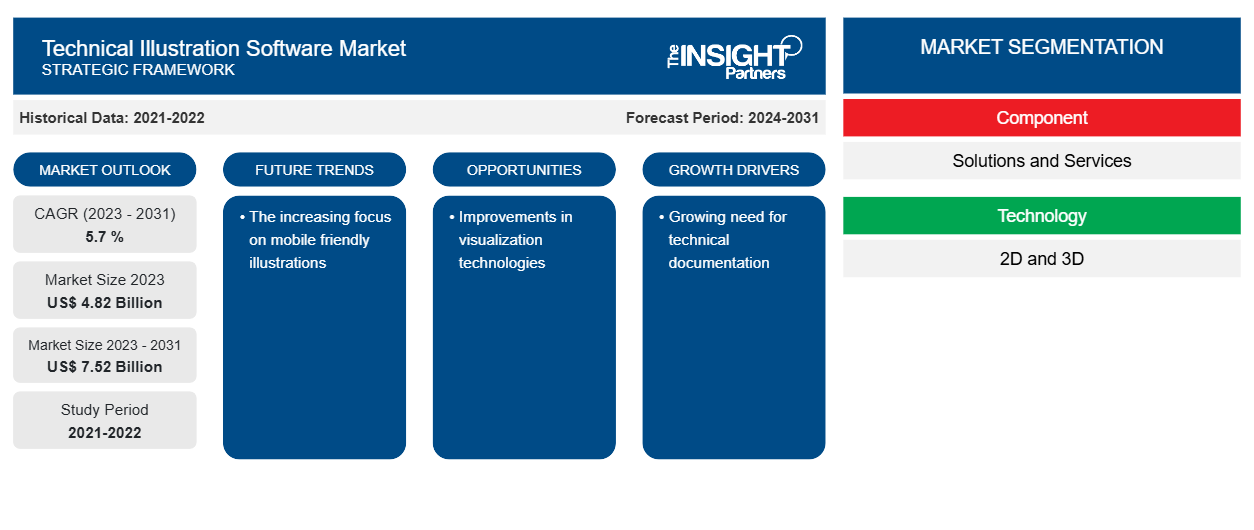
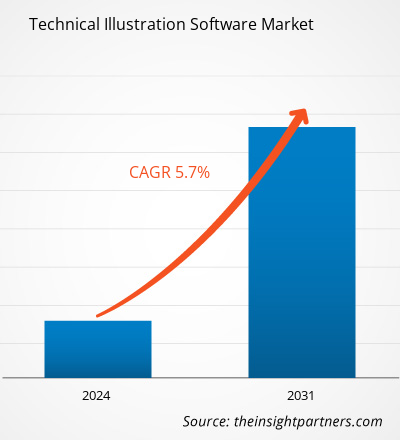
Si prevede che la dimensione del mercato del software di illustrazione tecnica raggiungerà i 7,52 miliardi di dollari entro il 2031, rispetto ai 4,82 miliardi di dollari del 2023. Si prevede che il mercato registrerà un CAGR del 5,7% nel 2023-2031.È probabile che la crescente attenzione rivolta alle illustrazioni ottimizzate per i dispositivi mobili rimanga una tendenza chiave nel mercato dei software di illustrazione tecnica.
Analisi di mercato del software di illustrazione tecnica
Software per illustrazione tecnica Il mercato è guidato dall'espansione dei settori verticali dell'intrattenimento e dal mutevole ecosistema imprenditoriale di diversi settori verticali. Gli illustratori possono progettare più facilmente beni tecnologici entro un limite di tempo stabilito utilizzando software di illustrazione tecnica. Inoltre, molti fornitori di software offrono opzioni convenienti che le piccole e medie imprese, che in genere hanno risorse limitate, possono acquistare facilmente. L'abbondanza di strumenti gratuiti sul mercato è il principale ostacolo. Tuttavia, gli illustratori hanno bisogno di questi strumenti gratuiti per progettare beni tecnici complicati e non dispongono delle funzionalità e delle capacità complete che questi strumenti richiedono. Pertanto, le aziende continuano a spendere soldi per l'acquisto di software proprietario anche di fronte alla disponibilità di soluzioni gratuite.
Panoramica del mercato del software di illustrazione tecnica
Disegni tecnici e immagini di prodotti per la scienza e la medicina sono inclusi nel software di illustrazione tecnica. Il programma ha una serie di caratteristiche che gli illustratori richiedono per sviluppare articoli tecnologici. Il programma supporta lo sviluppo di progetti sia 2D che 3D. Dalla progettazione e creazione del progetto fino alla pubblicazione della documentazione tecnica, consente la creazione di intricati grafici tecnici con controllo e precisione completi. Il programma è utilizzato principalmente nella fabbricazione di macchine e nei disegni tecnici di apparecchiature mediche. Il software di illustrazione tecnica elimina qualsiasi dettaglio extra. Inoltre, il software consente libertà artistica nell'applicazione di diversi elementi stilistici per promuovere l'obiettivo dell'illustrazione.
Personalizza questo report in base alle tue esigenze
Riceverai la personalizzazione gratuita di qualsiasi report, comprese parti di questo report, o analisi a livello nazionale, pacchetto dati Excel, oltre a usufruire di grandi offerte e sconti per start-up e università
Mercato del software di illustrazione tecnica: approfondimenti strategici
-
Scopri le principali tendenze di mercato in questo rapporto.Questo campione GRATUITO includerà analisi di dati che spaziano dalle tendenze di mercato alle stime e alle previsioni.
Driver e opportunità del mercato del software di illustrazione tecnica
Crescente necessità di documentazione tecnica
I settori automobilistico, aerospaziale , della difesa, manifatturiero e sanitario sono tra i tanti settori in espansione che hanno visto un aumento della necessità di una documentazione tecnica chiara e accurata. Manuali tecnici, istruzioni di montaggio e guide per l'utente possono trarre vantaggio dagli schemi, dai diagrammi e dalle immagini complessi creati con l'uso di software di illustrazione tecnica.
Miglioramenti nelle tecnologie di visualizzazione
I costanti progressi nella tecnologia di visualizzazione, come il rendering 3D, la realtà aumentata (AR) e la realtà virtuale (VR), stanno guidando la domanda di software di illustrazione tecnica. Queste tecnologie consentono agli utenti di creare visualizzazioni dinamiche e interessanti che migliorano la comunicazione e la comprensione di processi tecnologici complessi. Pertanto, si prevede che la crescente adozione dell'IoT presenterà nuove opportunità per gli operatori del mercato del software di illustrazione tecnica durante il periodo di previsione.
Analisi della segmentazione del rapporto di mercato del software di illustrazione tecnica
I segmenti chiave che hanno contribuito alla derivazione dell'analisi di mercato del software di illustrazione tecnica sono i componenti e gli utenti finali.
- In base al componente, il mercato del software di illustrazione tecnica è segmentato in soluzioni e servizi.
- In base alle dimensioni dell'organizzazione, il mercato è segmentato in PMI e grandi imprese. Il segmento delle grandi imprese ha detenuto una quota di mercato maggiore nel 2023.
- In base alla tecnologia, il mercato è segmentato in 2D e 3D.
- In base all'utente finale, il mercato è segmentato in produzione, aerospaziale e difesa, automobilistico, assistenza sanitaria, energia e potenza e altri.
Analisi della quota di mercato del software di illustrazione tecnica per area geografica
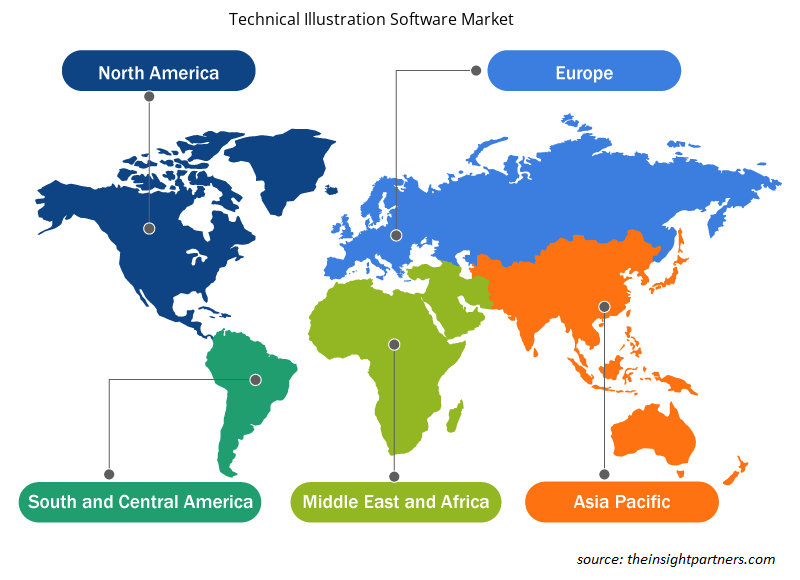
L'ambito geografico del report di mercato del software di illustrazione tecnica è suddiviso principalmente in cinque regioni: Nord America, Asia Pacifico, Europa, Medio Oriente e Africa e Sud America/Sud e Centro America. In termini di fatturato, il Nord America ha rappresentato la quota di mercato più grande del software di illustrazione tecnica. La continua necessità di soluzioni software di illustrazione tecnica complete da parte delle aziende nei settori aerospaziale e militare, manifatturiero e sanitario è uno dei fattori che guidano l'espansione del mercato.
Approfondimenti regionali sul mercato del software di illustrazione tecnica
Le tendenze regionali e i fattori che influenzano il mercato del software di illustrazione tecnica durante il periodo di previsione sono stati ampiamente spiegati dagli analisti di Insight Partners. Questa sezione discute anche i segmenti e la geografia del mercato del software di illustrazione tecnica in Nord America, Europa, Asia Pacifico, Medio Oriente e Africa e America centrale e meridionale.
- Ottieni i dati specifici regionali per il mercato del software di illustrazione tecnica
Ambito del rapporto di mercato del software di illustrazione tecnica
| Attributo del report | Dettagli |
|---|---|
| Dimensioni del mercato nel 2023 | 4,82 miliardi di dollari USA |
| Dimensioni del mercato entro il 2031 | 7,52 miliardi di dollari USA |
| CAGR globale (2023-2031) | 5,7% |
| Dati storici | 2021-2022 |
| Periodo di previsione | 2024-2031 |
| Segmenti coperti |
Per componente
|
| Regioni e Paesi coperti |
America del Nord
|
| Leader di mercato e profili aziendali chiave |
|
Illustrazione tecnica Software Market Players Densità: comprendere il suo impatto sulle dinamiche aziendali
Il mercato del software di illustrazione tecnica sta crescendo rapidamente, spinto dalla crescente domanda degli utenti finali dovuta a fattori quali l'evoluzione delle preferenze dei consumatori, i progressi tecnologici e una maggiore consapevolezza dei vantaggi del prodotto. Con l'aumento della domanda, le aziende stanno ampliando le loro offerte, innovando per soddisfare le esigenze dei consumatori e capitalizzando sulle tendenze emergenti, il che alimenta ulteriormente la crescita del mercato.
La densità degli operatori di mercato si riferisce alla distribuzione di aziende o società che operano in un particolare mercato o settore. Indica quanti concorrenti (operatori di mercato) sono presenti in un dato spazio di mercato in relazione alle sue dimensioni o al valore di mercato totale.
Le principali aziende che operano nel mercato del software di illustrazione tecnica sono:
- Società a responsabilità limitata
- Autodesk, Inc
- Tela GFX, Inc.
- Società Corel
- Società a responsabilità limitata
- Dassault Systèmes
Disclaimer : le aziende elencate sopra non sono classificate secondo un ordine particolare.
- Ottieni la panoramica dei principali attori del mercato dei software di illustrazione tecnica
Notizie di mercato e sviluppi recenti del software di illustrazione tecnica
Il mercato del software di illustrazione tecnica viene valutato raccogliendo dati qualitativi e quantitativi dopo la ricerca primaria e secondaria, che include importanti pubblicazioni aziendali, dati di associazioni e database. Di seguito è riportato un elenco degli sviluppi nel mercato dei disturbi e delle strategie del linguaggio e della parola:
- A gennaio 2021, Tech Soft 3D ha annunciato che Canvas GFX sta utilizzando la piattaforma HOOPS per aggiungere funzionalità di modelli CAD 3D al suo prodotto più recente, Canvas X3, un nuovo potente prodotto con la capacità di importare dati in oltre 90 formati di file, inclusi file creati in tutti i principali pacchetti CAD 3D. (Fonte: Tech Soft 3D, comunicato stampa)
- A gennaio 2021, Canvas GFX, Inc., il principale fornitore di software per l'illustrazione tecnica, ha annunciato il lancio commerciale del suo ultimo prodotto, Canvas X3 CADComposer. (Fonte: Canvas GFX, Inc, comunicato stampa)
Copertura e risultati del rapporto di mercato sul software di illustrazione tecnica
Il rapporto "Dimensioni e previsioni del mercato del software di illustrazione tecnica (2021-2031)" fornisce un'analisi dettagliata del mercato che copre le seguenti aree:
- Dimensioni e previsioni del mercato a livello globale, regionale e nazionale per tutti i segmenti di mercato chiave coperti dall'ambito
- Dinamiche di mercato come fattori trainanti, vincoli e opportunità chiave
- Principali tendenze future
- Analisi dettagliata delle cinque forze PEST/Porter e SWOT
- Analisi di mercato globale e regionale che copre le principali tendenze di mercato, i principali attori, le normative e gli sviluppi recenti del mercato
- Analisi del panorama industriale e della concorrenza che copre la concentrazione del mercato, l'analisi della mappa di calore, i principali attori e gli sviluppi recenti
- Profili aziendali dettagliati

Ankita è una dinamica professionista della ricerca di mercato e della consulenza con oltre 8 anni di esperienza nei settori della tecnologia, dei media, dell'ICT, dell'elettronica e dei semiconduttori. Ha guidato e portato a termine con successo oltre 100 incarichi di consulenza e ricerca per clienti globali come Microsoft, Oracle, NEC Corporation, SAP, KPMG ed Expeditors International. Le sue competenze principali includono la valutazione del mercato, l'analisi dei dati, le previsioni, la formulazione di strategie, l'intelligence competitiva e la redazione di report.
Ankita è esperta nella gestione di cicli di progetto completi, dalla progettazione di proposte pre-vendita e discussioni con i clienti fino alla fornitura di insight fruibili post-vendita. È esperta nella gestione di team interfunzionali, nella strutturazione di moduli di ricerca complessi e nell'allineamento delle soluzioni agli obiettivi aziendali specifici del cliente. Le sue eccellenti capacità di comunicazione, leadership e presentazione le hanno permesso di fornire costantemente risultati orientati al valore in contesti di mercato in rapida evoluzione.
- Analisi storica (2 anni), anno base, previsione (7 anni) con CAGR
- Analisi PEST e SWOT
- Valore/volume delle dimensioni del mercato - Globale, Regionale, Nazionale
- Industria e panorama competitivo
- Set di dati Excel
Testimonianze
Il report di mercato sui sistemi SCADA di Insight Partners è completo, con preziosi spunti sulle tendenze attuali e sulle previsioni future. Il team si è dimostrato altamente professionale, reattivo e disponibile in ogni fase del progetto. Siamo molto soddisfatti e consigliamo vivamente i loro servizi.
RAN KEDEM Partner, Reali Technologies LTDsHo richiesto un report su un mercato software molto specifico e il team lo ha prodotto in pochi giorni. Le informazioni erano molto pertinenti e ben presentate. Ho quindi richiesto alcune modifiche e aggiunte al report. Il team è stato ancora una volta molto reattivo e ho ricevuto il report finale in meno di una settimana.
JEAN-HERVE JENN Presidente, Future AnalyticaAbbiamo collaborato con The Insight Partners per un importante studio di mercato e una previsione. Ci hanno fornito informazioni chiare su opportunità e rischi, che ci hanno aiutato a definire i nostri piani. La loro ricerca è stata facile da usare e basata su dati solidi. Ci ha aiutato a prendere decisioni intelligenti e consapevoli. Li consigliamo vivamente.
PIYUSH NAGPAL Vicepresidente senior, Abbaglianti globaliInsight Partners ha fornito ricerche di mercato approfondite e ben strutturate, con una solida competenza nel settore. Il loro team si è dimostrato professionale e reattivo in ogni fase. Il sito web intuitivo ha reso l'accesso ai report di settore semplice e immediato. Li consigliamo vivamente per servizi di ricerca affidabili e di alta qualità.
YUKIHIKO ADACHI Amministratore delegato, Deep Blue, LLC.Questa è la prima volta che acquisto un report di mercato da The Insight Partners. Sebbene inizialmente fossi indeciso, ho visitato il loro sito web e mi sono sentito più a mio agio nell'acquistare un report di mercato. Sono completamente soddisfatto della qualità del report e del servizio clienti. Avevo diverse domande e commenti sul report iniziale, ma dopo un paio di conversazioni via email con il loro analista credo di avere un report che posso utilizzare come input per il nostro processo di pianificazione strategica. Grazie mille per aver dedicato del tempo extra e aver reso questa esperienza positiva. Consiglierò sicuramente il vostro servizio ad altri e sarete la mia prima persona a cui rivolgermi quando avremo bisogno di ulteriori dati di mercato.
GIOVANNI SUZUKI Presidente e Amministratore Delegato, Consigliere di Amministrazione, Tecnologie BKDesidero esprimere la mia gratitudine per il supporto e la professionalità dimostrati nel rispondere alla mia richiesta di informazioni sul mercato dei dispositivi medici in vitro per malattie infettive in Nigeria. Apprezzo la vostra pazienza, la vostra guida e la vostra disponibilità a offrirmi uno sconto, che alla fine ci ha permesso di concludere l'affare. Non vedo l'ora di collaborare con The Insight Partners in futuro, grazie anche all'impressione che mi avete lasciato dopo questo primo incontro.
Dott. Chijioke AMMINISTRATORE DELEGATO DI ONYIA, PineCrest Healthcare Ltd.Motivo dell'acquisto
- Processo decisionale informato
- Comprensione delle dinamiche di mercato
- Analisi competitiva
- Analisi dei clienti
- Previsioni di mercato
- Mitigazione del rischio
- Pianificazione strategica
- Giustificazione degli investimenti
- Identificazione dei mercati emergenti
- Miglioramento delle strategie di marketing
- Aumento dell'efficienza operativa
- Allineamento alle tendenze normative


Sblocca sconti esclusivi sui report
Richiedi ora


 Ottieni un campione gratuito per - Mercato del software di illustrazione tecnica