Marktbericht für technische Illustrationssoftware 2031 nach Segmenten, Geografie, Dynamik, jüngsten Entwicklungen und strategischen Erkenntnissen
Historische Daten : 2021-2022 | Basisjahr : 2023 | Prognosezeitraum : 2024-2031Marktgröße und Prognose für technische Illustrationssoftware (2021 – 2031), Berichtsabdeckung zu globalen und regionalen Anteilen, Trends und Wachstumschancen: Nach Komponente (Lösungen und Dienste); Technologie (2D und 3D); Unternehmensgröße (KMU und Großunternehmen); Endbenutzer (Fertigung, Luft- und Raumfahrt & Verteidigung, Automobilindustrie, Gesundheitswesen, Energie & Strom und andere) und Geografie
- Status : Veröffentlichte Daten
- Berichtscode : TIPRE00007002
- Kategorie : Technologie, Medien und Telekommunikation
- Anzahl der Seiten : 150
- Verfügbare Berichtsformate :


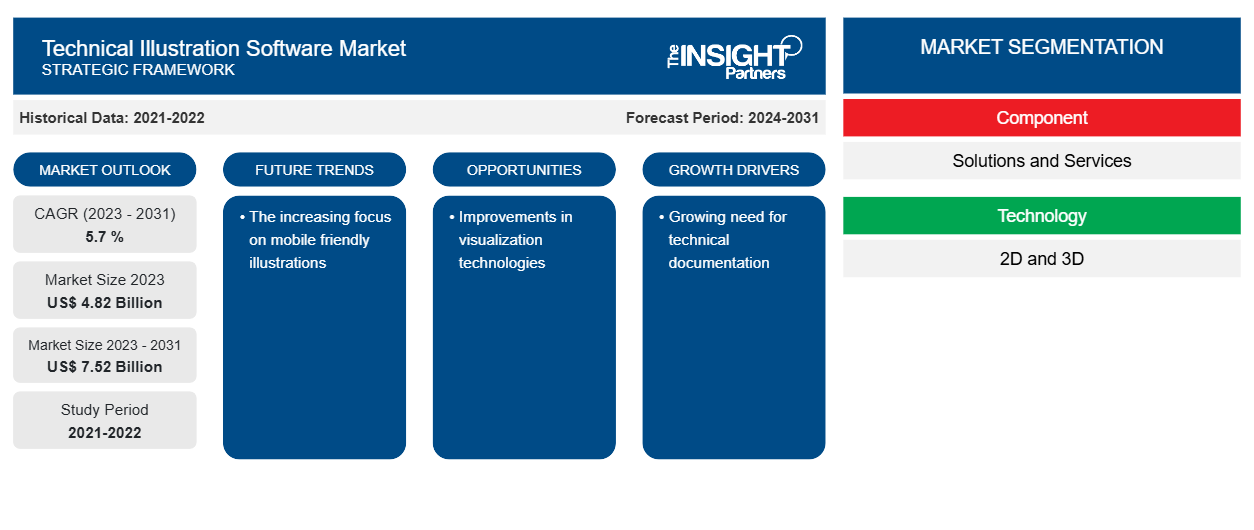
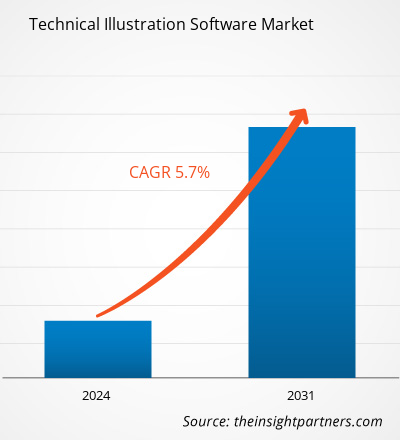
Das Marktvolumen für technische Illustrationssoftware soll von 4,82 Milliarden US-Dollar im Jahr 2023 auf 7,52 Milliarden US-Dollar im Jahr 2031 anwachsen. Für den Markt wird für den Zeitraum 2023–2031 eine durchschnittliche jährliche Wachstumsrate (CAGR) von 5,7 % erwartet.Der zunehmende Fokus auf mobilfreundliche Illustrationen wird voraussichtlich ein wichtiger Trend auf dem Markt für technische Illustrationssoftware bleiben.
Marktanalyse für technische Illustrationssoftware
Software für technische Illustrationen Der Markt wird von den expandierenden Unterhaltungsbranchen und dem sich verändernden unternehmerischen Ökosystem verschiedener Branchen angetrieben. Mithilfe von Software für technische Illustrationen können Illustratoren technische Produkte leichter innerhalb einer festgelegten Zeitspanne entwerfen. Darüber hinaus bieten viele Softwareanbieter kostengünstige Optionen an, die kleine und mittlere Unternehmen, die normalerweise nur über begrenzte Ressourcen verfügen, problemlos erwerben können. Das größte Hindernis ist die Fülle an kostenlosen Tools auf dem Markt. Illustratoren benötigen diese kostenlosen Tools jedoch, um komplizierte technische Produkte zu entwerfen, und ihnen fehlen die umfassenden Funktionen und Möglichkeiten, die diese Tools erfordern. Daher geben Unternehmen trotz der Verfügbarkeit kostenloser Lösungen weiterhin Geld für den Kauf proprietärer Software aus.
Marktübersicht für technische Illustrationssoftware
Technische Zeichnungen und Produktbilder für Wissenschaft und Medizin sind in technischer Illustrationssoftware enthalten. Das Programm verfügt über eine Reihe von Eigenschaften, die Illustratoren benötigen, um technische Artikel zu entwickeln. Das Programm unterstützt sowohl die 2D- als auch die 3D-Designentwicklung. Von der Projektgestaltung und Erstellung bis hin zur Veröffentlichung technischer Dokumentation ermöglicht es die Erstellung komplexer technischer Grafiken mit vollständiger Kontrolle und Präzision. Das Programm wird hauptsächlich im Maschinenbau und für technische Zeichnungen medizinischer Geräte verwendet. Technische Illustrationssoftware eliminiert alle zusätzlichen Details. Darüber hinaus ermöglicht die Software künstlerische Freiheit bei der Anwendung mehrerer Stilelemente, um das Ziel der Illustration zu erreichen.
Passen Sie diesen Bericht Ihren Anforderungen an
Sie erhalten kostenlos individuelle Anpassungen an jedem Bericht, einschließlich Teilen dieses Berichts oder einer Analyse auf Länderebene, eines Excel-Datenpakets sowie tolle Angebote und Rabatte für Start-ups und Universitäten.
Markt für technische Illustrationssoftware: Strategische Einblicke
-
Holen Sie sich die wichtigsten Markttrends aus diesem Bericht.Dieses KOSTENLOSE Beispiel umfasst eine Datenanalyse von Markttrends bis hin zu Schätzungen und Prognosen.
Treiber und Chancen auf dem Markt für technische Illustrationssoftware
Wachsender Bedarf an technischer Dokumentation
Die Automobil-, Luft- und Raumfahrt- , Verteidigungs-, Fertigungs- und Gesundheitsbranche gehören zu den zahlreichen expandierenden Branchen, in denen der Bedarf an klarer und genauer technischer Dokumentation gestiegen ist. Technische Handbücher, Montageanleitungen und Benutzerhandbücher können alle von den komplexen Schemata, Diagrammen und Bildern profitieren, die mithilfe von technischer Illustrationssoftware erstellt werden.
Verbesserungen bei Visualisierungstechnologien
Die ständigen Fortschritte in der Visualisierungstechnologie, wie 3D-Rendering, Augmented Reality (AR) und Virtual Reality (VR), treiben die Nachfrage nach technischer Illustrationssoftware voran. Diese Technologien ermöglichen es Benutzern, dynamische und interessante Visualisierungen zu erstellen, die die Kommunikation und das Verständnis komplexer technologischer Prozesse verbessern. Daher wird erwartet, dass die zunehmende Einführung des IoT den Akteuren auf dem Markt für technische Illustrationssoftware im Prognosezeitraum neue Möglichkeiten bietet.
Marktbericht zur technischen Illustrationssoftware – Segmentierungsanalyse
Wichtige Segmente, die zur Ableitung der Marktanalyse für technische Illustrationssoftware beigetragen haben, sind Komponenten und Endbenutzer.
- Basierend auf der Komponente ist der Markt für technische Illustrationssoftware in Lösungen und Dienste segmentiert.
- Nach Unternehmensgröße ist der Markt in KMU und Großunternehmen segmentiert. Das Segment der Großunternehmen hatte im Jahr 2023 einen größeren Marktanteil.
- Nach Technologie ist der Markt in 2D und 3D segmentiert.
- Nach Endverbraucher ist der Markt in die Branchen Fertigung, Luft- und Raumfahrt und Verteidigung, Automobil, Gesundheitswesen, Energie und Strom und Sonstige segmentiert.
Marktanteilsanalyse für technische Illustrationssoftware nach geografischer Lage
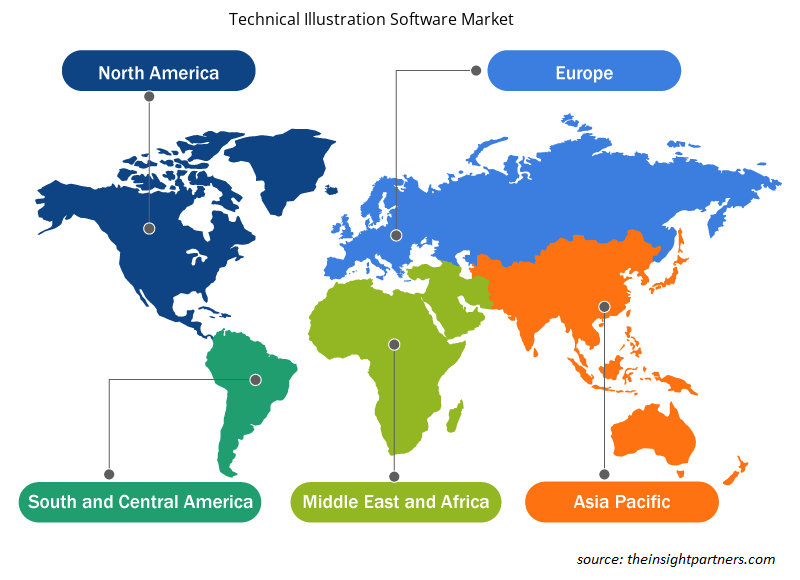
Der geografische Umfang des Marktberichts für technische Illustrationssoftware ist hauptsächlich in fünf Regionen unterteilt: Nordamerika, Asien-Pazifik, Europa, Naher Osten und Afrika sowie Südamerika/Süd- und Mittelamerika. In Bezug auf den Umsatz hatte Nordamerika den größten Marktanteil an technischer Illustrationssoftware. Der anhaltende Bedarf an kompletten technischen Illustrationssoftwarelösungen von Unternehmen in den Branchen Luft- und Raumfahrt und Militär, Fertigung und Gesundheitswesen ist einer der Faktoren, die die Expansion des Marktes vorantreiben.
Regionale Einblicke in den Markt für technische Illustrationssoftware
Die regionalen Trends und Faktoren, die den Markt für technische Illustrationssoftware während des Prognosezeitraums beeinflussen, wurden von den Analysten von Insight Partners ausführlich erläutert. In diesem Abschnitt werden auch die Marktsegmente und die Geografie von technischer Illustrationssoftware in Nordamerika, Europa, im asiatisch-pazifischen Raum, im Nahen Osten und Afrika sowie in Süd- und Mittelamerika erörtert.
- Erhalten Sie regionale Daten zum Markt für technische Illustrationssoftware
Umfang des Marktberichts zur technischen Illustrationssoftware
| Berichtsattribut | Details |
|---|---|
| Marktgröße im Jahr 2023 | 4,82 Milliarden US-Dollar |
| Marktgröße bis 2031 | 7,52 Milliarden US-Dollar |
| Globale CAGR (2023 - 2031) | 5,7 % |
| Historische Daten | 2021-2022 |
| Prognosezeitraum | 2024–2031 |
| Abgedeckte Segmente |
Nach Komponente
|
| Abgedeckte Regionen und Länder |
Nordamerika
|
| Marktführer und wichtige Unternehmensprofile |
|
Dichte der Marktteilnehmer für technische Illustrationssoftware: Die Auswirkungen auf die Geschäftsdynamik verstehen
Der Markt für technische Illustrationssoftware wächst rasant, angetrieben durch die steigende Nachfrage der Endnutzer aufgrund von Faktoren wie sich entwickelnden Verbraucherpräferenzen, technologischen Fortschritten und einem größeren Bewusstsein für die Vorteile des Produkts. Mit steigender Nachfrage erweitern Unternehmen ihr Angebot, entwickeln Innovationen, um die Bedürfnisse der Verbraucher zu erfüllen, und nutzen neue Trends, was das Marktwachstum weiter ankurbelt.
Die Marktteilnehmerdichte bezieht sich auf die Verteilung der Firmen oder Unternehmen, die in einem bestimmten Markt oder einer bestimmten Branche tätig sind. Sie gibt an, wie viele Wettbewerber (Marktteilnehmer) in einem bestimmten Marktraum im Verhältnis zu seiner Größe oder seinem gesamten Marktwert präsent sind.
Die wichtigsten auf dem Markt für technische Illustrationssoftware tätigen Unternehmen sind:
- ASA Computers, Inc.
- Autodesk, Inc
- Canvas GFX, Inc.
- Corel Corporation
- Cyient Ltd.
- Dassault Systemes
Haftungsausschluss : Die oben aufgeführten Unternehmen sind nicht in einer bestimmten Reihenfolge aufgeführt.
- Überblick über die wichtigsten Akteure auf dem Markt für technische Illustrationssoftware
Neuigkeiten und aktuelle Entwicklungen zum Markt für technische Illustrationssoftware
Der Markt für technische Illustrationssoftware wird durch die Erfassung qualitativer und quantitativer Daten nach Primär- und Sekundärforschung bewertet, die wichtige Unternehmensveröffentlichungen, Verbandsdaten und Datenbanken umfasst. Im Folgenden finden Sie eine Liste der Entwicklungen auf dem Markt für Sprach- und Sprechstörungen und Strategien:
- Im Januar 2021 gab Tech Soft 3D bekannt, dass Canvas GFX die HOOPS-Plattform nutzt, um seinem neuesten Produkt Canvas X3 3D-CAD-Modellfunktionen hinzuzufügen. Canvas X3 ist ein leistungsstarkes neues Produkt mit der Möglichkeit, Daten in mehr als 90 Dateiformaten zu importieren, darunter Dateien, die in allen führenden 3D-CAD-Paketen erstellt wurden. (Quelle: Tech Soft 3D, Pressemitteilung)
- Im Januar 2021 kündigte Canvas GFX, Inc., der führende Anbieter von technischer Illustrationssoftware, die kommerzielle Veröffentlichung seines neuesten Produkts, Canvas X3 CADComposer, an. (Quelle: Canvas GFX, Inc., Pressemitteilung)
Marktbericht zu technischer Illustrationssoftware – Abdeckung und Ergebnisse
Der Bericht „Marktgröße und Prognose für technische Illustrationssoftware (2021–2031)“ bietet eine detaillierte Analyse des Marktes, die die folgenden Bereiche abdeckt:
- Marktgröße und Prognose auf globaler, regionaler und Länderebene für alle wichtigen Marktsegmente, die im Rahmen des Projekts abgedeckt sind
- Marktdynamik wie Treiber, Beschränkungen und wichtige Chancen
- Wichtige Zukunftstrends
- Detaillierte PEST/Porters Five Forces- und SWOT-Analyse
- Globale und regionale Marktanalyse mit wichtigen Markttrends, wichtigen Akteuren, Vorschriften und aktuellen Marktentwicklungen
- Branchenlandschaft und Wettbewerbsanalyse, einschließlich Marktkonzentration, Heatmap-Analyse, prominenten Akteuren und aktuellen Entwicklungen
- Detaillierte Firmenprofile

Ankita ist eine dynamische Marktforschungs- und Beratungsexpertin mit über 8 Jahren Erfahrung in den Bereichen Technologie, Medien, IKT sowie Elektronik und Halbleiter. Sie hat über 100 Beratungs- und Forschungsaufträge für globale Kunden wie Microsoft, Oracle, NEC Corporation, SAP, KPMG und Expeditors International erfolgreich geleitet und durchgeführt. Zu ihren Kernkompetenzen gehören Marktbewertung, Datenanalyse, Prognose, Strategieformulierung, Wettbewerbsbeobachtung und das Verfassen von Berichten. Ankita ist versiert in der Abwicklung kompletter Projektzyklen – von der Angebotserstellung vor dem Verkauf und Kundengesprächen bis hin zur Bereitstellung umsetzbarer Erkenntnisse nach dem Verkauf. Sie ist versiert in der Leitung funktionsübergreifender Teams, der Strukturierung komplexer Forschungsmodule und der Ausrichtung von Lösungen an kundenspezifischen Geschäftszielen. Ihre ausgezeichneten Kommunikationsfähigkeiten, Führungsqualitäten und Präsentationsfähigkeiten haben es ihr ermöglicht, in einem schnelllebigen und sich entwickelnden Marktumfeld stets wertorientierte Ergebnisse zu liefern.
- Historische Analyse (2 Jahre), Basisjahr, Prognose (7 Jahre) mit CAGR
- PEST- und SWOT-Analyse
- Marktgröße Wert/Volumen – Global, Regional, Land
- Branchen- und Wettbewerbslandschaft
- Excel-Datensatz
Erfahrungsberichte
Der SCADA-Systemmarktbericht von Insight Partners ist umfassend und bietet wertvolle Einblicke in aktuelle Trends und Zukunftsprognosen. Das Team war durchweg hochprofessionell, reaktionsschnell und hilfsbereit. Wir sind sehr zufrieden und können die Dienstleistungen wärmstens empfehlen.
RAN KEDEM Partner, Reali Technologies LTDsIch habe einen Bericht über einen sehr spezifischen Softwaremarkt angefordert, und das Team hat ihn innerhalb weniger Tage erstellt. Die Informationen waren sehr relevant und gut präsentiert. Anschließend habe ich einige Änderungen und Ergänzungen zum Bericht angefordert. Das Team reagierte erneut sehr schnell, und ich erhielt den Abschlussbericht in weniger als einer Woche.
JEAN-HERVE JENN Vorsitzende, Future AnalyticaWir haben mit The Insight Partners für eine wichtige Marktstudie und Prognose zusammengearbeitet. Sie gaben uns klare Einblicke in Chancen und Risiken, die uns bei der Gestaltung unserer Pläne halfen. Ihre Recherchen waren benutzerfreundlich und basierten auf soliden Daten. Sie halfen uns, kluge und sichere Entscheidungen zu treffen. Wir können sie wärmstens empfehlen.
PIYUSH NAGPAL Sr. Vizepräsident, Fernlicht GlobalDie Insight Partners lieferten aufschlussreiche, gut strukturierte Marktforschung mit fundierter Fachkompetenz. Ihr Team war durchweg professionell und reaktionsschnell. Die benutzerfreundliche Website ermöglichte den Zugriff auf Branchenberichte. Wir empfehlen sie wärmstens für zuverlässige und hochwertige Forschungsdienstleistungen.
YUKIHIKO ADACHI Geschäftsführer, Deep Blue, LLC.Dies ist das erste Mal, dass ich einen Marktbericht von The Insight Partners erworben habe. Obwohl ich zunächst unsicher war, besuchte ich die Website und fühlte mich dann sicherer, das Risiko einzugehen und einen Marktbericht zu kaufen. Ich bin mit der Qualität des Berichts und dem Kundenservice rundum zufrieden. Ich hatte einige Fragen und Anmerkungen zum ersten Bericht, aber nach einigen E-Mail-Gesprächen mit dem Analysten bin ich überzeugt, dass ich einen Bericht habe, den ich als Input für unseren strategischen Planungsprozess verwenden kann. Vielen Dank, dass Sie sich die Zeit genommen und dies zu einer positiven Erfahrung gemacht haben. Ich werde Ihren Service auf jeden Fall weiterempfehlen und Sie werden meine erste Anlaufstelle sein, wenn wir weitere Marktdaten benötigen.
JOHN SUZUKI Präsident und Chief Executive Officer, Vorstandsmitglied, BK TechnologiesIch möchte mich für Ihre Unterstützung und die Professionalität bedanken, die Sie bei der Bearbeitung meiner Informationsanfrage zum IVD-Markt für Infektionskrankheiten in Nigeria gezeigt haben. Ich schätze Ihre Geduld, Ihre Beratung und die Tatsache, dass Sie bereit waren, einen Rabatt anzubieten, der uns schließlich den Abschluss eines Geschäfts ermöglichte. Ich freue mich darauf, The Insight Partners in Zukunft wieder zu beauftragen, dank des Eindrucks, den Sie bei dieser ersten Begegnung bei mir hinterlassen haben.
DR. CHIJIOKE ONYIA GESCHÄFTSFÜHRERIN, PineCrest Healthcare Ltd.Grund zum Kauf
- Fundierte Entscheidungsfindung
- Marktdynamik verstehen
- Wettbewerbsanalyse
- Kundeneinblicke
- Marktprognosen
- Risikominimierung
- Strategische Planung
- Investitionsbegründung
- Identifizierung neuer Märkte
- Verbesserung von Marketingstrategien
- Steigerung der Betriebseffizienz
- Anpassung an regulatorische Trends


Exklusive Berichtsrabatte freischalten
Jetzt anfragen


 Kostenlose Probe anfordern für - Markt für technische Illustrationssoftware