
임상시험 이미징 시장 분석 및 예측(크기, 점유율, 성장, 동향 2028)
2028년까지의 임상 시험 영상 시장 전망 - 모달리티별 글로벌 분석[단층촬영, 자기공명영상(MRI), 초음파, 양전자방출단층촬영(PET), X선, 심장초음파 및 기타], 제공 서비스(운영 영상 서비스, 영상 소프트웨어, 판독 분석 서비스, 시험 설계 및 컨설팅 서비스 및 기타), 최종 사용자[계약 연구 기관(CRO), 제약 및 생명공학 회사, 학술 및 연구 기관 및 기타]
- 상태 : 게시됨
- 보고서 코드 : TIPHE100001201
- 범주 : 생명과학
- 페이지 수 : 186
- 사용 가능한 보고서 형식 :


- 최종 업데이트 일자 : June 12, 2024

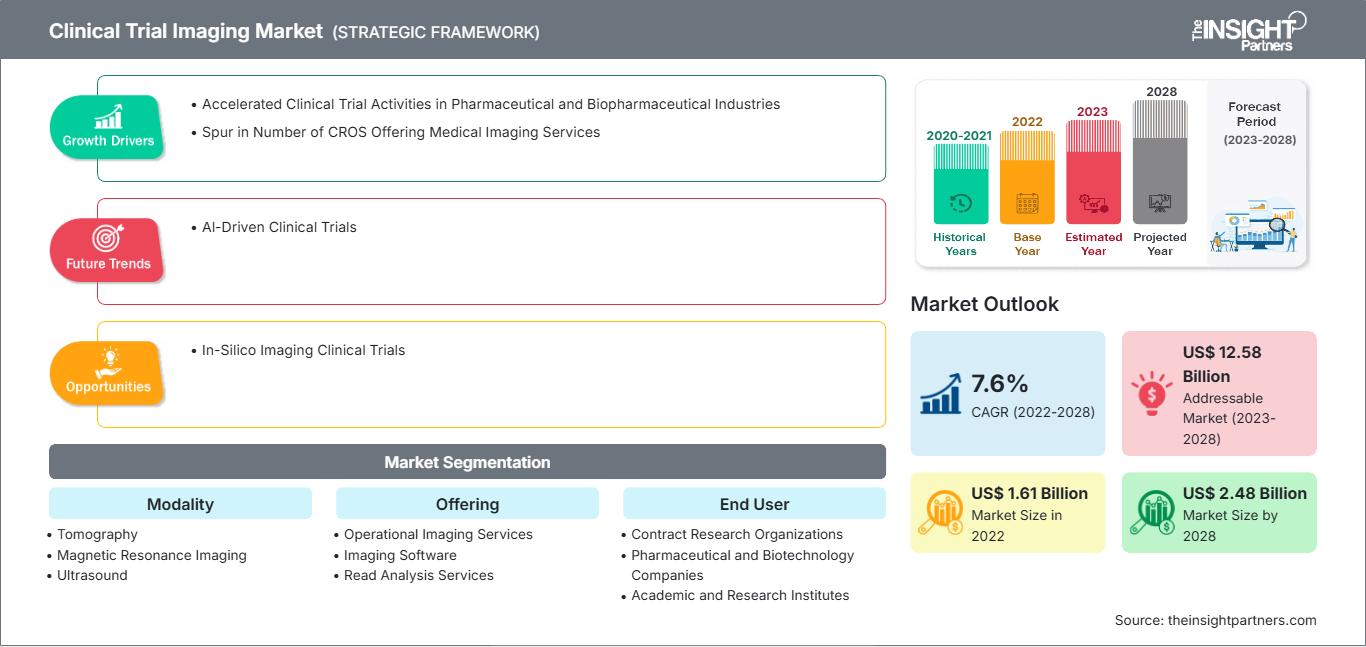
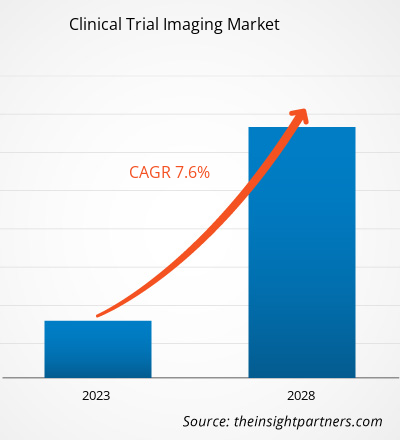
[연구 보고서] 임상시험 영상 시장 규모는 2022년 16억 1,070만 달러에서 2028년에는 24억 8,032만 달러로 성장할 것으로 예상되며, 2023년부터 2028년까지 연평균 성장률(CAGR) 7.6%를 기록할 것으로 예상됩니다.
시장 분석 및 분석가 의견:
임상 시험 영상은 자발적으로 참여하는 사람들을 대상으로 실시되는 연구입니다. 이 연구는 주로 질병의 검출, 진단, 안내 또는 치료 모니터링을 위한 영상 절차의 가치를 파악하는 것을 목표로 합니다. 일부 영상 해석 과정에는 임상 시험 영상들 사이에 테스트 영상을 혼합하여 판독자의 판독 숙련도 및/또는 일관성을 간헐적으로 테스트하는 방식이 포함될 수 있습니다. 숙련도가 유지되지 않을 경우, 판독자를 다른 훈련되고 자격을 갖춘 판독자로 교체해야 할 수 있습니다. 다기관 임상시험에서 영상 평가변수 활용이 급증함에 따라 데이터 양과 워크플로우의 복잡성 또한 증가했습니다. 임상시험 영상 관리 시스템(CTIMS)은 원활한 워크플로우를 준수하고 환자 결과를 개선하기 위해 임상시험 영상 프로세스를 포괄적으로 지원해야 합니다. CTIMS의 주요 규제 요건은 국제조화회의(ICH)-GCP E6, FDA 21 연방규정집 11부 및 820부, 우수자동화제조기준(GMP), 임상데이터교환표준컨소시엄(CDISC)을 포함한 여러 관련 규정 및 지침을 면밀히 검토하여 도출되었습니다.
성장 동력 및 과제:
임상연구기관(CRO)은 고품질 시설과 심층적인 전문 지식을 활용하여 제공되는 서비스를 통해 임상시험의 성공적인 시행을 지원합니다. CRO는 효율적이고 비용 효율적인 운영을 통해 임상시험 의뢰자에게 이익을 제공함으로써 임상시험 산업의 중추적인 역할을 하기 시작했습니다. 예를 들어, 평균적으로 CRO는 자체 임상시험 수행 및 완료에 소요되는 시간이 자체 임상시험보다 30% 더 짧습니다.
CRO 수의 증가로 경쟁이 치열해짐에 따라, 일부 기업은 전문 영상 서비스를 제공하여 영상 CRO(iCRO)로 부상하고 있습니다. Keosys Medical Imaging과 Medica Group PLC가 iCRO의 대표적인 사례입니다. 2010년 이후 임상시험 총 건수는 두 배로 증가했으며, 이러한 임상시험에서 영상 기법 사용은 거의 500% 증가했습니다. KEOSYS MEDICAL IMAGING의 보고서에 따르면, iCRO는 예산의 7.5~10%를 영상 촬영에 할당하여 영상 촬영부터 해석까지 모든 단계를 관리하는 워크플로우를 최적화합니다. 이러한 CRO는 영상 촬영을 위한 장소 적격성 평가, 표준화된 영상 촬영, 판독 설계 및 기준 결정 등의 분야에서 핵심적인 지식 통찰력을 제공하여 글로벌 임상시험 영상 시장 성장에 기여하고 있습니다.
요구 사항에 맞게 이 보고서를 사용자 정의하십시오.
이 보고서의 일부, 국가 수준 분석, Excel 데이터 팩을 포함하여 모든 보고서에 대한 사용자 정의를 무료로 받을 수 있을 뿐만 아니라 스타트업 및 대학을 위한 훌륭한 제안 및 할인을 이용할 수 있습니다
임상 시험 영상 시장: 전략적 통찰력
-
이 보고서의 주요 주요 시장 동향을 확인하세요.이 무료 샘플에는 시장 동향부터 추정 및 예측에 이르기까지 데이터 분석이 포함됩니다.
임상 시험은 신약, 식이요법, 의료기기 등 새로운 치료법이나 예방법이 안전하고 효과적인지 판단하는 데 도움이 됩니다. 이러한 시험은 주로 약물 개발 단계에서 수행됩니다. 미국 국립의학도서관(NLM)에서 제공한 데이터에 따르면, 2020년에 약 52,000건의 신규 연구가 NLM(ClinicalTrials.gov)에 등록되었으며, 2023년에는 약 58,000건으로 증가했습니다. 2023년 1월 NLM은 미국에서 38,837건, 전 세계적으로 105,172건의 임상 시험이 진행 중이라고 보고했습니다. 유럽의학청(EMA)에 따르면, 유럽연합(EU)에서는 매년 약 4,000건의 임상 시험이 승인되며, 이 중 약 60%가 제약 산업과 관련이 있습니다. 전 세계적으로 만성 질환 유병률 증가로 인해 다양하고 효과적인 치료법 개발을 위한 임상시험이 증가하면서 임상시험 영상 시장 성장이 가속화되고 있습니다. 임상시험 절차가 점점 복잡해지고 있어 연구 기반 기관에서 임상시험을 제대로 시행하고 관리하는 것이 매우 중요해졌습니다. 연구 기반 기관들은 부적절한 시행으로 인한 오류를 방지하기 위해 임상시험을 아웃소싱하여 제품 개발을 진행하고 있습니다. 임상연구기관(CRO)은 고품질 시설과 심도 있는 전문 지식을 바탕으로 임상시험을 성공적으로 수행할 수 있도록 지원합니다. CRO는 효율적이고 비용 효율적인 운영을 통해 임상시험 의뢰자에게 이익을 제공함으로써 임상시험 산업의 중추적인 역할을 하기 시작했습니다. Thermo Fisher Scientific 블로그에 따르면, 2022년 임상시험 4건 중 약 3건이 CRO를 통해 수행되었습니다. CRO는 신약 개발사의 임상 프로그램을 안심시키고, 풍부한 전문 지식을 제공하며, 시간과 비용 효율성을 높이고, 맞춤형 고품질 데이터를 제공하기 위한 목적으로 시행되었습니다. 따라서 비용 효율적인 솔루션 개발과 약물 개발 과정에서 CRO의 오류 감소는 임상 시험 시장의 성장을 견인하고 있으며, 이는 임상 시험 이미징 시장 규모를 확대하는 요인입니다.
제약 산업은 전 세계적으로 가장 R&D 집약적인 산업 중 하나입니다. 제약 회사들이 R&D를 통해 목표 달성을 위해 노력함에 따라 의약품의 가치는 점점 더 중요해지고 있습니다. 지난 10년 동안 매년 승인되는 신약의 수도 증가했습니다. 미국 식품의약국(FDA)에 따르면 2022년에는 매년 37개의 신약이 승인되었습니다. 환자의 요구를 충족하는 데 있어 효과와 효율성을 높이기 위한 노력이 이루어지고 있습니다. 연구 기반 산업은 매출의 약 15~20%를 R&D 활동에 할당하고 매년 500억 달러 이상을 R&D에 투자합니다. 전 세계적으로 미국은 R&D 투자에서 선두를 달리고 있으며, 지난 10년 동안 전 세계 신약의 절반 이상을 생산했습니다. 유럽제약산업협회(EFPIA)에 따르면, 2019년 북미는 전 세계 의약품 매출의 48.7%를 차지했습니다. 미국은 2014년부터 2019년까지 출시된 신약 매출의 62.3%를 차지했습니다. R&D는 제약 회사의 사업에 있어 중요하고 필수적인 부분으로, 이를 통해 다양한 치료적 응용 분야에 대한 새로운 분자를 개발하고 상당한 의학적 및 상업적 잠재력을 발휘할 수 있습니다.
주요 제약 회사의 R&D 투자
회사 |
2021년 R&D 투자(10억 달러) |
2022년 R&D 투자(10억 달러) |
|
다케다 제약 주식회사 |
4.2 |
4.6 |
|
화이자 Inc |
10.3 |
11.4 |
|
Grifols SA |
404.57 |
427.05 |
참고: 통화 표시에는 현재 환율이 반영되었습니다.
출처: 연례 보고서 및 Insight Partners 분석
R&D 지출은 신제품의 발굴, 검사 및 생산, 선불금 지급, 기존 성과 개선, 출시 전 제품 효능 및 규제 준수 입증을 위해 이루어집니다. R&D 투자는 임상 시험의 필요성과 수요에 따라 달라집니다. 비용에는 재료비, 사용 물품비, 인건비, 그리고 품질 관리 개발 비용이 포함됩니다.
위에서 언급한 기업들과 병원들은 면역 질환을 포함한 다양한 질병 및 질환을 치료하는 제품 개발에 투자하고 있습니다. 2021년 6월, 다케다는 만성 염증성 탈수초성 다발성 신경근병증(CIDP) 치료 유지를 위해 HYQVIA[재조합 인간 히알루로니다아제가 포함된 면역글로불린 주입액 10%(인간)]를 평가하는 무작위 배정, 위약 대조, 이중맹검 3상 임상시험인 ADVANCE-1을 발표했습니다. 이 임상시험은 1차 평가변수를 충족할 것으로 예상됩니다. 따라서 기업들의 R&D 투자 증가와 첨단 제약 산업의 결합은 임상 영상 시장 성장을 촉진하고 있습니다.
제약 및 바이오 제약 기업에게 임상 연구에 적극적으로 참여하는 것은 보람 있지만 어려운 일이며, 의료 영상은 연구의 필수적인 부분이 되고 있습니다. 그러나 임상시험 및 영상 기법의 고유한 기술 사양과 행정적 측면은 표준 치료 영상과 상당히 다르기 때문에 임상시험 기관의 기존 임상 인프라에 부담을 줍니다. 이러한 임상 요건을 준수하지 않을 경우, 신뢰할 수 없는 데이터가 생성되고, 반복적인 영상 촬영이 필요하며, 임상시험 환자 등록이 취소될 수 있습니다. 더 나아가, 임상시험 기관에 적절한 인프라가 부족하면 CRO가 이러한 과제를 해결하기 위한 노력을 저해할 수 있습니다. 임상시험 영상 장비는 이해관계자로부터 막대한 자원 투자를 요구합니다. 예를 들어, 약물 또는 의료기기 임상시험 기관은 임상시험 요건과 인프라를 충족하고, 환자 치료의 우월성을 유지하며, 임상시험의 완전성을 보장해야 합니다. 더욱이, 임상시험 의뢰자는 위에서 언급한 요건을 충족하는 데 필요한 현지 인프라 개발을 지원함으로써 임상시험 영상 촬영의 부담을 인지해야 합니다. 북미방사선학회(Radiological Society of North America)의 정량적 영상 바이오마커 연합(Quantitative Imaging Biomarkers Alliance)은 정량화 가능한 임상시험 결과를 도출하기 위한 영상 검사의 일관성을 보장하기 위해 표준 영상 프로토콜과 워크플로우를 정의하고자 합니다. 따라서 높은 투자와 표준화된 인프라 요건은 글로벌 임상 시험 영상 시장의 성장을 저해하고 있습니다.
보고서 세분화 및 범위:
“글로벌 임상 시험 영상 시장”은 방식, 제공 서비스, 최종 사용자 및 지역을 기준으로 세분화됩니다. 임상 시험 영상 시장은 방식에 따라 단층 촬영, 초음파, 양전자 방출 단층 촬영, X선, 심초음파, 자기공명영상 등으로 세분화됩니다. 제공 서비스를 기준으로 임상 시험 영상 시장은 시험 설계 컨설팅 서비스, 판독 분석 서비스, 운영 영상 서비스, 영상 소프트웨어 등으로 세분화됩니다. 최종 사용자를 기준으로 임상 시험 영상 시장은 제약 및 바이오 제약 회사, 임상시험수탁기관, 학계 및 정부 연구기관 등으로 세분화됩니다. 임상 시험 영상 시장은 지역별로 북미(미국, 캐나다, 멕시코), 유럽(독일, 프랑스, 이탈리아, 영국, 러시아, 기타 유럽), 아시아 태평양(호주, 중국, 일본, 인도, 한국, 기타 아시아 태평양), 중동 및 아프리카(남아프리카, 사우디아라비아, UAE, 기타 중동 및 아프리카), 중남미(브라질, 아르헨티나, 기타 중남미)로 구분됩니다.
세분화 분석:
글로벌 임상 시험 영상 시장은 시험 설계 컨설팅 서비스, 판독 분석 서비스, 운영 영상 서비스, 영상 소프트웨어 등으로 구분됩니다. 운영 영상 서비스 부문은 2021년에 가장 큰 점유율을 차지했으며, 예측 기간 동안에도 유사한 추세를 유지할 것으로 예상됩니다. 운영 영상 서비스에는 신경학, 종양학, 심혈관 질환, 위장병학, 근골격계 질환 및 임상 시험에 사용되는 의료기기와 같은 치료 분야에 사용되는 MRI, CT, 초음파, PET, SPECT와 같은 영상 기법이 포함됩니다. 비침습적 연구 방법인 임상 영상은 의학 전반은 물론 특히 임상 연구 발전에 여러 가지 이점을 제공합니다. 결과적으로, 새로운 영상 기술을 임상 시험에 깊이 통합하는 추세가 강하고 증가하고 있으며, 이는 생명공학, 제약 및 의료기기의 핵심 요소로 자리 잡고 있습니다. 또한, 임상시험에서 영상 검사를 수행할 때 적절한 판독 설계(read design)를 선택하는 것이 매우 중요합니다. 판독 설계는 이미지를 캡처하고 해석하는 데 사용되는 판독기의 수와 유형을 의미합니다. 변동성을 줄이면 영상 캡처 및 분석에 중대한 어려움이 발생합니다. 임상시험에는 다양한 영상 기법에서 얻은 이미지가 포함될 수 있으며, 영상의학과 전문의, 병리학자, 심장학자 등 전문가의 검토가 필요하기 때문입니다. 사용되는 판독 설계 유형은 임상시험에서 의료 이미지를 해석할 때 편향을 줄이는 데 매우 중요합니다. 단일 판독, 이중 판독, 그리고 판정자가 있는 이중 판독은 판독 디자인의 세 가지 주요 유형입니다. 단일 판독에서는 한 명의 판독자에 의해서만 영상이 해석됩니다. 이중 판독에서는 두 명 이상의 판독자가 영상을 해석합니다. 대규모 임상시험의 경우, 작업량이 많기 때문에 여러 명의 판독자가 필요할 수 있습니다. 이상적으로는 한 명(이중 판독 디자인의 경우 두 명)의 판독자가 연구 기간 동안 동일 환자의 모든 영상을 검토합니다. 여러 명의 판독자가 동일 환자의 서로 다른 영상 시점을 검토하면 추가적인 차이가 발생할 수 있습니다. 예를 들어, 종양학 임상시험은 일반적으로 다음 단계로 구성됩니다. 치료 전 병변 선택 및 측정을 위한 초기 스크리닝, 후속 영상 방문 시 병변의 순차적 선택 및 측정, 그리고 각 시점의 점진적인 방사선학적 반응 평가입니다.
Keosys Medical Imaging은 임상 시험에 사용되는 웹 기반 영상 및 판독 소프트웨어를 제공하여 판독자의 주관성을 제한하고, 측정 및 정량화 정확도를 높이며, 전반적인 운영 효율성, 데이터 품질 및 추적성을 개선합니다. Keosys에서 제공하는 판독 소프트웨어에는 고급 병변 관리 시스템과 다양한 치료 영역에 특화된 애플리케이션이 포함되어 있습니다. 이 판독 소프트웨어는 FDA 510(k) 승인을 받았으며 ISO 13485(의료기기)를 준수합니다. 임상 시험 영상 시장은 영상 방식에 따라 단층촬영, 초음파, 양전자방출단층촬영, X선, 심초음파, 자기공명영상 등으로 구분됩니다. 단층촬영 분야는 2021년에 가장 큰 점유율을 기록했으며, 예측 기간 동안에도 유사한 추세를 유지할 것으로 예상됩니다. 단층촬영은 중첩된 구조물의 그림자를 X선 영상에 사용되는 움직이는 X선관에 의해 흐릿하게 처리합니다. 연구 및 임상 시험에 사용되는 컴퓨터 단층촬영(CT) 영상은 다양한 각도에서 촬영한 X선 영상을 컴퓨터로 처리하여 뼈, 혈관, 연조직의 단면 영상을 제공합니다. 선형 및 비선형 단층촬영 시스템은 유사한 방식으로 작동합니다. 튜브는 한 방향으로 움직이고 필름 카세트는 반대 방향으로 움직이며, 두 기술 모두 받침점을 중심으로 움직입니다.
새로운 영상 기법을 도입하거나 기존 기법을 개선하려면 특정 질병 치료에 맞춰 정확한 타이밍을 유지해야 합니다. 적절한 시간에 영상 촬영을 예약하는 것은 대상의 해부학적 구조를 정확하게 해석하는 데 필수적입니다. 병원에서는 수술, 방사선 치료, 항암 화학 요법과 같은 치료를 효과적으로 시행하는 동시에 환자의 독성 및 이환율을 모니터링하는 데 도움이 됩니다. 종양학 분야의 임상 연구는 영상 촬영에 크게 의존하며, 특정 시간, 강도, 빈도로 수행되는 스캔 절차는 임상시험 프로토콜의 핵심입니다.
CT 스캔을 이용한 고급 영상 지표는 신약 개발 및 암 연구에 광범위하게 사용됩니다. 목, 흉부, 복부 또는 골반 부위에 영향을 미치는 진행성 암 관련 연구에 가장 많이 사용되는 영상 기법입니다.
지역 분석:
지역별로 임상 시험 영상 시장은 북미, 유럽, 아시아 태평양, 중남미, 중동 및 아프리카의 5개 주요 지역으로 구분됩니다. 2021년 북미는 임상 시험 영상 시장에서 가장 큰 점유율을 차지했으며, 그 뒤를 이어 유럽이 차지했습니다. 미국은 임상 연구의 주요 목적지로 부상했습니다. 전 세계적으로 수행되는 임상 시험의 거의 절반이 미국에서 수행됩니다. 또한, 대부분의 제약 연구 기업들은 확립된 의료 인프라, 신속한 승인 절차, 유리한 규제 체계, 그리고 전 세계적으로 인정받는 임상 시험 데이터 등을 이유로 미국에서 임상 시험을 수행하는 것을 선호합니다. 세계보건기구(WHO) 보고서에 따르면 미국은 2021년에 가장 많은 임상 시험을 등록했습니다(157,618건).
다음 표는 미국에 등록된 임상 시험 수, 해당 시험에 모집된 총 환자 수, 그리고 전 세계에서 해당 매개변수에 대한 미국의 점유율을 보여줍니다.
2023 |
등록된 임상 시험 연구 |
연구에 모집된 환자 |
|
미국 |
139,632명(전 세계 연구의 31%) |
20,680명(전 세계 직원 수의 32%) |
출처: ClinicalTrial.gov 보고서
임상 시험용 혁신 제품들이 기업들에 의해 출시되면서 미국 임상 시험 영상 시장 성장이 더욱 가속화되고 있습니다. 임상 시험용 영상 서비스를 제공하는 CRO(임상시험수탁기관)인 Medical Metrics는 "Assessa"를 제공합니다. 이 제품은 신약 개발 및 관련 임상 연구, 특히 치매, 인지 장애, 알츠하이머병, 조현병, 파킨슨병 및 기타 기억 관련 질환과 같은 신경 질환 치료제 개발에 있어 의사결정 개선을 지원합니다. 미국에서 임상 시험 건수가 증가함에 따라 미국 임상 시험 영상 시장 성장이 촉진되고 있습니다.
임상 시험 영상 시장 지역별 통찰력
The Insight Partners의 분석가들은 예측 기간 동안 임상 시험 영상 시장에 영향을 미치는 지역별 동향과 요인을 면밀히 분석했습니다. 이 섹션에서는 북미, 유럽, 아시아 태평양, 중동 및 아프리카, 그리고 중남미 지역의 임상 시험 영상 시장 부문과 지역별 분포도 살펴봅니다.
임상 시험 영상 시장 보고서 범위
| 보고서 속성 | 세부 |
|---|---|
| 시장 규모 2022 | US$ 1.61 Billion |
| 시장규모별 2028 | US$ 2.48 Billion |
| 글로벌 CAGR (2022 - 2028) | 7.6% |
| 이전 데이터 | 2020-2021 |
| 예측 기간 | 2023-2028 |
| 다루는 세그먼트 |
By 모달리티
|
| 포함된 지역 및 국가 |
북미
|
| 시장 선도 기업 및 주요 회사 프로필 |
|
임상 시험 영상 시장 참여자 밀도: 비즈니스 역학에 미치는 영향 이해
임상 시험 영상 시장은 소비자 선호도 변화, 기술 발전, 그리고 제품 효능에 대한 인식 제고 등의 요인으로 인한 최종 사용자 수요 증가에 힘입어 빠르게 성장하고 있습니다. 수요가 증가함에 따라 기업들은 제품 및 서비스 확장, 소비자 니즈 충족을 위한 혁신, 그리고 새로운 트렌드를 적극 활용하며 시장 성장을 더욱 가속화하고 있습니다.
- 을 얻으세요 임상 시험 영상 시장 주요 주요 플레이어 개요
글로벌 임상시험 영상 시장에서 활동하는 주요 기업들이 추진하고 있는 다양한 사업은 다음과 같습니다.
- 2022년 12월, Tata Consultancy Services(TCS)(BSE: 532540, NSE: TCS)는 분산형 임상시험을 위한 TCS ADD Connected Clinical Trials 플랫폼이 2022년 인도 제약 어워드(India Pharma Award)의 보조 제약 서비스 부문 우수상을 수상했다고 발표했습니다.
- 2021년 10월, 다쏘시스템 계열사인 Medidata는 자사의 클라우드 기반 보안 임상시험 영상 관리 플랫폼인 Rave Imaging이 1,000건 이상의 영상 연구를 지원하며 중요한 이정표를 달성했다고 발표했습니다. Medidata Unified Platform을 기반으로 구축된 Rave Imaging은 연간 1억 건 이상의 영상을 처리합니다. 이 기술은 모든 Rave Imaging 임상시험에서 모든 영상 관련 임상시험 활동에 대한 실시간 가시성을 제공하여 연구 효율성을 향상시킵니다.
경쟁 환경 및 주요 기업:
임상시험 영상 시장은 주로 eResearch Technology Inc, Calyx Inc, ICON PLC, VIDA Diagnostics Inc, WCG Clinical Inc, BioTelemetry Inc, Medical Metrics Inc, Medpace Holdings Inc, Radiant Sage LLC, IXICO plc와 같은 기업들로 구성되어 있습니다. 이들 기업은 성장에 도움이 되는 다양한 전략을 실행해 왔으며, 이는 시장에 다양한 변화를 가져왔습니다. 기업들은 유기적 전략(예: 출시, 확장, 제품 승인)과 비유기적 전략(예: 제품 출시, 파트너십, 협업)을 활용했습니다.

Mrinal은 생명 과학 시장 정보 분석 및 컨설팅 분야에서 8년 이상의 경력을 보유한 노련한 리서치 분석가입니다. 전략적 사고방식과 탁월함을 향한 확고한 의지를 바탕으로 제약 예측, 시장 기회 평가, 업계 벤치마크 개발 분야에서 심도 있는 전문 지식을 쌓아 왔습니다. 그녀의 업무는 고객이 정보에 기반한 전략적 의사 결정을 내릴 수 있도록 실질적인 통찰력을 제공하는 데 중점을 두고 있습니다.
Mrinal의 핵심 강점은 복잡한 정량적 데이터 세트를 의미 있는 비즈니스 인텔리전스로 변환하는 것입니다. 그녀의 분석적 통찰력은 제약 및 의료기기 분야의 시장 진출(GTM) 전략을 수립하고 성장 기회를 발굴하는 데 중요한 역할을 합니다. 신뢰할 수 있는 컨설턴트로서, 그녀는 고객의 워크플로 프로세스를 간소화하고 모범 사례를 구축하는 데 지속적으로 집중하여 혁신과 운영 효율성을 향상시킵니다.
- 포괄적인 시장 규모 산정 및 전망 분석
- 상세 시장 세분화 분석
- 심층적인 시장 동향 및 요인 분석
- 지역 및 국가별 인사이트
- 경쟁 구도 및 기업 벤치마킹
- 전략적 비즈니스 인텔리전스
사용 후기
Insight Partners의 SCADA 시스템 시장 보고서는 포괄적이며, 현재 동향과 미래 전망에 대한 귀중한 통찰력을 제공합니다. 팀은 매우 전문적이고, 신속하게 대응하며, 처음부터 끝까지 지원해 주었습니다. 저희는 매우 만족하며 Insight Partners의 서비스를 적극 추천합니다.
란 케뎀 파트너, Reali Technologies LTDs아주 구체적인 소프트웨어 시장에 대한 보고서를 요청했는데, 팀에서 며칠 만에 보고서를 작성해 주셨습니다. 정보는 매우 관련성이 높고 잘 정리되어 있었습니다. 그 후 보고서에 몇 가지 수정과 추가 사항을 요청했습니다. 팀원들의 응답도 매우 빨랐고, 일주일도 채 되지 않아 최종 보고서를 받았습니다.
장-에르브 젠 의장, 퓨처 애널리티카The Insight Partners와 함께 중요한 시장 조사 및 예측 작업을 진행했습니다. Insight Partners는 기회와 위험에 대한 명확한 통찰력을 제공하여 계획을 세우는 데 큰 도움이 되었습니다. The Insight Partners의 조사는 사용하기 쉬웠고, 탄탄한 데이터를 기반으로 했습니다. 덕분에 현명하고 자신 있는 결정을 내릴 수 있었습니다. The Insight Partners를 강력 추천합니다.
피유시 나그팔 수석 부사장, 하이빔 글로벌Insight Partners는 탄탄한 분야 전문성을 바탕으로 통찰력 있고 체계적인 시장 조사를 제공했습니다. Insight Partners 팀은 처음부터 끝까지 전문적이고 신속하게 대응했습니다. 사용자 친화적인 웹사이트 덕분에 업계 보고서에 쉽게 접근할 수 있었습니다. 신뢰할 수 있고 고품질의 조사 서비스를 원하신다면 Insight Partners를 강력 추천합니다.
아다치 유키히코 대표이사, 딥블루 주식회사The Insight Partners에서 시장 보고서를 구매한 것은 이번이 처음입니다. 처음에는 확신이 없었지만, 웹사이트를 방문하고 나서 위험을 감수하고 시장 보고서를 구매하는 것이 더 편하다는 것을 알게 되었습니다. 보고서의 품질과 고객 서비스에 매우 만족합니다. 처음 보고서를 보고 몇 가지 질문과 의견이 있었지만, 분석가와 이메일로 몇 차례 대화를 나눈 후, 전략 기획 과정에 참고할 수 있는 보고서를 확보했다고 생각합니다. 시간을 내어 긍정적인 경험을 선사해 주셔서 정말 감사합니다. 다른 사람들에게도 귀사의 서비스를 적극 추천할 것이며, 추가적인 시장 데이터가 필요할 때면 가장 먼저 귀사에 연락하겠습니다.
존 스즈키 사장 겸 최고 경영자, 이사회 이사, BK 테크놀로지스나이지리아 감염성 질환 IVD 시장 관련 정보 요청에 응해 주신 귀사의 지원과 전문성에 감사드립니다. 귀사의 인내심과 지도, 그리고 할인 혜택을 기꺼이 제공해 주셔서 결국 계약을 성사시킬 수 있었습니다. 첫 만남을 통해 귀사가 저에게 심어주신 좋은 인상을 바탕으로 앞으로도 The Insight Partners와 함께할 수 있기를 기대합니다.
치지오케 박사 오니아 전무이사, 파인크레스트 헬스케어 유한회사구매 이유
- 정보에 기반한 의사 결정
- 시장 역학 이해
- 경쟁 분석
- 고객 인사이트
- 시장 예측
- 위험 완화
- 전략 기획
- 투자 타당성 분석
- 신흥 시장 파악
- 마케팅 전략 강화
- 운영 효율성 향상
- 규제 동향에 발맞춰 대응


