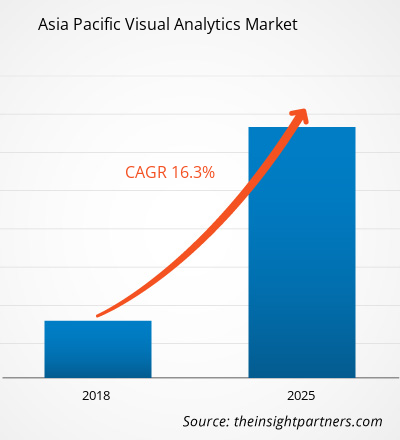
Visual analytics market in Asia Pacific is expected to grow from US$ 447.4 Mn in 2017 to US$ 1469.4 Mn by the year 2025. This represents a CAGR of 16.3% from the year 2018 to 2025.
It is becoming more imperative for organizations to run both core and non-core business functions through the cloud, and in line with this, companies are going to make a move to housing everything in one place faster. The advantages of the movement speak for themselves, as using the cloud improves data governance, streamline processes, and manage risk. Those organizations hesitant to make the shift to full integration will quickly find themselves on the back foot as investors increasingly insist on the cloud as a term of the investment. Cloud turns businesses into lean, mean efficient machines, so it is going to become non-negotiable for companies to run in the cloud if they want to remain competitive.
China is the most populated country in the world. Presence of advanced manufacturing industry and rising demand for smart cities presents a suitable environment for the adoption of advanced technology. However, China is transitioning from being a low-cost labor country and is investing heavily in digital transformation to retain its title for manufacturing hub. The growth of visual analytics market in China is majorly influenced by the various government initiative in the country due to which China is anticipated to foresee an 8.5% year-on-year growth in software spending. The Government initiatives in the country include Industry 4.0, and Internet Plus integrating IT with manufacturing. Also, the government has proposed 46 pilot projects that will focus on innovation to implement smart manufacturing as part of its 'Made in China 2025' initiative; which will further fuel the demand for machine learning powered solutions. Thus, the region is anticipating the increasing development and adoption of visual analytic solutions in the forecast period. Therefore, the region is expected to adopt the visual analytic solutions rapidly in the forecast period. The figure given below highlights the revenue share of Australia in the Asia Pacific visual analytics market in the forecast period:
Australia Visual Analytics Market Revenue and Forecasts to 2025 (US$ Bn)
.PNG")
- This FREE sample will include data analysis, ranging from market trends to estimates and forecasts.
Asia Pacific Visual Analytics Market By Deployment Model
• Cloud • On-Premise- This FREE sample will include data analysis, ranging from market trends to estimates and forecasts.
Asia Pacific Visual analytics Market By Business Function
• Sales and Marketing • Operations • Finance • Supply Chain • Information Technology • CRM• Human Resources • OthersAsia Pacific Visual Analytics Market By Vertical
• Retail & Consumer Goods Market• IT & Telecom• BFSI• Manufacturing • Energy & Utilities• Healthcare• Government• OthersAsia Pacific Visual analytics Market By Country
• China • India • Australia• Japan• Rest of Asia PacificCompanies Mentioned
• ALTERYX, INC.• IBM CORPORATION• Microsoft Corporation• MICROSTRATEGY INCORPORATED• ORACLE CORPORATION• QLIK TECHNOLOGIES INC• SAP SE• SAS INSTITUTE INC.• Tableau Software• TIBCO SOFTWARE INC.Asia Pacific Visual Analytics Report Scope
| Report Attribute | Details |
|---|---|
| Market size in 2017 | US$ 447.4 Million |
| Market Size by 2025 | US$ 1469.4 Million |
| Global CAGR (2018 - 2025) | 16.3% |
| Historical Data | 2015-2016 |
| Forecast period | 2018-2025 |
| Segments Covered |
By Deployment Model
|
| Regions and Countries Covered | Asia-Pacific
|
| Market leaders and key company profiles |
- Historical Analysis (2 Years), Base Year, Forecast (7 Years) with CAGR
- PEST and SWOT Analysis
- Market Size Value / Volume - Global, Regional, Country
- Industry and Competitive Landscape
- Excel Dataset

Report Coverage
Revenue forecast, Company Analysis, Industry landscape, Growth factors, and Trends

Segment Covered
Deployment Model, Business Function, Vertical

Regional Scope
North America, Europe, Asia Pacific, Middle East & Africa, South & Central America

Country Scope
Australia, China, Japan, South Korea
Trends and growth analysis reports related to Technology, Media and Telecommunications : READ MORE..
The List of Companies
- ALTERYX, INC.
- IBM CORPORATION
- Microsoft Corporation
- MICROSTRATEGY INCORPORATED
- ORACLE CORPORATION
- QLIK TECHNOLOGIES INC
- SAP SE
- SAS INSTITUTE INC.
- Tableau Software
- TIBCO SOFTWARE INC.
 Get Free Sample For