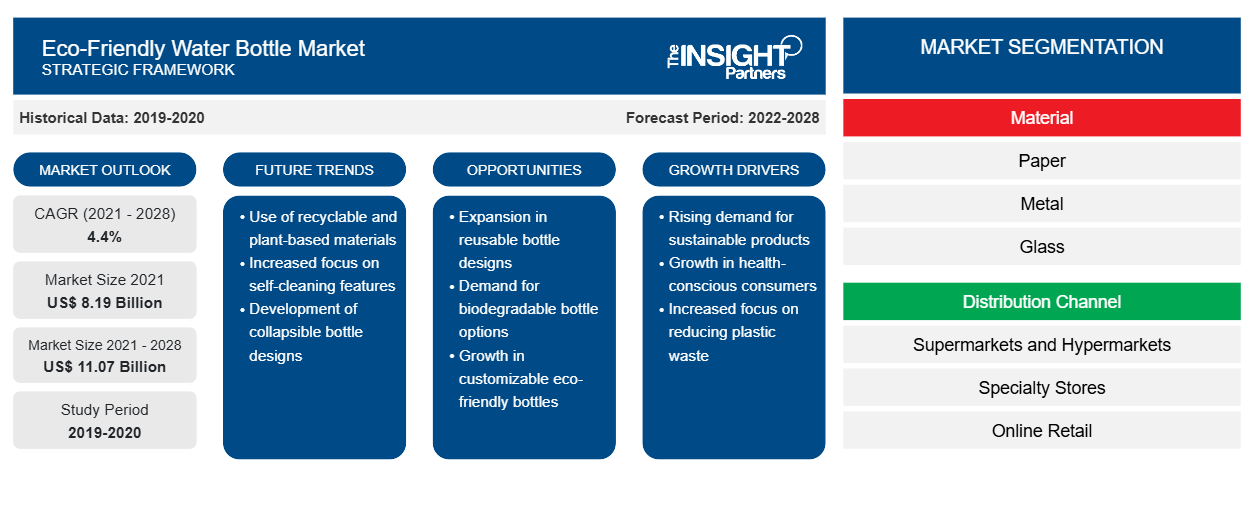
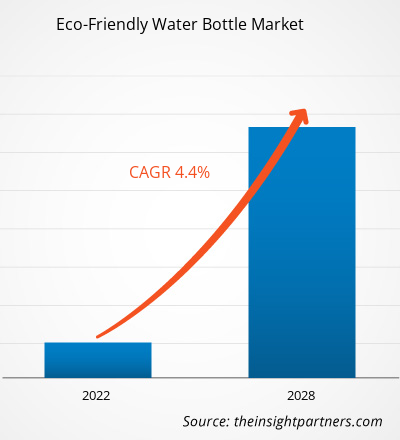
The eco-friendly water bottle market size is projected to reach US$ 11,068.71 million by 2028 from US$ 8,193.19 million in 2021; it is expected to grow at a CAGR of 4.4% during 2021-2028.
The growth of the market is attributed to the rapidly growing environmental awareness among consumers. Consumers are proactively replacing single-use plastic water bottles with eco-friendly water bottles to prevent plastic accumulation in the environment. The trend is aided by social media channels where influencers are promoting the use of reusable water bottles as an ethical choice.
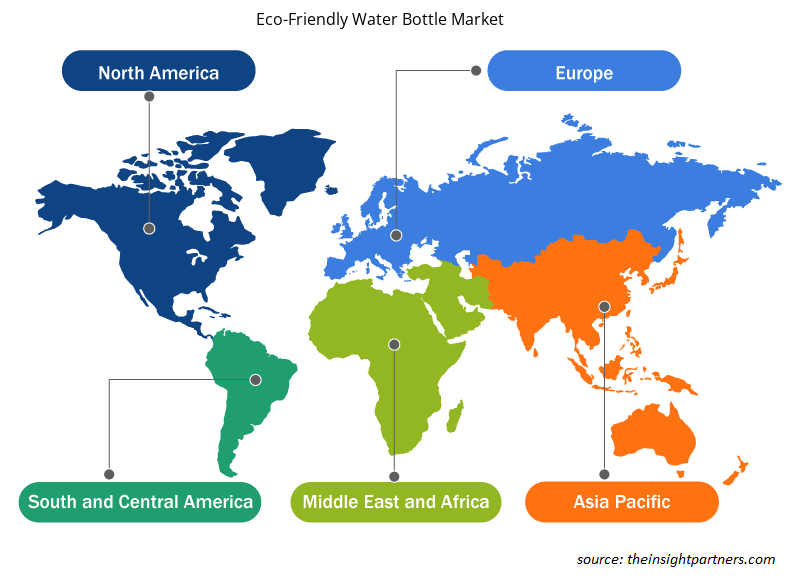
In 2020, Asia Pacific held the largest share of the eco-friendly water bottle market, and it is estimated to register the highest CAGR in during the forecast period. The market in Asia Pacific is segmented into China, India, Japan, South Korea, and Australia. Countries such as South Korea, China, and Japan are among the major contributors to the market in this region due to the growing population and subsequent demand for consumer goods. Further, rapid urbanization, remarkable economic development, cultural diversity, and growing adoption of high-tech trends are the factors favoring the Asia Pacific eco-friendly water bottle market growth.
Customize This Report To Suit Your Requirement
You will get customization on any report - free of charge - including parts of this report, or country-level analysis, Excel Data pack, as well as avail great offers and discounts for start-ups & universities
Eco-Friendly Water Bottle Market: Strategic Insights
- Get Top Key Market Trends of this report.This FREE sample will include data analysis, ranging from market trends to estimates and forecasts.
Impact of COVID-19 Pandemic on Eco-Friendly Water Bottle Market
The COVID-19 pandemic had significantly disrupted the manufacturing sector in terms of operational efficiency owing to extended lockdowns across different regions; manufacturing units shutdown; restrictions on travel, international trades, and supply chains; and shortage of raw materials. These factors have also hindered the growth of the market owing to rising prices of raw materials, shortage of workforce, and instability on the financial front. However, businesses are gaining ground as previously imposed limitations are being eased across various countries, with the introduction and administration of COVID-19 vaccines. Furthermore, governments of different countries are planning to develop modern and technologically advanced infrastructure to mitigate the economic impacts of the pandemic. Moreover, during the late pandemic phases, consumers participated in outdoor recreational activities, which aided the demand for eco-friendly water bottles.
Market Insights
Spurring Technological Developments Fuel Eco-Friendly Water Bottle Market Growth
Eco-friendly water bottles are made from glass, plant-based plastics, paper, and other sustainable raw materials. Manufacturers focus on adopting bio-based plastics, recyclable metals, and glass to manufacture eco-friendly water bottles. Bio-based plastics are made from renewable materials, such as soy and corn, rather than fossil fuels. These products reduce reliance on fossil fuels by using renewable resources. Eco-friendly water bottles are increasingly used in various commercial spaces, such as workshops, pool houses, hotels, gyms and other sports facilities, spas and beauty salons, and hospitals and medical facilities.
According to the International Bottled Water Association (IBWA) data published in 2020, Americans consumed 15 billion gallons of bottled water in 2020. This signifies the market potential for eco-friendly water bottle providers for expanding their reach. It encourages manufacturers to adopt new technologies for producing eco-friendly solutions.
Distribution Channel Insights
Based on distribution channel, the global eco-friendly water bottle market is segmented into supermarkets and hypermarkets, specialty stores, online retail, and others. In 2020, the supermarkets and hypermarkets segment accounted for the largest revenue share, and the online retail segment is expected to register the highest CAGR during the forecast period. Supermarkets and hypermarkets are easily accessible in all regions and widespread in terms of locations. They adopt attractive merchandising techniques that appeal to consumers, thus generating higher sales for eco-friendly water bottles.
Chilly's; S'well; Ocean Bottle; Corkcicle; Hydro Flask; Bottles Società Benefit S.r.l. P.IVA; Frank Green; Qwetch; Klean Kanteen; and Kinto Co., Ltd. are among the players operating in the eco-friendly water bottle market. These companies provide a wide range of product portfolio for the market. Many companies in this market have presence in developing regions, which provides lucrative opportunities to them. The market players are developing high-quality and innovative products to meet the customer’s requirements.
Eco-Friendly Water Bottle Market Regional Insights
The regional trends and factors influencing the Eco-Friendly Water Bottle Market throughout the forecast period have been thoroughly explained by the analysts at Insight Partners. This section also discusses Eco-Friendly Water Bottle Market segments and geography across North America, Europe, Asia Pacific, Middle East and Africa, and South and Central America.
- Get the Regional Specific Data for Eco-Friendly Water Bottle Market
Eco-Friendly Water Bottle Market Report Scope
| Report Attribute | Details |
|---|---|
| Market size in 2021 | US$ 8.19 Billion |
| Market Size by 2028 | US$ 11.07 Billion |
| Global CAGR (2021 - 2028) | 4.4% |
| Historical Data | 2019-2020 |
| Forecast period | 2022-2028 |
| Segments Covered |
By Material
|
| Regions and Countries Covered | North America
|
| Market leaders and key company profiles |
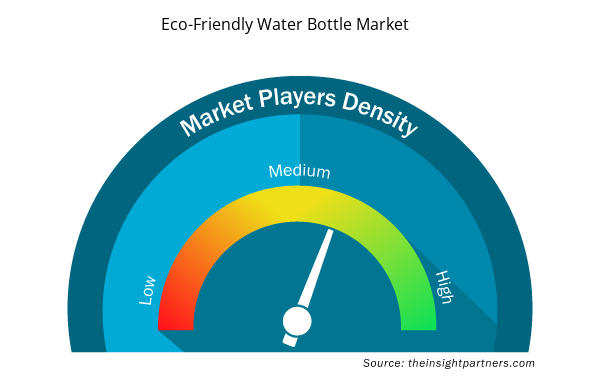
Eco-Friendly Water Bottle Market Players Density: Understanding Its Impact on Business Dynamics
The Eco-Friendly Water Bottle Market is growing rapidly, driven by increasing end-user demand due to factors such as evolving consumer preferences, technological advancements, and greater awareness of the product's benefits. As demand rises, businesses are expanding their offerings, innovating to meet consumer needs, and capitalizing on emerging trends, which further fuels market growth.
Market players density refers to the distribution of firms or companies operating within a particular market or industry. It indicates how many competitors (market players) are present in a given market space relative to its size or total market value.
Major Companies operating in the Eco-Friendly Water Bottle Market are:
- Chilly
Disclaimer: The companies listed above are not ranked in any particular order.
- Get the Eco-Friendly Water Bottle Market top key players overview
Report Spotlights
- Progressive industry trends in the market to help players develop effective long-term strategies
- Business growth strategies adopted by developed and developing markets
- Quantitative analysis of the market from 2019 to 2028
- Estimation of global demand for eco-friendly water bottles
- PEST analysis to illustrate the efficacy of buyers and suppliers operating in the consumer goods industry
- Recent developments to understand the competitive market scenario
- Market trends and outlook as well as factors driving and restraining the growth of the eco-friendly water bottle market
- Assistance in decision-making process by highlighting market strategies that underpin commercial interest, leading to the market growth
- The eco-friendly water bottle market size at various nodes
- Detailed overview and segmentation of the market, as well as the eco-friendly water bottle industry dynamics
- Size of the eco-friendly water bottle market in various regions with promising growth opportunities
The "Global Eco-Friendly Water Bottle Market Analysis to 2028" is a specialized and in-depth study of the chemicals and materials industry with a special focus on the global eco-friendly water bottle market trend analysis. The report aims to provide an overview of the market with detailed market segmentation. The eco-friendly water bottle market is segmented on the basis of material, distribution channel, and geography. By material, the market is segmented into paper, metal, glass, and others. By distribution channel, the market is segmented into supermarkets and hypermarkets, specialty stores, online retail, and others. By geography, the eco-friendly water bottle market is broadly segmented into North America, Europe, Asia Pacific (APAC), the Middle East & Africa (MEA), and South and Central America (SAM).
Company Profiles
- Chilly's
- S'well
- Ocean Bottle
- Corkcicle
- Hydro Flask
- Bottles Società Benefit S.r.l. P.IVA
- Frank Green
- Qwetch
- Klean Kanteen
- Kinto Co., Ltd.
- Historical Analysis (2 Years), Base Year, Forecast (7 Years) with CAGR
- PEST and SWOT Analysis
- Market Size Value / Volume - Global, Regional, Country
- Industry and Competitive Landscape
- Excel Dataset

Report Coverage
Revenue forecast, Company Analysis, Industry landscape, Growth factors, and Trends

Segment Covered
Material, Distribution Channel

Regional Scope
North America, Europe, Asia Pacific, Middle East & Africa, South & Central America

Country Scope
Argentina, Australia, Brazil, Canada, China, France, Germany, India, Italy, Japan, Mexico, Russia, Saudi Arabia, South Africa, South Korea, UAE, UK, US
Frequently Asked Questions
What is the key driver for the growth of the global eco-friendly water bottle market?
The global eco-friendly bottle market is expanding rapidly due to increased public and government awareness about environmental protection. The crucial driver propelling the market is the increased availability of a diverse selection of items from various brands on e-commerce platforms with services such as free delivery and promotional discounts.
Which material segment is expected to account for the fastest growth in the global eco-friendly water bottle market?
Based on material, the metal segment is expected to be the fastest-growing segment during the forecast period. The characteristics of metal water bottles, such as durability and reusability, are expected to propel the eco-friendly water bottle market growth.
Which distribution channel segment accounted for the largest share in the eco-friendly water bottle market?
In 2020, the supermarkets and hypermarkets segment held the largest market share. The availability of a wide variety of products under one roof attract customers to shop at these stores. Furthermore, consumer-oriented product placement that aids them in selecting and purchasing the product faster than waiting for its delivery, as is the case with online purchases.
Which material segment accounted for the largest share in the eco-friendly water bottle market?
In 2020, the metal segment held the largest market share. Metal acts as a better shielding barrier than any plastic material. Metal is abundant in nature and can be recycled again with minimal energy waste during manufacture, lowering the overall cost of production for eco-friendly water bottles. These factors contribute to the growth of the eco-friendly water bottle market.
Can you list some of the major players operating in the global eco-friendly water bottles market?
The major players operating in the eco-friendly water bottles market are Chilly's, S'well, Ocean Bottle, Corkcicle, Hydro Flask, 24 Bottles Società Benefit S.r.l. P.IVA, Frank Green, Qwetch, Klean Kanteen, and Kinto Co., Ltd.
In 2020, which region held the largest share of the global eco-friendly water bottles market?
In 2020, Asia-Pacific accounted for the largest share of the global eco-friendly water bottles market. The eco-friendly water bottle market has expanded significantly as governments and consumers have become more concerned about environmental issues. Manufacturers' increasing investments on research and development are crucial factors impacting the eco-friendly water bottle market positively.
Trends and growth analysis reports related to Consumer Goods : READ MORE..
The List of Companies - Eco-Friendly Water Bottle Market
- Chilly’s
- S'well
- Ocean Bottle
- Corkcicle
- Hydro Flask
- 24 Bottles Società Benefit S.r.l. P.IVA
- Frank Green
- Qwetch
- Klean Kanteen
- Kinto Co., Ltd.
 Get Free Sample For