PACS and RIS Market Size, Share, and Analysis by 2031
Historic Data: 2021-2022 | Base Year: 2023 | Forecast Period: 2023-2031PACS and RIS Market Size and Forecast (2021 - 2031), Global and Regional Share, Trend, and Growth Opportunity Analysis Report Coverage: By Product (PACS and RIS), Component (Hardware, Software, and Services), Deployment (On-Premise, Web-Based & Cloud-Based), End User (Hospitals, Diagnostic Centers, Research & Academic Institutes, and Others), and Geography
- Report Date : Sep 2025
- Report Code : TIPRE00003005
- Category : Life Sciences
- Status : Data Released
- Available Report Formats :


- No. of Pages : 150
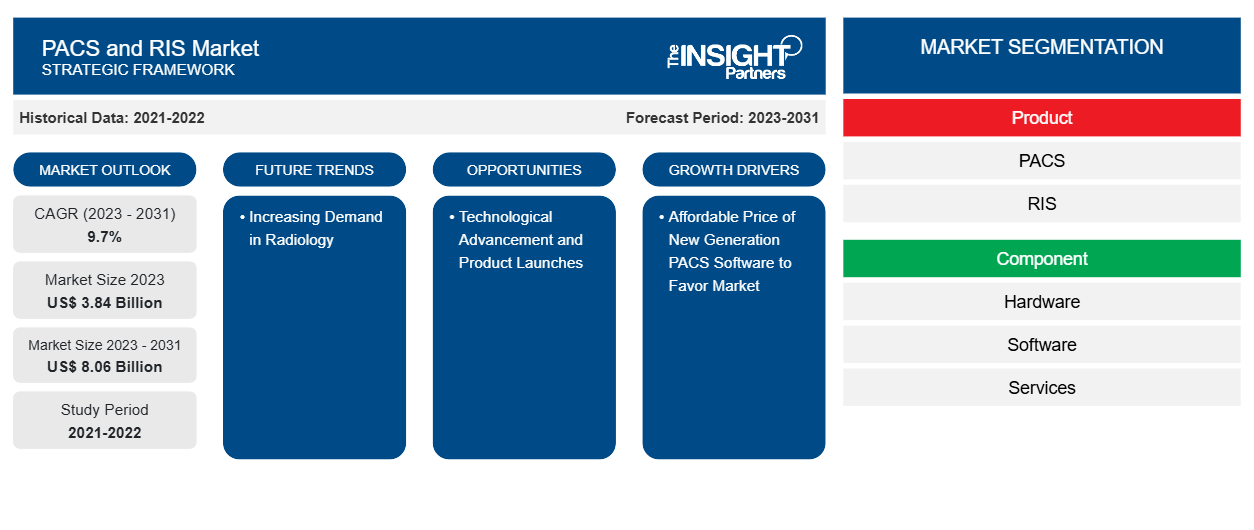
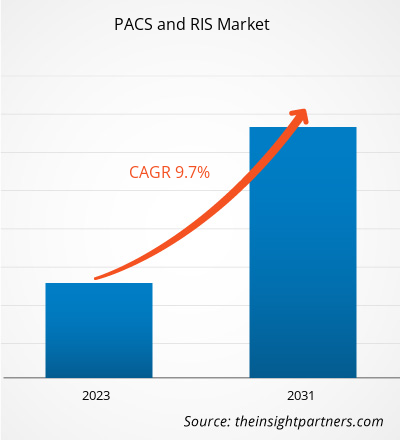
The PACS and RIS market size is projected to reach US$ 8.06 billion by 2031 from US$ 3.84 billion in 2023. The market is expected to register a CAGR of 9.7% in 2023–2031. Technological advancement and product launches will likely remain a vital PACS and RIS market trend.
PACS and RIS Market Analysis
PACS-related skills are redefining the potential of diagnostic medical imaging and transforming patient care possibilities. Key factors driving the growth of the PACS and RIS market are usage of Artificial Intelligence (AI) in radiology and medical imaging and RIS/PACS combination systems. Integrated AI improves the radiological decision process to more serviceable level, mainly due to the progressive factions in algorithm development and increased availability of computational resourcing. Furthermore, many corporations and medical imaging practitioners are shifting to cloud PACS solutions from on-premises PACS systems. This immediate shift is mainly due to benefits like cost effectiveness, scalability, and, data security.
PACS and RIS Market Overview
Diabetes, stroke, heart disease, cancer, and other chronic diseases are leading causes of death that requires several imaging sensory system for diagnostic and treatment monitoring purposes. Usage of PACS provides various advantages for patients and increases the hospitals efficiency in treating the chronic diseases. PACS in hospitals reduces the longer examination and patient waiting times. It also provides appropriate treatment for chronic disease patients, thus, offering significant growth opportunity for the market in the coming years.
Customize This Report To Suit Your Requirement
You will get customization on any report - free of charge - including parts of this report, or country-level analysis, Excel Data pack, as well as avail great offers and discounts for start-ups & universities
PACS and RIS Market: Strategic Insights
- Get Top Key Market Trends of this report.This FREE sample will include data analysis, ranging from market trends to estimates and forecasts.
PACS and RIS Market Drivers and Opportunities
Affordable Price of New Generation PACS Software to Favor Market
Modern PACS are available at affordable price than its older versions. Pricing varies based on volume or studies, the practice size, and particular integrations needed. On-site 1,000 PACS studies can cost less than US$ 10,000 for a month and annual maintenance and support fees of US$2,000. On-site PACS is less costly than cloud-based PACS. Furthermore, the storage cost is up to US $50, i.e., 5% of the earlier cost. Also, the software price for a month usage is US$1,500, excluding the preliminary setup and an internet-capable viewing station or personal computer. The above factors is driving the PACS and RIS market growth.
Increasing Demand in Radiology – An Opportunity in PACS and RIS Market
Radiology Information System (RIS) and Picture Archiving and Communication System (PACS) are two primary solutions to maintain and manage organization imaging in the field of radiology. RIS efficiently manages data flow throughout reporting processing, whereas PACS efficiently transports private patient medical imaging information. After integrating RIS and PACS, healthcare professionals access medical images easily, reducing claims denials due to incorrectly entered information. Other factors such as image tracking, specific procedure reporting, automated billing, and other is helping radiology professionals to keep track of patient data. Thus, propelling the growth of PACS and RIS Market.
PACS and RIS Market Report Segmentation Analysis
Key segments that contributed to the derivation of the PACS and RIS market analysis are product, component, deployment, and end user.
- Based on product, the PACS and RIS market is bifurcated into PACS and RIS. The PACS segment held a larger market share in 2023.
- Based on component, the market is segmented into hardware, software, and services. The software segment held a larger market share in 2023.
- Based on deployment, the market is bifurcated into on-premise and web-based & cloud-based The web-based & cloud-based segment held a larger market share in 2023.
- In terms of end user, the market is divided into hospitals, diagnostic centers, research & academic institutes, and others. The hospital segment dominated the market in 2023.
PACS and RIS Market Share Analysis by Geography
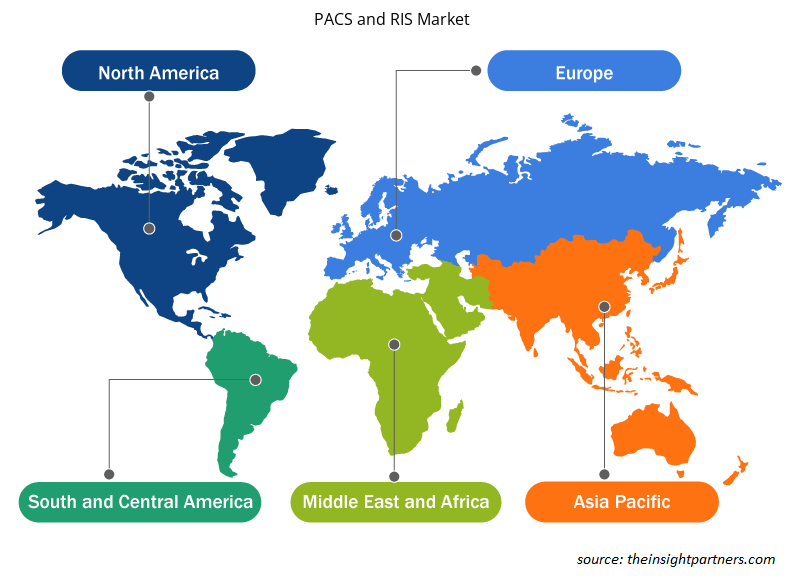
The geographic scope of the PACS and RIS market report is mainly divided into five regions: North America, Europe, Asia Pacific, Middle East & Africa, and South America/South & Central America. The PACS and RIS market in North America is significant. The PACS and RIS market is growing and experiencing exponential growth in North America. The region's growth is mainly driven by government investment in healthcare infrastructure, increasing awareness regarding medical imaging and its benefits associated with the implementation of PACS and RIS. In March 2024, Synthesis Health launched a radiology workflow platform developer. This platform features several modules, including AI-based speech recognition capability, a workflow and reporting package, and a diagnostic and enterprise viewer. The above factors are expected to affect the PACS and RIS market growth positively.
PACS and RIS Market Regional Insights
The regional trends and factors influencing the PACS and RIS Market throughout the forecast period have been thoroughly explained by the analysts at The Insight Partners. This section also discusses PACS and RIS Market segments and geography across North America, Europe, Asia Pacific, Middle East and Africa, and South and Central America.
- Get the Regional Specific Data for PACS and RIS Market
PACS and RIS Market Report Scope
| Report Attribute | Details |
|---|---|
| Market size in 2023 | US$ 3.84 Billion |
| Market Size by 2031 | US$ 8.06 Billion |
| Global CAGR (2023 - 2031) | 9.7% |
| Historical Data | 2021-2022 |
| Forecast period | 2023-2031 |
| Segments Covered |
By Product
|
| Regions and Countries Covered | North America
|
| Market leaders and key company profiles |
PACS and RIS Market Players Density: Understanding Its Impact on Business Dynamics
The PACS and RIS Market is growing rapidly, driven by increasing end-user demand due to factors such as evolving consumer preferences, technological advancements, and greater awareness of the product's benefits. As demand rises, businesses are expanding their offerings, innovating to meet consumer needs, and capitalizing on emerging trends, which further fuels market growth.
Market players density refers to the distribution of firms or companies operating within a particular market or industry. It indicates how many competitors (market players) are present in a given market space relative to its size or total market value.
Major Companies operating in the PACS and RIS Market are:
- Agfa-Gevaert Group
- INFINITT Healthcare Co., Ltd.
- McKesson Corporation
- Cerner Corporation
- General Electric Company
- Koninklijke Philips N.V.
Disclaimer: The companies listed above are not ranked in any particular order.
- Get the PACS and RIS Market top key players overview
PACS and RIS Market News and Recent Developments
The PACS and RIS market is evaluated by gathering qualitative and quantitative data post primary and secondary research, which includes important corporate publications, association data, and databases. The following is a list of developments in the market for innovations, business expansion, and strategies:
- In May 2024, the US-based healthcare system, Change Healthcare launched Cloud-Native PACS. The company focus on transition from on-premise imaging systems to cloud-based and zero-footprint medical imaging solutions, PACS and its related tools for both cardiology and radiology (Source: Change Healthcare, Press Release)
- In September 2023, On World Patient Safety Day 2023, the Patient for Patient Safety Foundation (PFPSF) and Consortium of Accredited Healthcare Organizations (CAHO) joined forces to highlight the importance of patient engagement through the creation of Patient Advisory Councils (PACs) and the promotion of Patient Reported Experience Measures (PREMs) (Source: Patient for Patient Safety Foundation (PFPSF), Newsletter)
PACS and RIS Market Report Coverage and Deliverables
The “PACS and RIS Market Size and Forecast (2021–2031)” report provides a detailed analysis of the market covering the following areas:
- PACS and RIS Market size and forecast at global, regional, and country levels for all the key market segments covered under the scope
- Market dynamics such as drivers, restraints, and key opportunities
PACS and RIS Market trends
- Detailed PEST/Porter’s Five Forces and SWOT analysis
- PACS and RIS market analysis covering key market trends, Global and regional framework, major players, regulations, and recent market developments
- PACS and RIS Industry landscape and competition analysis covering market concentration, heat map analysis, prominent players, and recent developments
- Detailed company profiles

Market Research & Consulting
- Historical Analysis (2 Years), Base Year, Forecast (7 Years) with CAGR
- PEST and SWOT Analysis
- Market Size Value / Volume - Global, Regional, Country
- Industry and Competitive Landscape
- Excel Dataset
Testimonials
I wish to appreciate your support and the professionalism you displayed in the course of attending to my request for information regarding to infectious disease IVD market in Nigeria. I appreciate your patience, your guidance, and the fact that you were willing to offer a discount, which eventually made it possible for us to close a deal. I look forward to engaging The Insight Partners in the future, all thanks to the impression you have created in me as a result of this first encounter.
DR CHIJIOKE ONYIA MANAGING DIRECTOR, PineCrest Healthcare Ltd.The Insight Partners delivered insightful, well-structured market research with strong domain expertise. Their team was professional and responsive throughout. The user-friendly website made accessing industry reports seamless. We highly recommend them for reliable, high-quality research services
YUKIHIKO ADACHI CEO, Deep Blue, LLC.We worked with The Insight Partners for an important market study and forecast. They gave us clear insights into opportunities and risks, which helped shape our plans. Their research was easy to use and based on solid data. It helped us make smart, confident decisions. We highly recommend them.
PIYUSH NAGPAL Sr. Vice President, Market ResearchThe research report delivered details on drivers and restraints, trends, and opportunities, along with strategic activities in the market. Previously, we were struggling to get reliable information.
Manager Medical Devices ManufacturingReason to Buy
- Informed Decision-Making
- Understanding Market Dynamics
- Competitive Analysis
- Identifying Emerging Markets
- Customer Insights
- Market Forecasts
- Risk Mitigation
- Boosting Operational Efficiency
- Strategic Planning
- Investment Justification
- Tracking Industry Innovations
- Aligning with Regulatory Trends
Yes! We provide a free sample of the report, which includes Report Scope (Table of Contents), report structure, and selected insights to help you assess the value of the full report. Please click on the "Download Sample" button or contact us to receive your copy.
Absolutely — analyst assistance is part of the package. You can connect with our analyst post-purchase to clarify report insights, methodology or discuss how the findings apply to your business needs.
Once your order is successfully placed, you will receive a confirmation email along with your invoice.
• For published reports: You’ll receive access to the report within 4–6 working hours via a secured email sent to your email.
• For upcoming reports: Your order will be recorded as a pre-booking. Our team will share the estimated release date and keep you informed of any updates. As soon as the report is published, it will be delivered to your registered email.
We offer customization options to align the report with your specific objectives. Whether you need deeper insights into a particular region, industry segment, competitor analysis, or data cut, our research team can tailor the report accordingly. Please share your requirements with us, and we’ll be happy to provide a customized proposal or scope.
The report is available in either PDF format or as an Excel dataset, depending on the license you choose.
The PDF version provides the full analysis and visuals in a ready-to-read format. The Excel dataset includes all underlying data tables for easy manipulation and further analysis.
Please review the license options at checkout or contact us to confirm which formats are included with your purchase.
Our payment process is fully secure and PCI-DSS compliant.
We use trusted and encrypted payment gateways to ensure that all transactions are protected with industry-standard SSL encryption. Your payment details are never stored on our servers and are handled securely by certified third-party processors.
You can make your purchase with confidence, knowing your personal and financial information is safe with us.
Yes, we do offer special pricing for bulk purchases.
If you're interested in purchasing multiple reports, we’re happy to provide a customized bundle offer or volume-based discount tailored to your needs. Please contact our sales team with the list of reports you’re considering, and we’ll share a personalized quote.
Yes, absolutely.
Our team is available to help you make an informed decision. Whether you have questions about the report’s scope, methodology, customization options, or which license suits you best, we’re here to assist. Please reach out to us at sales@theinsightpartners.com, and one of our representatives will get in touch promptly.
Yes, a billing invoice will be automatically generated and sent to your registered email upon successful completion of your purchase.
If you need the invoice in a specific format or require additional details (such as company name, GST, or VAT information), feel free to contact us, and we’ll be happy to assist.
Yes, certainly.
If you encounter any difficulties accessing or receiving your report, our support team is ready to assist you. Simply reach out to us via email or live chat with your order information, and we’ll ensure the issue is resolved quickly so you can access your report without interruption.


 Get Free Sample For