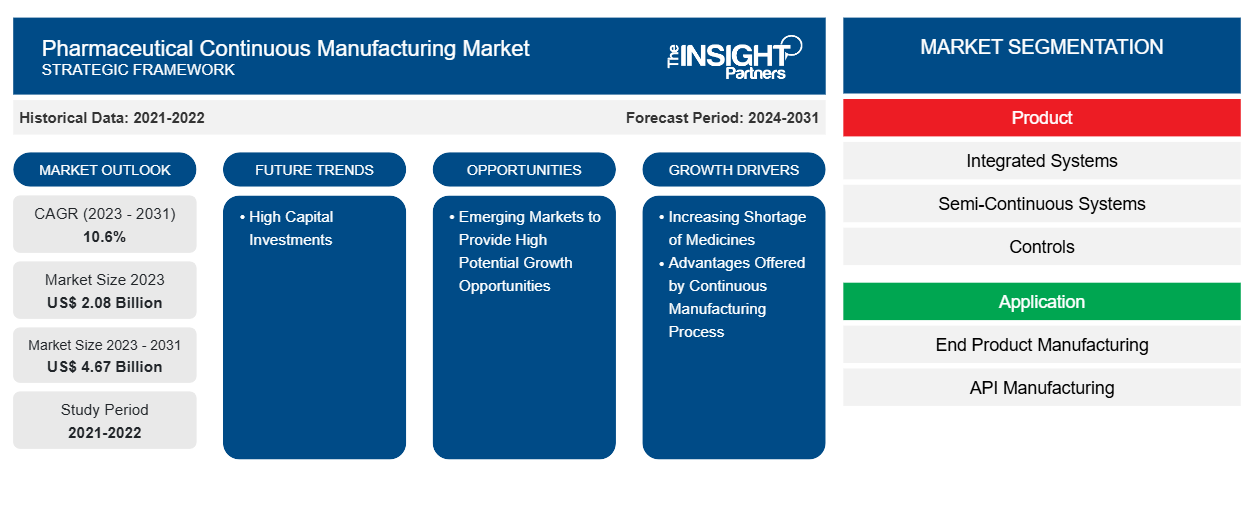
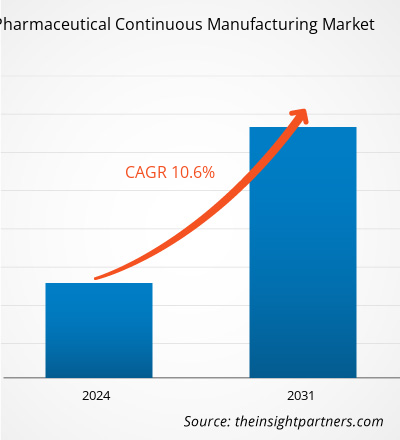
The pharmaceutical continuous manufacturing market size is projected to reach US$ 4.67 billion by 2031 from US$ 2.08 billion in 2023. The market is expected to register a CAGR of 10.6% during 2023–2031. Growing support from regulatory bodies, rising adoption by contract and in-house manufacturers for drug manufacturing procedures, and advantages associated with continuous manufacturing are likely to remain key trends in the market.
Pharmaceutical Continuous Manufacturing Market Analysis
Pharmaceutical companies are constantly investing into innovative manufacturing technologies for gaining competitive advantage and staying ahead in the market, thereby driving the continuous manufacturing market. Continuous manufacturing permits the pharmaceutical companies to have greater control over their production process, which helps in quality improvement and consistency of the end product, thereby reducing deviations, wastage, and saving rework time and recall costs. Pharmaceutical continuous manufacturing can improve the quality of the final product, enhance process control, and permit real-time release testing. The European Medicines Agency (EMA) and the US Food and Drug Administration (FDA) are the regulatory bodies that are increasingly favouring the use of continuous manufacturing in the pharmaceutical industry. Furthermore, continuous manufacturing has become more appealing and practical in the pharmaceutical industry because of the improved process monitoring, control, and optimization provided through the means of automation, system control, data analytics, and process analysis technology (PAT), which drives the market.
Pharmaceutical Continuous Manufacturing Market Overview
As a viable solution for minimizing pressure and reducing drug development time and costs, while also maintaining end-product quality and supply in the pharmaceutical industry continuous manufacturing is highly being used. Therefore, owing to such benefits the continuous manufacturing market is witnessing healthy growth. Additionally, growing initiatives for promoting the use of continuous pharmaceutical manufacturing systems by the Food and Drug Administration (FDA) and the numerous advantages of continuous manufacturing systems over batch manufacturing are some of the main factors that are driving the growth of the market. However, on the other hand the high cost implementation of pharmaceutical continuous manufacturing systems is likely to hinder the market growth.
Customize This Report To Suit Your Requirement
You will get customization on any report - free of charge - including parts of this report, or country-level analysis, Excel Data pack, as well as avail great offers and discounts for start-ups & universities
Pharmaceutical Continuous Manufacturing Market: Strategic Insights
- Get Top Key Market Trends of this report.This FREE sample will include data analysis, ranging from market trends to estimates and forecasts.
Pharmaceutical Continuous Manufacturing Market Drivers and Opportunities
Advantages Offered by Continuous Manufacturing Process to Favor Market
Pharmaceutical continuous manufacturing are being embraced and gaining importance due to the rising demand for biologics and flexible manufacturing alternatives. The companies that are transitioning to continuous manufacturing procedures are getting approvals from the FDA quickly. The the continuous manufacturing process offers many advantages that include time-efficiency, reduced energy needs and wastage, and increased productivity. In addition, the process reduces the risk of human error owing to the involvement of few of people in the manufacturing process. Therefore, owing to aforementioned advantages offered by continuous manufacturing the market is expected to grow over the coming years.
Emerging Markets to Provide High Potential Growth Opportunities
Attractive outsourcing locations for biopharmaceutical industries are emerging in the regions such as Asia Pacific and South & Central. China and India provide low manufacturing and operating costs that are significant factors for driving the market growth in the Asia Pacific region. Both China and India indicate positive future outlook for the market owing to the recent growth in the biopharmaceutical industry in both countries. In January 2020, STA Pharmaceutical Co., Ltd., – a subsidiary of WuXi AppTec opened a new large-scale oligonucleotide active pharmaceutical ingredient (API) manufacturing facility in China. Thus, the emerging markets suitable for biopharmaceutical industry are likely to act as high potential growth and revenue generators in the pharmaceutical continuous manufacturing market.
Pharmaceutical Continuous Manufacturing Market Report Segmentation Analysis
Key segments that contributed to the derivation of the pharmaceutical continuous manufacturing market analysis are product, application, and end user.
- Based on product, the pharmaceutical continuous manufacturing market is segmented into integrated systems, semi-continuous systems, and controls. The integrated systems segment held the largest market share in 2023 and the same is expected to register highest CAGR during the forecast period.
- By application, the market is divided end product manufacturing and API manufacturing. The end product manufacturing segment is further divided into solid dosage manufacturing and liquid dosage manufacturing. The end product manufacturing segment held the largest share of the market in 2023. However, the API manufacturing segment is anticipated to register highest CAGR during 2021–2031.
- Based on end user, the pharmaceutical continuous manufacturing market is bifurcated into full-scale manufacturing companies and R&D departments. The full-scale manufacturing segment held the largest market share in 2023 and the same is expected to register highest CAGR during the forecast period.
Pharmaceutical Continuous Manufacturing Market Share Analysis by Geography
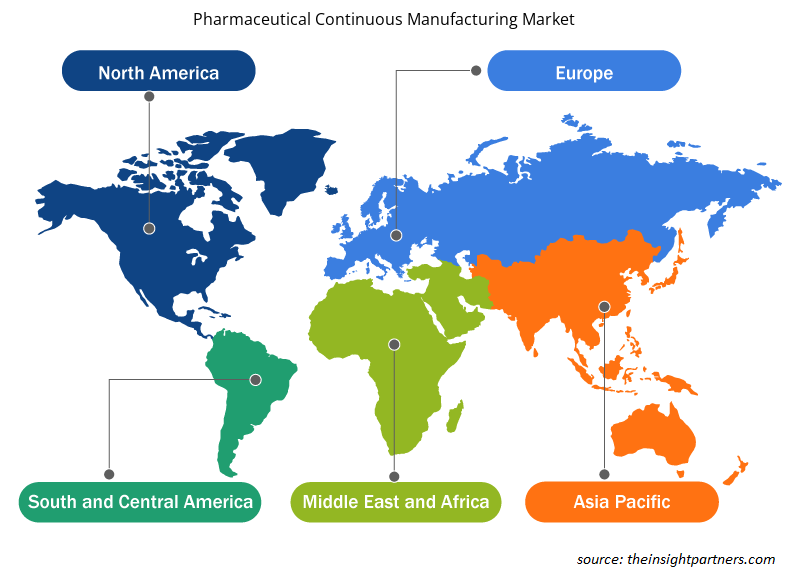
The geographic scope of the Pharmaceutical Continuous Manufacturing market report is mainly divided into five regions: North America, Asia Pacific, Europe, Middle East & Africa, and South & Central America.
North America has dominated the pharmaceutical continuous manufacturing market. The factors leading to the growth of the pharmaceutical continuous manufacturing market in North America are owing to the growing support from FDA for promoting the use of continuous manufacturing over batch manufacturing, increasing shortage of drugs in the region and presence of pharmaceutical giants that can afford the large initial investments to set up continuous manufacturing processes. Majority of the industries in the US embraced continuous manufacturing processes since decades. The US holds a dominating position within North America due to factors such as increasing number of pharmaceutical players adopting continuous manufacturing procedures, advancements in the field of manufacturing technologies and efficiency offered by these set-ups to scale up the production volumes. In addition, various initiatives were undertaken by the US FDA for promoting continuous manufacturing in the US within the pharmaceutical industries.
Pharmaceutical Continuous Manufacturing Market Regional Insights
The regional trends and factors influencing the Pharmaceutical Continuous Manufacturing Market throughout the forecast period have been thoroughly explained by the analysts at Insight Partners. This section also discusses Pharmaceutical Continuous Manufacturing Market segments and geography across North America, Europe, Asia Pacific, Middle East and Africa, and South and Central America.
- Get the Regional Specific Data for Pharmaceutical Continuous Manufacturing Market
Pharmaceutical Continuous Manufacturing Market Report Scope
| Report Attribute | Details |
|---|---|
| Market size in 2023 | US$ 2.08 Billion |
| Market Size by 2031 | US$ 4.67 Billion |
| Global CAGR (2023 - 2031) | 10.6% |
| Historical Data | 2021-2022 |
| Forecast period | 2024-2031 |
| Segments Covered |
By Product
|
| Regions and Countries Covered | North America
|
| Market leaders and key company profiles |
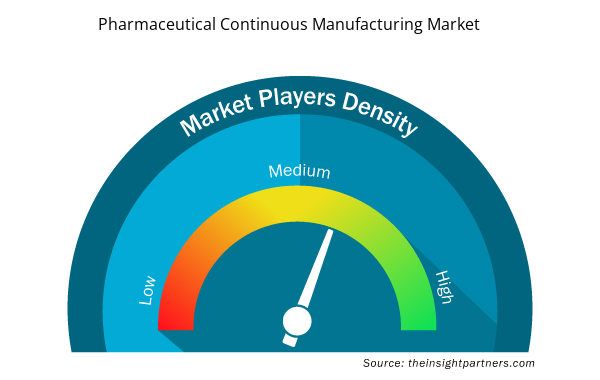
Pharmaceutical Continuous Manufacturing Market Players Density: Understanding Its Impact on Business Dynamics
The Pharmaceutical Continuous Manufacturing Market is growing rapidly, driven by increasing end-user demand due to factors such as evolving consumer preferences, technological advancements, and greater awareness of the product's benefits. As demand rises, businesses are expanding their offerings, innovating to meet consumer needs, and capitalizing on emerging trends, which further fuels market growth.
Market players density refers to the distribution of firms or companies operating within a particular market or industry. It indicates how many competitors (market players) are present in a given market space relative to its size or total market value.
Major Companies operating in the Pharmaceutical Continuous Manufacturing Market are:
- GEA Group
- Coperion GmbH
- Gericke AG
- Glatt GmbH
- Hosokawa Micron Group
- Munson Machinery Co. Inc.
Disclaimer: The companies listed above are not ranked in any particular order.
- Get the Pharmaceutical Continuous Manufacturing Market top key players overview
Pharmaceutical Continuous Manufacturing Market News and Recent Developments
The Pharmaceutical Continuous Manufacturing market is evaluated by gathering qualitative and quantitative data post primary and secondary research, which includes important corporate publications, association data, and databases. A few of the developments in the Pharmaceutical Continuous Manufacturing market are listed below:
- South Korea-based contract development and manufacturing organization (CDMO) SK Bioscience has broken ground on an approximately 4,200 m2 expansion of its L House vaccine manufacturing facility in Andong, Gyeongsangbuk-do, South Korea, which will serve as the production base for pneumococcal conjugate vaccine candidate GBP410, jointly developed by SK Bioscience and Sanofi, who are co-investing in the expansion. (SK Bioscience, Press Release, March 2024)
- Phlow Corp., a US-based essential medicines public benefit company, announced strategic alliances with both Virginia Commonwealth University’s (VCU) Medicines for All Institute and AMPAC Fine Chemicals to provide contract continuous manufacturing research and development (R&D) services for small molecule pharmaceutical products. In addition to its robust and growing internal capabilities, Phlow’s network of established, innovative, and experienced strategic partners will provide high quality, US-based advanced manufacturing solutions for small molecule active pharmaceutical ingredients (APIs) and registered starting materials (RSMs) across all stages of development using state-of-the-art technologies and unique industry insights. (Phlow Corp., News, March 2022)
Pharmaceutical Continuous Manufacturing Market Report Coverage and Deliverables
The “Pharmaceutical Continuous Manufacturing Market Size and Forecast (2021–2031)” report provides a detailed analysis of the market covering below areas:
- Pharmaceutical continuous manufacturing market size and forecast at global, regional, and country levels for all the key market segments covered under the scope
- Pharmaceutical continuous manufacturing market trends as well as market dynamics such as drivers, restraints, and key opportunities
- Detailed PEST and SWOT analysis
- Pharmaceutical continuous manufacturing market analysis covering key market trends, global and regional framework, major players, regulations, and recent market developments
- Industry landscape and competition analysis covering market concentration, heat map analysis, prominent players, and recent developments for the pharmaceutical continuous manufacturing market
- Detailed company profiles
- Historical Analysis (2 Years), Base Year, Forecast (7 Years) with CAGR
- PEST and SWOT Analysis
- Market Size Value / Volume - Global, Regional, Country
- Industry and Competitive Landscape
- Excel Dataset

- Mobile Phone Insurance Market
- Adaptive Traffic Control System Market
- Cling Films Market
- Sandwich Panel Market
- Identity Verification Market
- Nitrogenous Fertilizer Market
- Arterial Blood Gas Kits Market
- Medical Devices Market
- Analog-to-Digital Converter Market
- Authentication and Brand Protection Market

Report Coverage
Revenue forecast, Company Analysis, Industry landscape, Growth factors, and Trends

Segment Covered
Product ; Application ; End User and Geography

Regional Scope
North America, Europe, Asia Pacific, Middle East & Africa, South & Central America

Country Scope
Argentina, Australia, Brazil, Canada, China, France, Germany, India, Italy, Japan, Mexico, Saudi Arabia, South Africa, South Korea, Spain, United Arab Emirates, United Kingdom, United States
Frequently Asked Questions
Which region dominated the pharmaceutical continuous manufacturing market in 2023?
The North America region dominated the pharmaceutical continuous manufacturing market in 2023.
What are the driving factors impacting the pharmaceutical continuous manufacturing market?
Increasing shortage of medicines, and advantages offered by continuous manufacturing process are the driving factors impacting the pharmaceutical continuous manufacturing market.
What are the future trends of the pharmaceutical continuous manufacturing market?
Growing support from regulatory bodies, rising adoption by contract and in-house manufacturers for drug manufacturing procedures, and advantages associated with continuous manufacturing are likely to act as future trends for the pharmaceutical continuous manufacturing market.
Which are the leading players operating in the pharmaceutical continuous manufacturing market?
GEA Group and Thermo Fisher Scientific Inc. are the leading players operating in the pharmaceutical continuous manufacturing market.
What would be the estimated value of the pharmaceutical continuous manufacturing market by 2031?
US$ 4.67 billion would be the estimated value of the pharmaceutical continuous manufacturing market by 2031.
What is the expected CAGR of the pharmaceutical continuous manufacturing market?
10.6% is the CAGR of the pharmaceutical continuous manufacturing market.
 Get Free Sample For